. 2024 Jun;29(6):1620-1635.
doi: 10.1038/s41380-022-01834-x. Epub 2022 Oct 24.

Analyses of the autism-associated neuroligin-3 R451C mutation in human neurons reveal a gain-of-function synaptic mechanism

Affiliations

Analyses of the autism-associated neuroligin-3 R451C mutation in human neurons reveal a gain-of-function synaptic mechanism

Le Wang et al. Mol Psychiatry. 2024 Jun.

Abstract

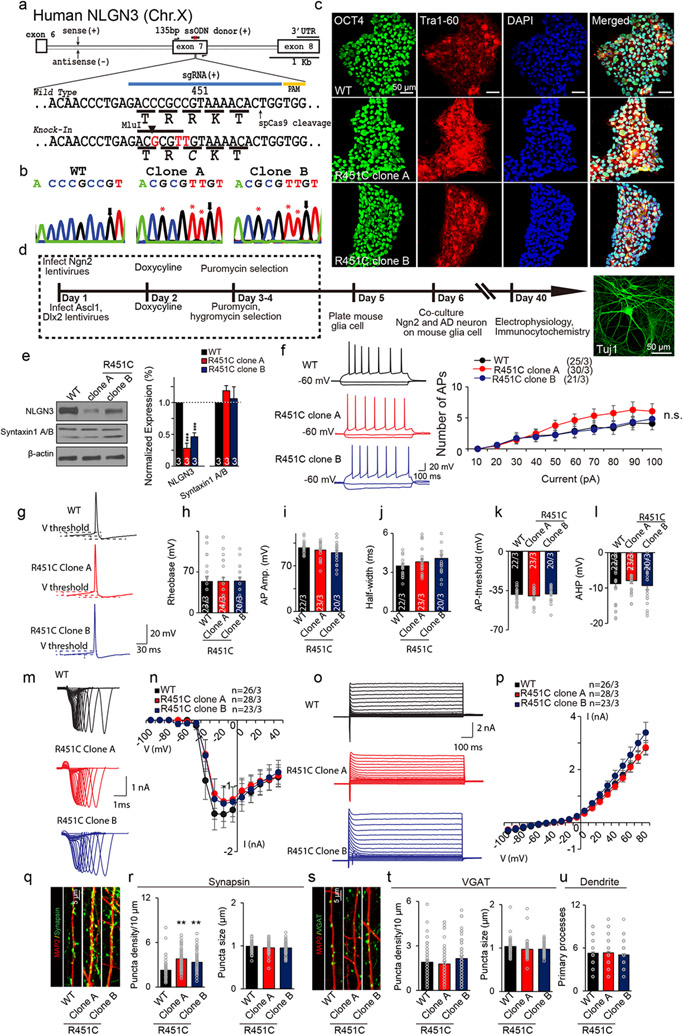
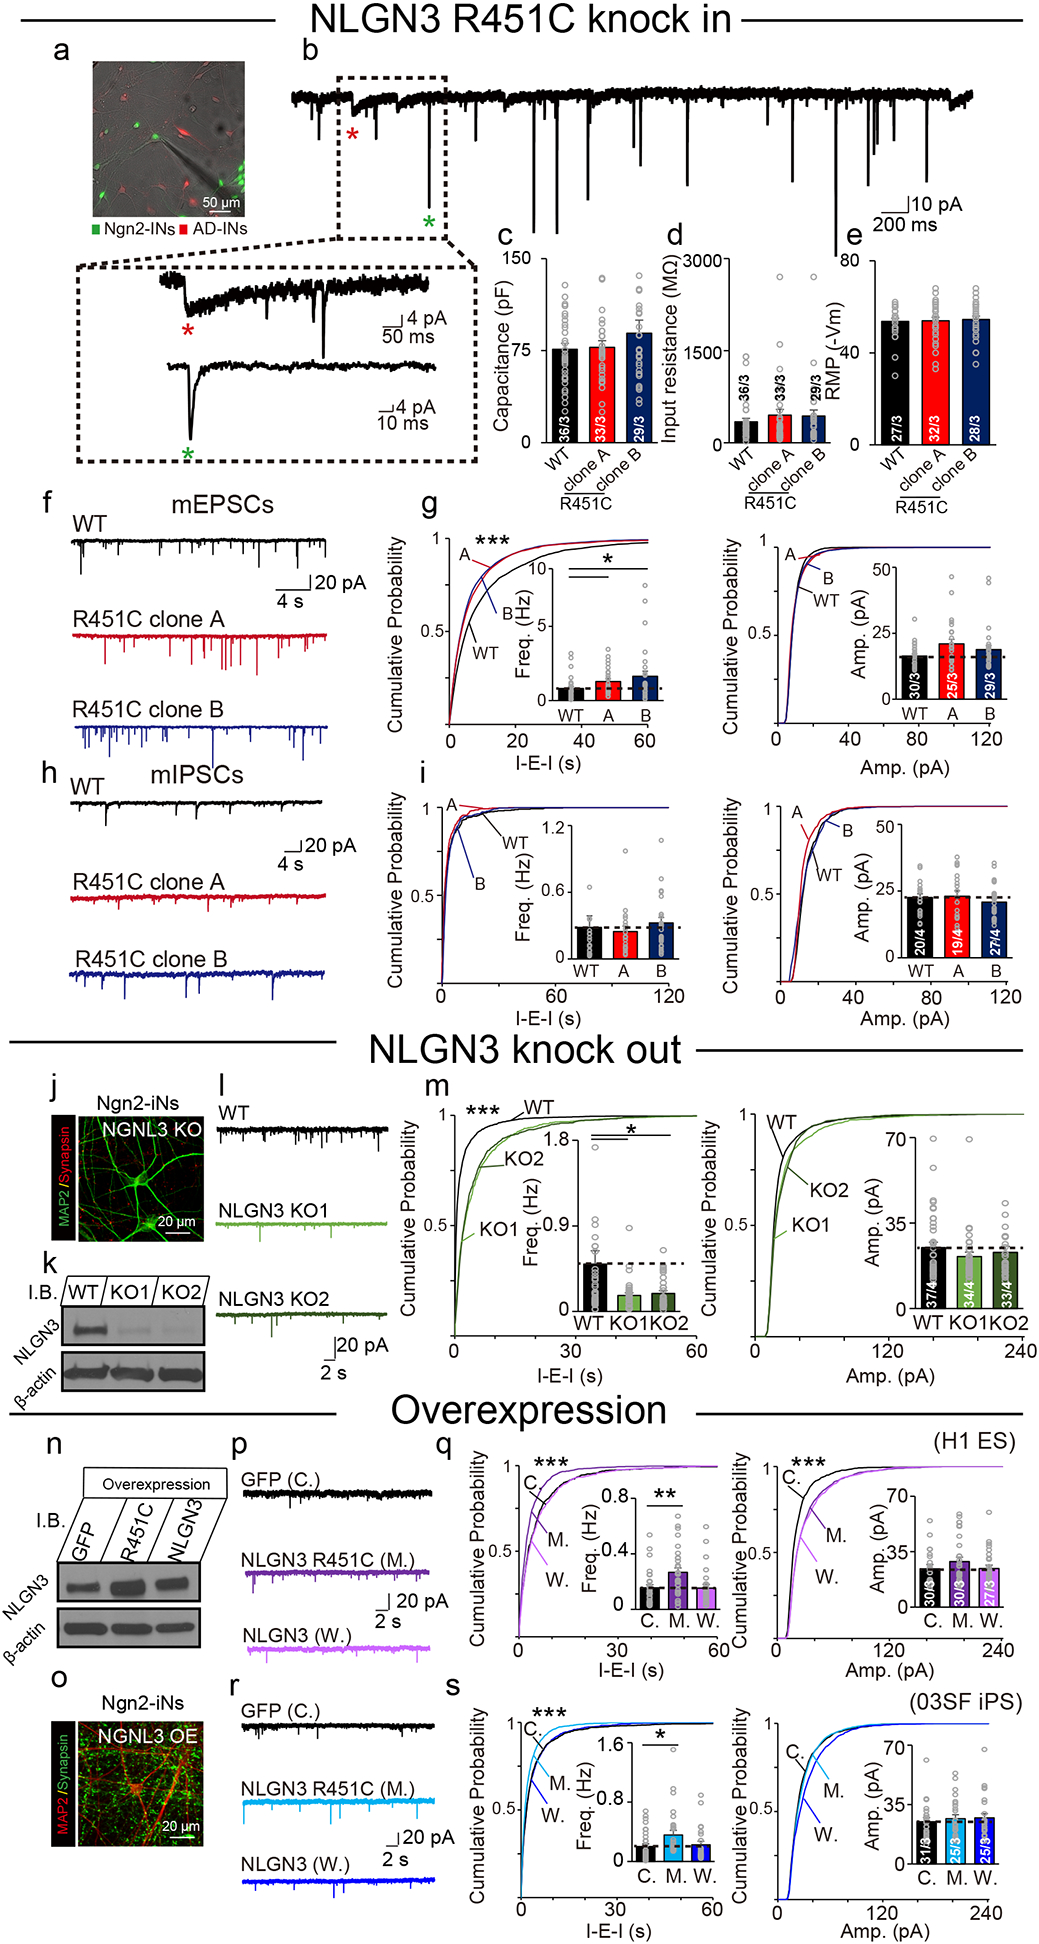
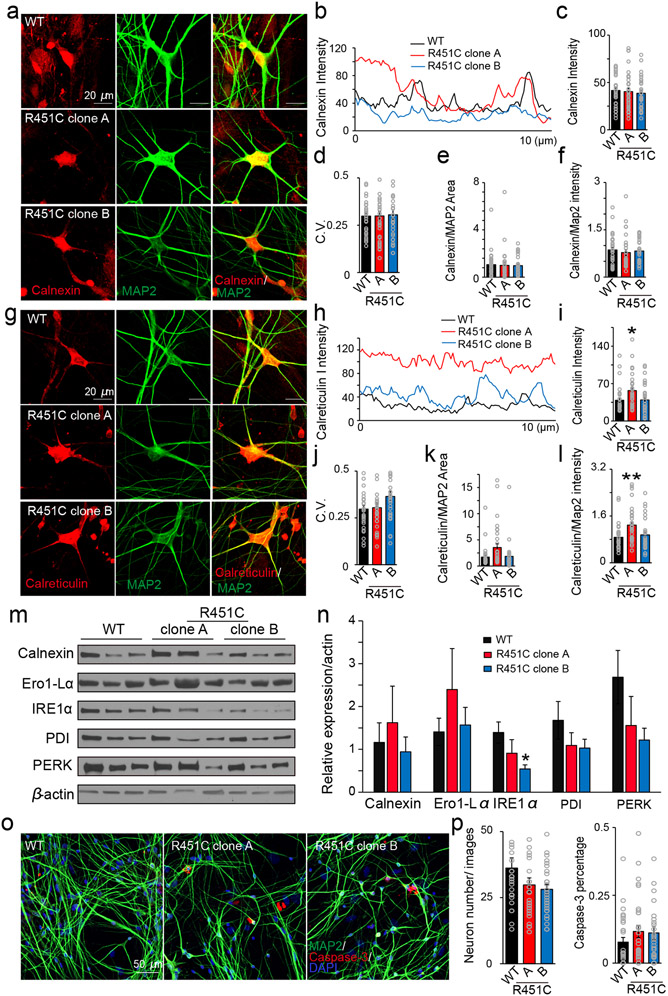
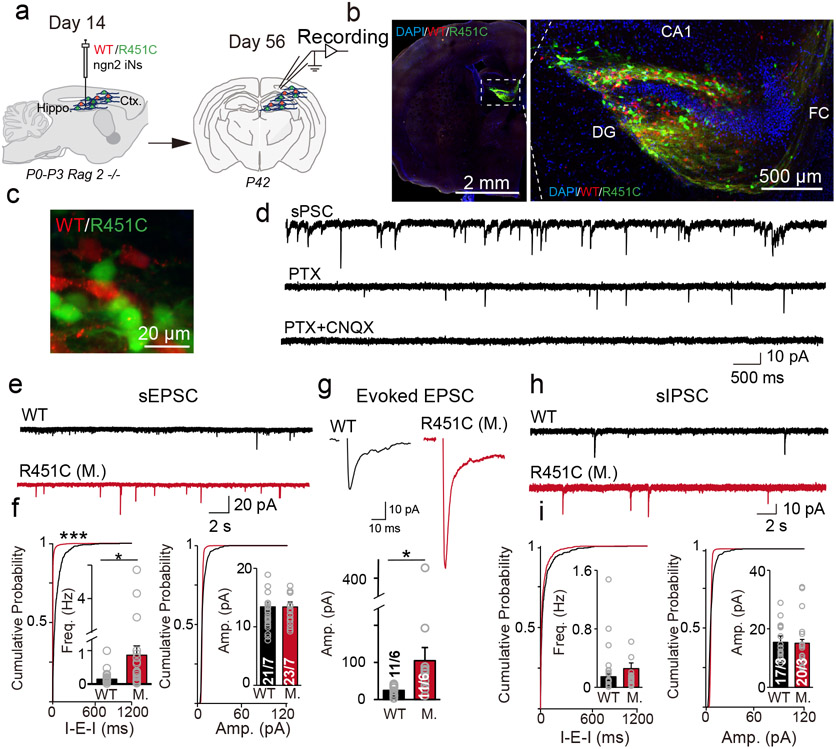
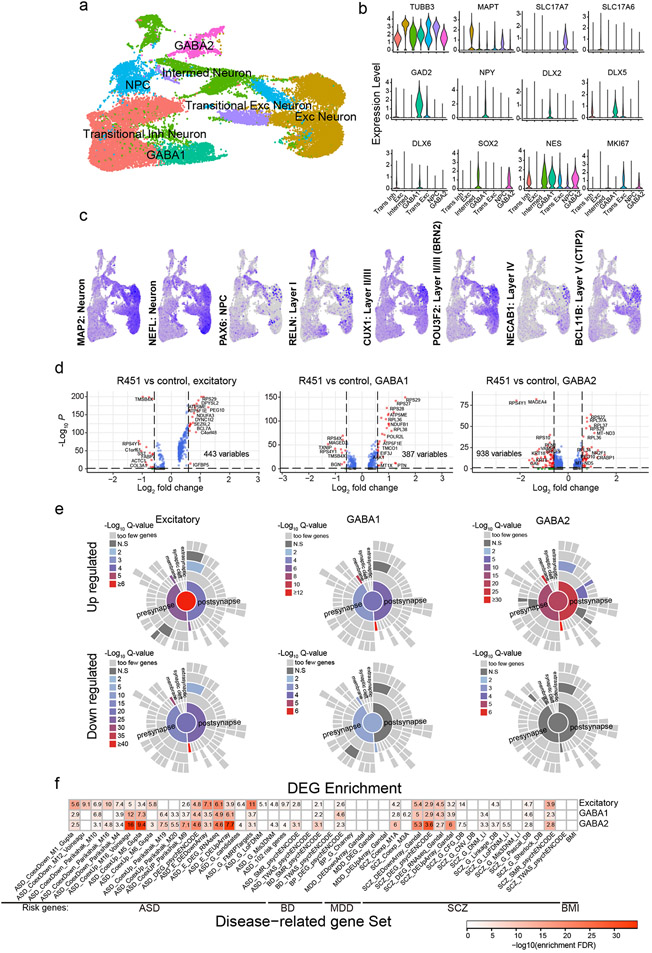
Mutations in many synaptic genes are associated with autism spectrum disorders (ASD), suggesting that synaptic dysfunction is a key driver of ASD pathogenesis. Among these mutations, the R451C substitution in the NLGN3 gene that encodes the postsynaptic adhesion molecule Neuroligin-3 is noteworthy because it was the first specific mutation linked to ASDs. In mice, the corresponding Nlgn3 R451C-knockin mutation recapitulates social interaction deficits of ASD patients and produces synaptic abnormalities, but the impact of the NLGN3 R451C mutation on human neurons has not been investigated. Here, we generated human knockin neurons with the NLGN3 R451C and NLGN3 null mutations. Strikingly, analyses of NLGN3 R451C-mutant neurons revealed that the R451C mutation decreased NLGN3 protein levels but enhanced the strength of excitatory synapses without affecting inhibitory synapses; meanwhile NLGN3 knockout neurons showed reduction in excitatory synaptic strengths. Moreover, overexpression of NLGN3 R451C recapitulated the synaptic enhancement in human neurons. Notably, the augmentation of excitatory transmission was confirmed in vivo with human neurons transplanted into mouse forebrain. Using single-cell RNA-seq experiments with co-cultured excitatory and inhibitory NLGN3 R451C-mutant neurons, we identified differentially expressed genes in relatively mature human neurons corresponding to synaptic gene expression networks. Moreover, gene ontology and enrichment analyses revealed convergent gene networks associated with ASDs and other mental disorders. Our findings suggest that the NLGN3 R451C mutation induces a gain-of-function enhancement in excitatory synaptic transmission that may contribute to the pathophysiology of ASD.


Figures

Fig. 1
Fig. 1. NLGN3 R451C mixed culture of induced neuronal (iN) cells.
a NLGN3 R451C targeting strategy. The blue line indicates the sgRNA sequences, and the yellow line is the PAM. 135 bp single-stranded oligodeoxynucleotide (ssODNs) is the base for direct homologous recombination of NLGN3 exon 7 genomic sequence. We inserted a Mlu1 restriction site for genotyping. b Confirmation of NLGN3 R451C knockin cell lines by Sanger sequencing. * indicates mutated nucleotide. c Immunostaining of stem cell marker genes in control and converted ES cell lines. DAPI was used to visualize the cell nucleus. OCT4 (green) is expressed in the nucleus colocalized with DAPI, and Tra-160 (red) is expressed in the cell body. d Experimental design of Ngn2 (GFP) and Ascl1, Dlx2 (mCherry) iNs mixed culture paradigm. e Quantification of NLGN3 and Syntaxin protein expression levels in mixed culture of iN cells, N = 3. f Representative traces and quantification plot of step current injection action potential firing number. g Representative traces of Action Potentials (AP) recorded from control and R451C-iNs. Summary graphs of Rheobase (h), AP amplitude (i), AP half-width (j), AP threshold (k), and hyperpolarization potential (AHP) amplitude (l). Representative traces (m) and quantification (n) of whole-cell voltage-dependent sodium currents in control and R451C-iNs. Representative traces (o) and quantification (p) of whole-cell voltage-dependent potassium currents in control and R451C-iNs. q Representative images of synaptic puncta (labeled by synapsin immunofluorescence, green) associated with dendrites (visualized by MAP2 immunofluorescence, red) in control and R451C-iNs. r Quantification of synapsin puncta densities per 10 μm (n = 60) and puncta sizes (Synapsin, n = 60). s Representative images of inhibitory synapses immunolabeled with VGAT (green) and MAP2 (red) in control and R451C-iNs. t Quantification of VGAT puncta densities per 10 μm (n = 60), puncta sizes (VGAT, n = 60). u Quantification of primary dendrite numbers (n = 60) in control and R451C-iNs. Data are depicted as means ± SEM. Statistical significance was assessed by one-way ANOVA (**P < 0.01).
Fig. 2
Fig. 2. NLGN3 R451C increases excitatory neurotransmission in vitro.
a Representative image of recording mixed culture iNs. Green cells are Ngn2 iNs, red cells are Ascl1 and Dlx2 iNs. b Representative sPSC trace of mixed culture iNs. Green * indicate EPSC-like event, red * indicates IPSC-like event. ce Intrinsic electrophysiology characterization of control and converted R451C-iNs. Summary of passive membrane properties (capacitance, input resistance, resting membrane potential). f Representative traces of mEPSCs (with 1 μM TTX and 50 μM PTX) in control and R451C human iNs. g Cumulative distribution and quantification (inserts) of mEPSC frequency (inter-event-interval, I-E-I, left panel) and amplitude (right panel) of mEPSCs in control and R451C-iNs. h Representative traces of mIPSCs (with 1 μM TTX and 20 μM CNQX) in control and R451C human iNs. i Cumulative distribution and quantification (inserts) of mIPSC frequency (left panel) and amplitude (right panel). j Representative images of control and NLGN3 knockout (KO) iNs. k NLGN3 expression level in control and NLGN3 KO Ngn2-iNs. l Representative traces of mEPSCs in control and NLGN3 KO iNs. m Cumulative distribution and quantification (inserts) of mEPSCs frequency (left panel) amplitudes (right panel) in control and NLGN3 KO iNs. n Overexpression of human wild type- and R451C NLGN3 in Ngn2-iNs. o Representative neuronal images of Ngn2 iNs with overexpression of human NLGN3 R451C. p Representative traces of mEPSCs in control, NLGN3, and NLGN3 R451C overexpression-Ngn2 iNs generated from H1 ES cell line. q Cumulative distribution and quantification (inserts) of mEPSC frequency (left panel) and amplitude (right panel) in control (C.), NLGN3 R451C overexpression (M.), wild type NLGN3 overexpression (W.) iNs derived from H1 ES cell line. r Representative traces of mEPSCs in control, NLGN3, and NLGN3 R451C overexpression-Ngn2 iNs generated from iPS cell line. q Cumulative distribution and quantification (inserts) of mEPSC frequency (left panel) and amplitude (right panel) in control (C.), NLGN3 R451C overexpression (M.), wild type NLGN3 overexpression (W.) iNs derived from iPS cell line. Data are mean ± SEM; Number of cultured cells/ cultured batches are shown in bars. Statistical significance (*p < 0.05, **p < 0.01) was evaluated with the Kolmogorov–Smirnov test (cumulative probability plots) and one-way ANOVA (bar graphs).
Fig. 3
Fig. 3. No major ER stress found in human neurons carrying NLGN3 R451C mutation.
a Representative images of Calnexin (red) and MAP2 (red) in R451C and control iNs. bd Calnexin intensity and distribution over 10 μm line for each cell. e, f Somatic Calnexin area and intensity normalized with MAP2 signals. g Representative images of Calreticulin (red) and MAP2 (red) in control and R451C-iNs. h–j Calreticulin intensity and distribution over 10 μm line for each cell. k, l Somatic Calreticulin area and intensity normalized with MAP2. m Analysis of ER stress markers (immunoblot) in the excitatory-inhibitory co-cultured iNs. n Quantification of ER stress markers protein expression level N = 6, 3 cultures 2 repeats. o Representative images of Caspase-3 (red), MAP2 (green), and DAPI human neurons carrying wild-type or R451C NLGN3. p Quantification of neuronal density (DAPI and MAP) and Caspase-3+ cells. Statistical significance (*p < 0.05; **p < 0.01) was evaluated with Student’s t-test (bar graphs).
Fig. 4
Fig. 4. Dual-color genotype transplantation of ESC H1 and NLGN3 R451C human iN cells in vivo.
a Experimental design of control (mCherry) and R451C (mVenus) iNs transplant in vivo. b Representative images of iN cells transplanted in Rag2−/− hippocampal region, a control line (mCherry), and R451C lines (mVenus). c Representative images of control and R451C converted iNs in vivo. d Representative sPSC trace of transplanted iNs in vivo. Slow responses could be blocked by picrotoxin (PTX). In the presence of PTX and CNQX (both 50 μM), no spontaneous activities were observed. e Representative sEPSC trace of control/R451C in vivo. f Quantification of sEPSC frequency and amplitude in vivo. g Representative trace and quantification of evoked EPSCs. h Representative sIPSC trace of control/R451C in vivo. i Quantification of sIPSC frequency and amplitude in vivo. The black and red bar represents control ES cell line and R451C converted cell lines. Data are mean + SEM; Numbers of cultured cells/ culture batches are shown in bars. Statistical significance (*p < 0.05) was evaluated with the Kolmogorov–Smirnov test (cumulative probability plots) and one-way ANOVA (bar graphs).
Fig. 5
Fig. 5. Single-cell RNA seq of E/I mixed culture R451C human iNs.
a UMAP of all human neuronal cells (n = 27,724) reveals seven distinct neuronal subtypes. b Expression levels of human neuron and progenitor marker for each neuronal subtype. c Human induced neurons express mature neuron and cortical layer marker features. d DEGs in R451C versus control in excitatory, GABA1, and GABA2 neuron subtypes with all replicates pooled. Differential expression is defined by FDR < 0.05 and log2FC > 0.25. e Sunburst plots of enriched synGO term in excitatory, GABA1, and GABA2 neuron subtypes. f Overrepresentation of ASD, SCZ, BD, MDD, and BMI-related genes in excitatory, GABA1, and GABA2 neuron subtypes DEGs. The color of the box shows the odds ratio for enrichment (shades of red for significant enrichment, adjust p < 0.05).

Similar articles

Cited by

References

    1. Colvert E, Tick B, McEwen F, Stewart C, Curran SR, Woodhouse E, et al. Heritability of autism spectrum disorder in a UK population-based twin sample. JAMA Psychiatry. 2015;72:415–23. - PMC - PubMed
    1. Geschwind DH, Flint J. Genetics and genomics of psychiatric disease. Science. 2015;349:1489–94. - PMC - PubMed
    1. Sandin S, Lichtenstein P, Kuja-Halkola R, Larsson H, Hultman CM, Reichenberg A. The familial risk of autism. JAMA. 2014;311:1770–7. - PMC - PubMed
    1. Skuse DH, Mandy WP, Scourfield J. Measuring autistic traits: heritability, reliability and validity of the Social and Communication Disorders Checklist. Br J Psychiatry. 2005;187:568–72. - PubMed
    1. Zoghbi HY, Bear MF. Synaptic dysfunction in neurodevelopmental disorders associated with autism and intellectual disabilities. Cold Spring Harb Perspect Biol. 2012;4:a009886. - PMC - PubMed

MeSH terms