. 2023 Feb;28(2):919-930.
doi: 10.1038/s41380-022-01841-y. Epub 2022 Oct 24.

Gut microbiota regulates chronic ethanol exposure-induced depressive-like behavior through hippocampal NLRP3-mediated neuroinflammation

Affiliations

Gut microbiota regulates chronic ethanol exposure-induced depressive-like behavior through hippocampal NLRP3-mediated neuroinflammation

Hui Yao et al. Mol Psychiatry. 2023 Feb.

Abstract

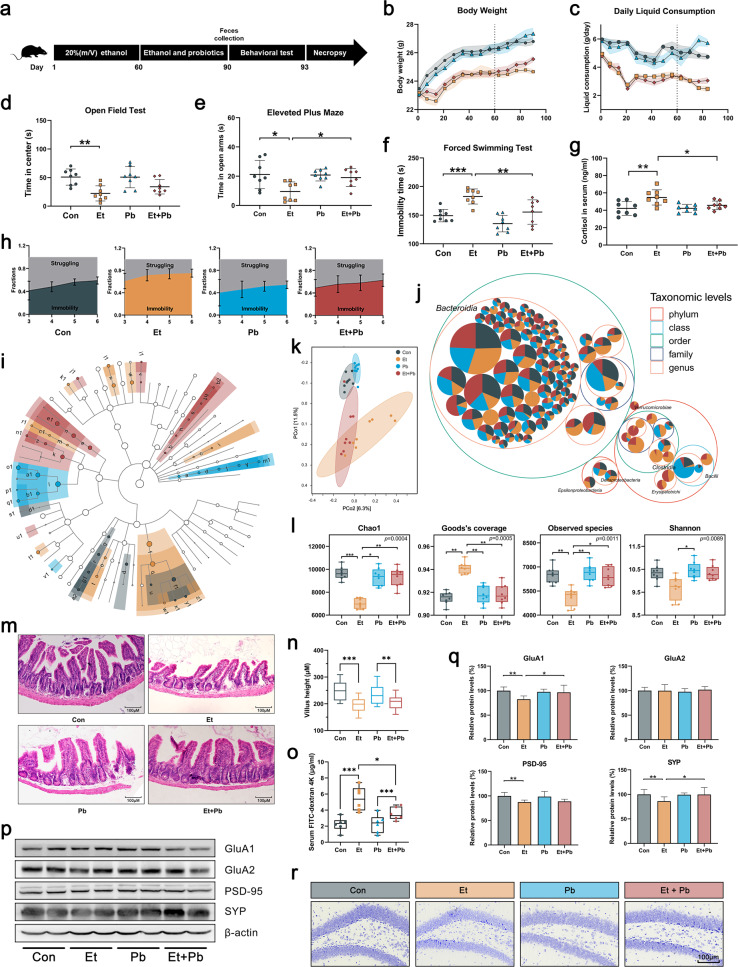
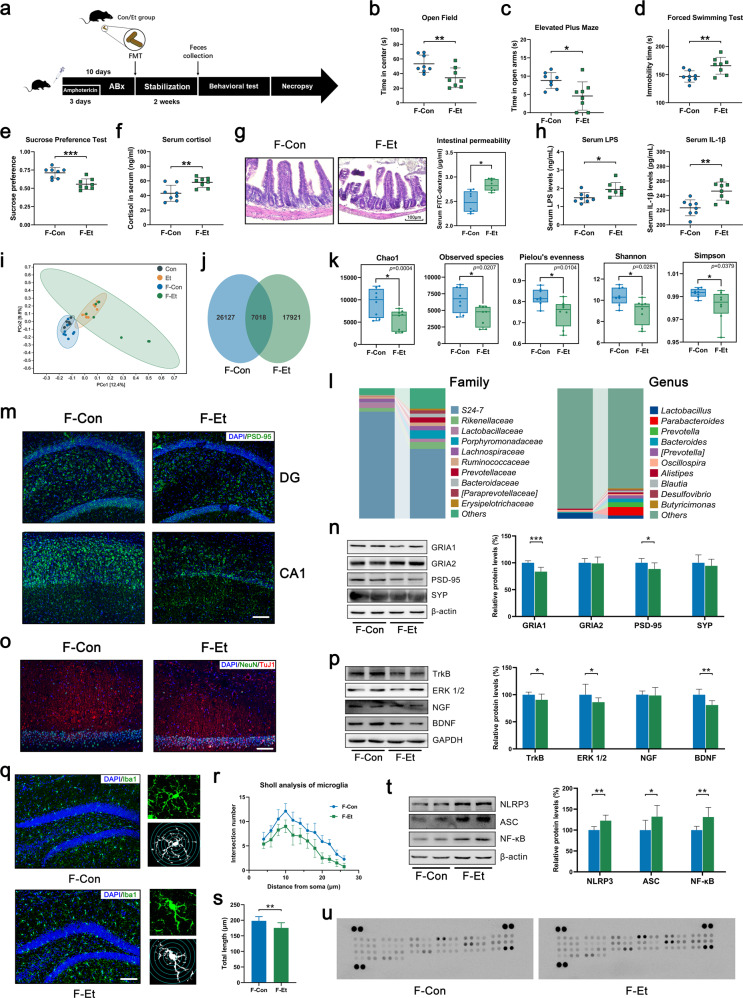
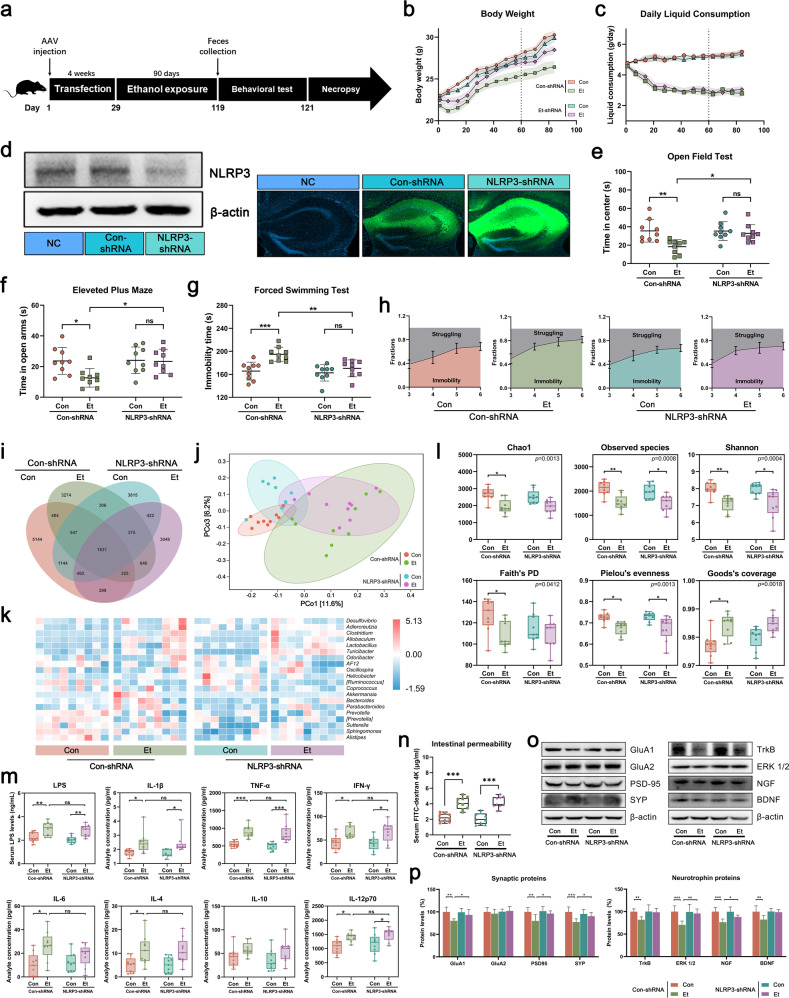
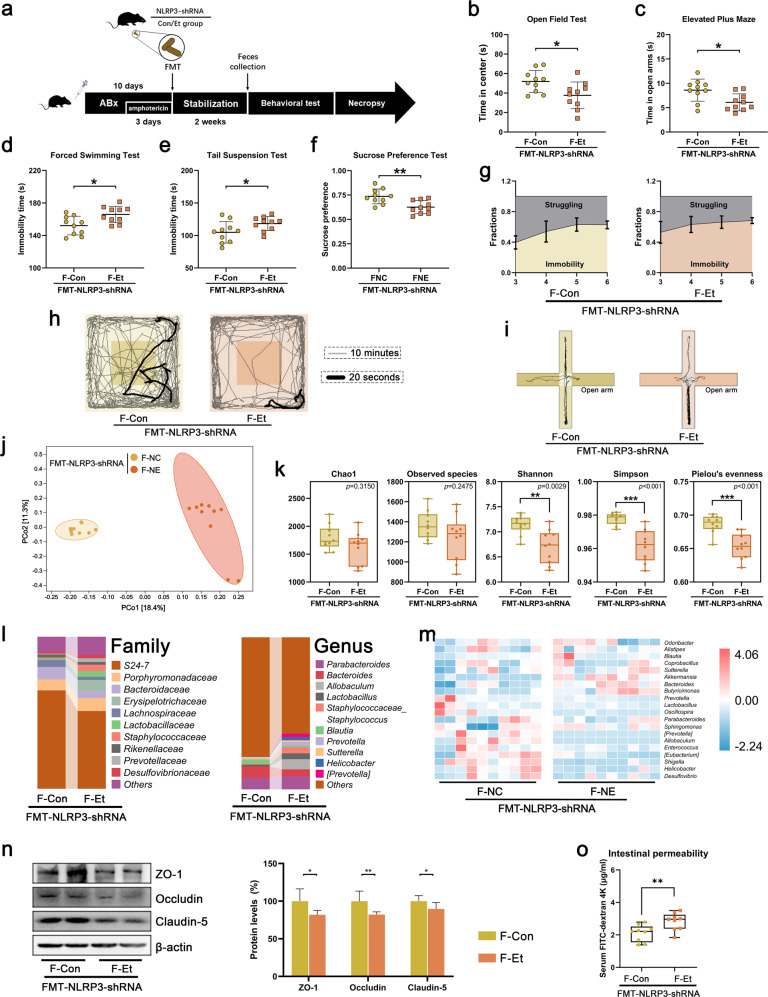
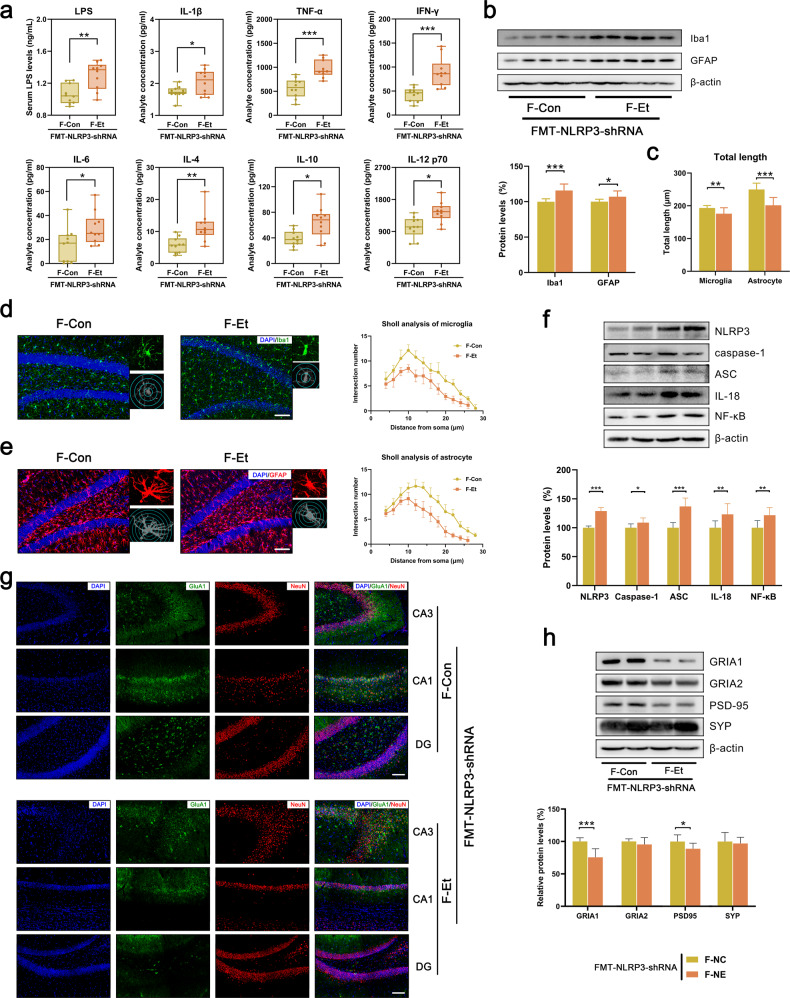
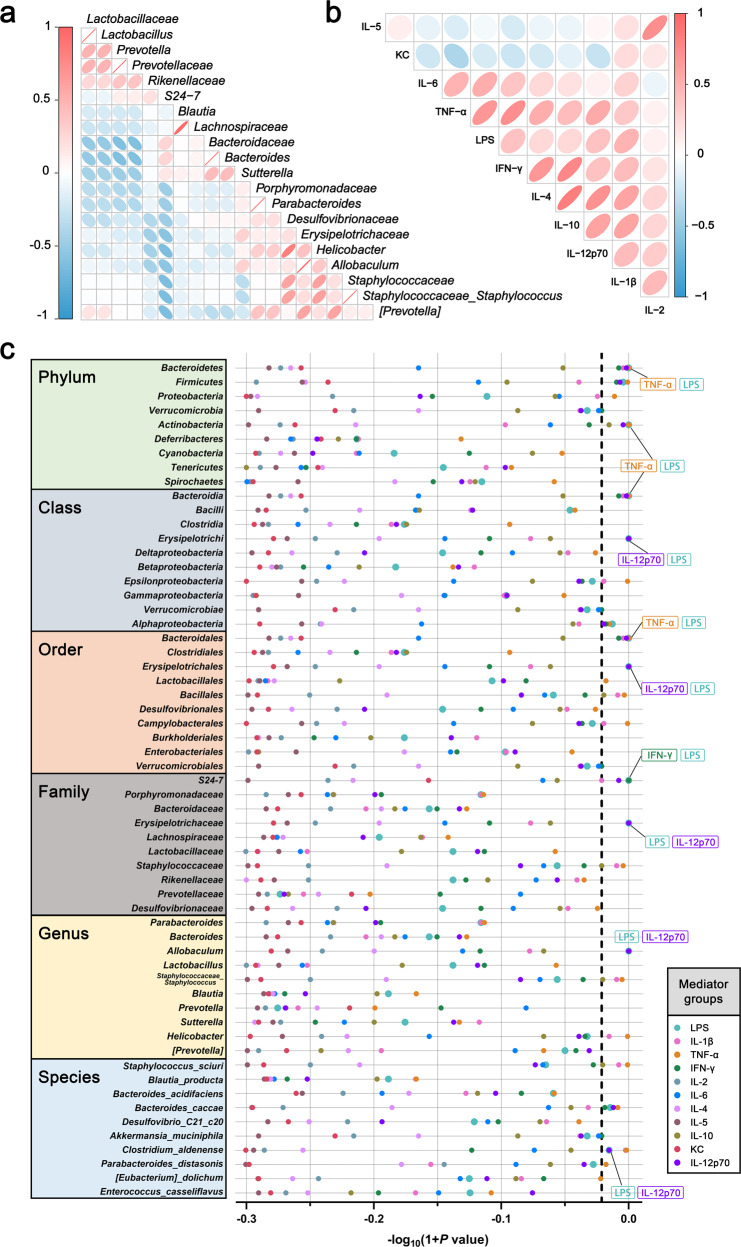
Chronic ethanol exposure (CEE), which can lead to neuroinflammation, is an increasing risk factor for depression disorder, but the underlying mechanism is not clear. Recent observations have revealed the associations among psychiatric disorders, ethanol exposure and alterations of the gut microbiota. Here, we found that CEE induced depressive-like behavior, which could be alleviated by probiotics and transferred from donor to recipient mice by fecal microbiota transplantation (FMT). Neuroinflammation and the activation of the NLRP3 inflammasome were also observed in recipient mice. The downregulation of NLRP3 in the hippocampus mitigated CEE-induced depressive-like behavior and neuroinflammation but had no significant effect on FMT recipient mice. Moreover, elevated serum inflammatory factors in recipient mice showed a significant mediation effect between the gut microbiota and depressive-like behavior. Together, our study findings indicate that the gut microbiota contributes to both hippocampal NLRP3-mediated neuroinflammation and depressive-like behavior induced by CEE, which may open avenues for potential interventions against CEE-associated psychiatric disorders.


Conflict of interest statement

The authors declare no competing interests.

Figures

Fig. 1
Fig. 1. Probiotics alleviated CEE-induced depressive-like behavior and gut microbiota dysbiosis.
a Experimental design. b Body weight of mice. c Daily liquid consumption of mice. d Time spent in the central area of the OFT. e Time spent in the open arms of the EPM. f Immobility time in the FST. g Serum cortisol concentration. h Dynamic motion state in the FST. i Linear discriminant analysis effect size (LEfSe) analysis showed the significantly enriched microbiome in each group (the legend is shown in Fig. S2b). j Taxonomic differences are based on 16S rRNA gene sequences extracted from the metagenome. k PCoA plot showing unweighted UniFrac distances, demonstrating significant changes in the gut microbiota after CEE and probiotic administration. l Probiotics attenuated CEE-induced changes in α-diversity. m, n Villus length with representative photomicrographs of ileal tissue (scale bar = 100 μm). o Intestinal permeability was detected by FD4 gavage. p, q Representative Western blot of synaptic proteins in the hippocampus and quantification. r Representative Nissl staining of the hippocampal dentate gyrus (DG) area (scale bar = 100 μm). Data are expressed as the mean ± SD, n = 8. *p < 0.05, **p < 0.01, ***p < 0.001.
Fig. 2
Fig. 2. FMT from CEE-exposed mice induced depressive-like behavior and hippocampal neuroinflammation in recipient mice.
a Experimental design of FMT. b Time in the central area of the OFT. c Time spent in the open arms of the EPM. d Immobility time in the FST. e Immobility time in the TST. f Cortisol concentration in mouse serum. g Representative photomicrographs of ileum tissue and intestinal permeability (scale bar = 100 μm). h Serum LPS and IL-1β concentrations. i PCoA plot showing unweighted UniFrac distances between donor mice and recipient mice. j Venn diagram of the OTUs detected in the recipient mice. k Difference in α-diversity among recipient mice. l Barplots showing the relative abundance of the gut microbiota at the family and genus levels. m, n IF and Western blot showing that FMT from CEE-exposed mice reduced the expression of synaptic proteins in the hippocampus (scale bar = 100 μm). o IF of NeuN and TuJ1 showing the state of neurons in the hippocampal CA1 area (scale bar = 100 μm). p Western blot showing that FMT from CEE-exposed mice reduced the expression of neurotrophic proteins in the hippocampus. qs IF of Iba1 and Sholl analysis showing the number, morphology, and length of microglia in the hippocampus (scale bar = 100 μm). t FMT from CEE-exposed mice reduced the expression of NLRP3, ASC and NF-κB in the hippocampus. u Mouse cytokine array showed an increase in 18 inflammatory factors or chemokines in the hippocampus after FMT from CEE-exposed mice (the legend is shown in Fig. S7). Data are expressed as the mean ± SD, n = 8. *p < 0.05, **p < 0.01, ***p < 0.001.
Fig. 3
Fig. 3. Effects of hippocampal NLRP3 in CEE-exposed mice.
a Experimental design for AAV transfection and CEE administration. b Body weight of mice. c Daily liquid consumption of mice. d Effect of GFP-labeled AAV transfection on reducing hippocampal NLRP3 expression. e Time spent in the central area of the OFT. f Time spent in the open arms of the EPM. g Immobility time in the FST. h Dynamic motion state in the FST. i Venn diagram of the OTUs. j PCoA plot showing unweighted UniFrac distances among transfected mice. k Heatmap showing the distribution trends of species abundance in each sample. l Difference in α-diversity among transfected mice. m Serum LPS and inflammatory cytokine concentrations detected by ELISA and Luminex assays. n Intestinal permeability was detected by FD4 gavage. o, p Expression of synaptic proteins and neurotrophic proteins in the hippocampus of transfected mice. Data are expressed as the mean ± SD, n = 9. *p < 0.05, **p < 0.01, ***p < 0.001.
Fig. 4
Fig. 4. FMT from hippocampal NLRP3-downregulated mice induced depressive-like behavior in recipient mice.
a Experimental design for FMT from hippocampal NLRP3-downregulated mice. b Time in the central area of the OFT. c Time spent in the open arms of the EPM. d Immobility time in the FST. e Immobility time in the TST. f Sucrose preference in the SPT. g The dynamic motion state in the FST. h Representative tracks of recipient mice in the OFT. i Representative tracks of recipient mice in the EPM. j PCoA plot showing unweighted UniFrac distances among recipient mice. k Difference in α-diversity among recipient mice. l Barplots showing the relative abundance of the gut microbiota at the family and genus levels. m Heatmap showing the distribution trends of species abundance in each sample. n Western blot showing the expression of tight junction proteins in ileal tissue. o Intestinal permeability was detected by FD4 gavage. Data are expressed as the mean ± SD, n = 10. *p < 0.05, **p < 0.01, ***p < 0.001.
Fig. 5
Fig. 5. FMT from hippocampal NLRP3-downregulated mice induced systemic inflammation in recipient mice.
a Serum LPS and inflammatory cytokine concentrations in recipient mice detected by ELISA and Luminex assays. b Western blot showing the expression of Iba1 and GFAP in the hippocampus of recipient mice. ce IF of Iba1/GFAP and Sholl analysis showing the number, morphology, and length of microglia/astrocytes in the hippocampus (scale bar = 100 μm). f Western blot showing the expression of NLRP3, caspase-1, ASC, IL-18 and NF-κB. g, h Western blot and IF showing the expression of synaptic proteins in the hippocampus (scale bar = 100 μm). Data are expressed as the mean ± SD, n = 10. *p < 0.05, **p < 0.01, ***p < 0.001.
Fig. 6
Fig. 6. LPS and inflammatory cytokines mediate the association between the gut microbiota and depressive-like behavior.
a Correlation between the gut microbiota. b Correlation between LPS and inflammatory cytokines. c Estimated −log10(p values) of natural indirect effects from pairwise weighted mediation models (the mediation model is shown in Fig. S14) for depressive-like behavior. The dashed vertical line signifies a p value threshold of 0.05, and the points on the right side of the line estimates are below that threshold. Overlapping points have been labeled.

Similar articles

Cited by

References

    1. Carvalho AF, Heilig M, Perez A, Probst C, Rehm J. Alcohol use disorders. Lancet. 2019;394:781–92. doi: 10.1016/S0140-6736(19)31775-1. - DOI - PubMed
    1. Rao R, Topiwala A. Alcohol use disorders and the brain. Addiction. 2020;115:1580–9. doi: 10.1111/add.15023. - DOI - PubMed
    1. Van Skike CE, Goodlett C, Matthews DB. Acute alcohol and cognition: remembering what it causes us to forget. Alcohol. 2019;79:105–25. doi: 10.1016/j.alcohol.2019.03.006. - DOI - PubMed
    1. Wang X, Yu H, Wang C, Liu Y, You J, Wang P, et al. Chronic ethanol exposure induces neuroinflammation in H4 cells through TLR3/NF-kappaB pathway and anxiety-like behavior in male C57BL/6 mice. Toxicology. 2020;446:152625. doi: 10.1016/j.tox.2020.152625. - DOI - PubMed
    1. Gemes K, Forsell Y, Janszky I, Laszlo KD, Lundin A, Ponce DLA, et al. Moderate alcohol consumption and depression—a longitudinal population-based study in Sweden. Acta Psychiatr Scand. 2019;139:526–35. doi: 10.1111/acps.13034. - DOI - PubMed

Publication types