. 2023 Mar;19(3):292-300.
doi: 10.1038/s41589-022-01154-9. Epub 2022 Oct 24.

Hepatic glutamine synthetase controls N5-methylglutamine in homeostasis and cancer

Affiliations

Hepatic glutamine synthetase controls N5-methylglutamine in homeostasis and cancer

Victor H Villar et al. Nat Chem Biol. 2023 Mar.

Abstract

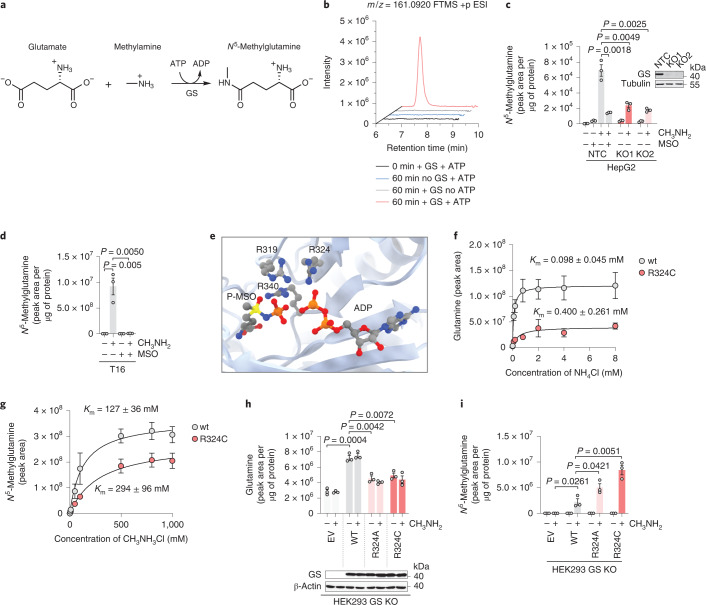
Glutamine synthetase (GS) activity is conserved from prokaryotes to humans, where the ATP-dependent production of glutamine from glutamate and ammonia is essential for neurotransmission and ammonia detoxification. Here, we show that mammalian GS uses glutamate and methylamine to produce a methylated glutamine analog, N5-methylglutamine. Untargeted metabolomics revealed that liver-specific GS deletion and its pharmacological inhibition in mice suppress hepatic and circulating levels of N5-methylglutamine. This alternative activity of GS was confirmed in human recombinant enzyme and cells, where a pathogenic mutation in the active site (R324C) promoted the synthesis of N5-methylglutamine over glutamine. N5-methylglutamine is detected in the circulation, and its levels are sustained by the microbiome, as demonstrated by using germ-free mice. Finally, we show that urine levels of N5-methylglutamine correlate with tumor burden and GS expression in a β-catenin-driven model of liver cancer, highlighting the translational potential of this uncharacterized metabolite.


Conflict of interest statement

J.O. is employed at Bruker Daltonics GmbH & Co. KG. All other authors declare no competing interests.

Figures

Fig. 1
Fig. 1. Effects of liver GS deficiency on glutamine metabolism.
a, GS-catalyzed reaction. b, Administration of AAV8-TBG-Cre in mice with wt/wt, Glulwt/tm3Whla fl and Glultm3Whla fl/tm3Whla fl genotypes results in mice with wt/wt, wt/Δ and Δ/Δ livers, respectively. c, Serial sections of mouse liver stained by IHC for GS and OAT, two markers of pericentral zones; scale bar, 1 mm. The insets show magnifications of the central vein (c) and portal vein (p); scale bar, 100 µm. The images shown are representative of three mice per genotype. d, Immunoblot of liver samples obtained from n = 3 mice per genotype. β-Actin is shown as a loading control. e,f, Glutamine levels in wt/wt (n = 9), wt/Δ (n = 9) and Δ/Δ (n = 12) livers (e) and sera (f) measured by LC–MS. g,h, Glutamate levels in the livers (g) and sera (h) of wt/wt (n = 9), wt/Δ (n = 9) and Δ/Δ (n = 12) mice. i, Ammonia concentration in blood samples from wt/wt (n = 11) and Δ/Δ (n = 12) mice. j,k, Glutamine (j) and glutamate (k) levels in the blood collected from mice 4 h after administration of vehicle (n = 4) and MSO (n = 4). l, Glutamine levels in the liver, brain, muscle and pancreas from mice treated as in j (n = 4 vehicle, n = 4 MSO). Data in el were analyzed by two-tailed Student’s t-test. Bars represent mean ± s.e.m., and each circle represents data from a single mouse. Source data
Fig. 2
Fig. 2. Metabolic imaging and glucose tracing in GS-deficient liver.
a, Serial sections of frozen liver samples from wt/wt and Δ/Δ female mice. Left, IHC staining for GS and OAT. Right, MS metabolic imaging of glutamine and glutamate. Data were normalized with the root mean square method; scale bar, 1 mm. Images are representative of n = 3 livers per genotype (Extended Data Fig. 1d,e). b, Quantification of glutamine and glutamate in the regions of interest shown in a (n = 1 wt/wt, n = 1 Δ/Δ). Boxes have bounds at the 25th to 75th percentiles, the lines represent the medians and whiskers show the 5th to 95th percentiles; each data point represents the relative intensity of one pixel. Data were analzyed by two-tailed Student’s t-test. cf, Levels of citrate (c), α-ketoglutarate (αKG; d), succinate (e) and malate (f) in the livers of wt/wt (n = 9) and Δ/Δ (n = 12) mice. g, Relative levels of 13C2 isotopolog in the livers of wt/wt (n = 4) and Δ/Δ (n = 5) mice administered U-13C6-glucose. Data were analyzed by two-tailed Student’s t-test. Bars represent mean ± s.e.m., and each circle represents data from a single mouse. Source data
Fig. 3
Fig. 3. Untargeted metabolomics reveals N5-methylglutamine as a GS product.
a,b, Manually curated volcano plots obtained from an untargeted metabolomic analysis of livers from wt/wt (n = 9) and Δ/Δ (n = 12) mice (a) or from mice treated with vehicle (n = 4) or MSO (n = 4) (b). Data were analyzed by analysis of variance and Tukey honest significant difference post hoc test. c, Extracted ion chromatograms of one representative liver sample from mice described in a and b. FTMS +p ESI, Fourier transform mass spectometry in positive polarity coupled with electrospray ionisation. d,e, Levels of the compound with formula C6H12N2O3 in the livers of wt/wt (n = 9), wt/Δ (n = 9) and Δ/Δ (n = 12) mice (d) or in the livers collected from mice 4 h after administration of vehicle (n = 4) or MSO (n = 4) (e). f,g, Levels of the compound with formula C6H12N2O3 in the sera (f) or blood (g) of mice described in d and e. Data in dg were analyzed by two-tailed Student’s t-test. h, Relative levels of the compound with formula C6H12N2O3 in the blood of vehicle-treated (n = 4) or MSO-treated (n = 4) mice. MSO was administered immediately after the first blood collection at 0 h. For each metabolite, the percentage of the maximal peak area values averaged at each time point is reported. Data were analyzed by two-tailed Student’s t-test. Circles represent mean ± s.e.m. (n = 4). i, Mirror plot of MS/MS spectra from wt/wt liver samples (n = 2) comparing parent and fragment ions generated from the compound with formula C6H12N2O3 (top) to glutamine (bottom). The inset shows a magnified m/z range of 161.0 to 161.2 showing the ion of interest (m/z 161.0920) and a coisolated ion (m/z 161.1366). The structures of putative glutamine fragments are shown (Extended Data Fig. 2b). j, Overlaid extracted ion chromatograms of m/z 161.0920 obtained from a wt/wt liver sample (n = 1, C6H12N2O3 unknown), d,l-N5-methylglutamine standard, l-N2-methylglutamine standard and l-homoglutamine standard. The retention times and molecular structures of these compounds are shown. k, Mirror plot of MS/MS data from a wt/wt liver sample (n = 1) comparing the compound with formula C6H12N2O3 (top) to d,l-N5-methylglutamine standard (bottom). The proposed structures of parent and fragment ions derived from d,l-N5-methylglutamine are shown (Extended Data Fig. 2c). Source data
Fig. 4
Fig. 4. GS synthesizes N5-methylglutamine from glutamate and methylamine.
a, Non-canonical reaction catalyzed by GS. b, Reaction mixtures described in the Methods and modified as indicated in the figure were sampled at 0 and 60 min from the addition of 40 mM methylamine. Representative extracted ion chromatograms for m/z 161.0920 are shown. c, HepG2 cells deficient for GS (KO1 and KO2) or non-targeting control (NTC) were grown in glutamine-free medium for 24 h and incubated with methylamine (CH3NH2, 0.8 mM) or MSO (1 mM) for an additional 24 h. Data were analyzed by two-tailed Student’s t-test. Bars represent mean ± s.e.m., and each data point represents an independent experiment (n = 3). The inset shows immunoblotting analysis of GS. Tubulin is shown as a loading control (n = 1). d, T16 cells were incubated with methylamine (0.4 mM) or MSO (1 mM) as indicated for 48 h. Data were analyzed by two-tailed Student’s t-test. Bars represent mean ± s.e.m., and each data point represents an independent experiment (n = 3). e, The active site of human GS with highlighted arginine residues, phospho-MSO (P-MSO) and ADP (PDB 2QC8 visualized with UCSF Chimera v1.15). f,g, GS wt and mutant proteins were purified as described in the Methods and in Extended Data Fig. 3c–f. Km values for ammonia (f) and methylamine (g) were calculated using the Michaelis–Menten equation. Samples were collected from the reaction mixtures 15 min after methylamine or ammonia addition. Data points represent mean ± s.e.m. of n = 3 independent experiments. h,i, HEK293 cells deleted for GS (GS KO) were transfected with an empty vector (EV) control or vectors encoding GS wt or R324A and R324C mutant variants. Twenty-four hours after transfection, cells were incubated with methylamine (0.4 mM) for an additional 24 h, and glutamine (h), GS (h immunoblot inset; β-actin is shown as a loading control; n = 1) and N5-methylglutamine (i) levels were measured. Data were analyzed by two-tailed Student’s t-test. Bars represent mean ± s.e.m., and each data point represents an independent experiment (n = 3). Source data
Fig. 5
Fig. 5. The microbiome and β-catenin activation increase N5-methylglutamine synthesis.
a, 13C-N5-methylglutamine levels in the blood of wt/wt (n = 3) and Δ/Δ (n = 3) mice immediately before and 15, 30, 60, 120 and 240 min after injection of 13C-methylamine (2 mmol per kg body weight). P values refer to the comparison of wt/wt to Δ/Δ levels at 60 and 120 min. b, 13C-N5-methylglutamine levels in the livers of wt/wt (n = 6) and Δ/Δ (n = 6) mice 2 h after 13C-methylamine administration. ce, Methylamine (c) and N5-methylglutamine (d) levels in the sera and N5-methylglutamine levels in the liver tissue (e) of female germ-free mice administered with vehicle control (n = 5) or with SPF microbiota (n = 6). f, Representative images of IHC staining for GS in livers of Cnntb1fl(ex3)/wt male mice 4 d after administration of AAV8-Null-Cre or AAV8-TBG-Cre; scale bar, 1 mm. g, Levels of N5-methylglutamine in the livers of AAV8-Null-Cre (n = 3) or AAV8-TBG-Cre (n = 3) mice described in f. h,i, Glutamine (h) and N5-methylglutamine (i) levels in the sera of the mice (n = 3) described in f. Data in ae and gi were analyzed by two-tailed Student’s t-test. Bars represent mean ± s.e.m. Source data
Fig. 6
Fig. 6. N5-methylglutamine levels correlate with GS+ liver tumor progression.
a, MRI images of Cnntb1fl(ex3)/wtRosa26DM.lsl-MYC/DM.lsl-MYC mice scanned 121–156 d after administration of AAV8-TBG-Cre (mice 2, 3 and 4, females). A non-induced mouse (1, female) is shown as a control. Three-dimensional reconstructions of the livers are highlighted in red. b, Correlation between the normalized levels of N5-methylglutamine in the urine of eight mice (1–7, females; 8, male) described in a and their normalized liver volumes. Urine samples were collected 24–48 h before the MRI. Data were analyzed by two-tailed Pearson correlation analysis (n = 8). c, Normalized urine levels of N5-methylglutamine and glutamine and normalized liver volumes measured in three male mice with the genotype described in a. Day 0 corresponds to the day of AAV8-TBG-Cre administration. Individual data points are shown for three mice. d, Representative images of IHC staining for GS in liver sections from Ctnnb1lox(ex3)/wtRosa26DM.lsl-MYC/DM.lsl-MYC male mice with wt/wt or Δ/Δ alleles and Rosa26DM.lsl-MYC/DM.lsl-MYCTrp53tm1brn/tm1brn male mice. Mice were sampled at clinical endpoints between 55 and 164 d after AAV8-TBG-CRE administration; scale bar, 1 mm. The insets show magnifications of tumor regions delineated by dotted lines; scale bar, 250 µm. Arrows indicate normal GS+ hepatocytes surrounding central veins. e, Normalized urine levels of N5-methylglutamine from the mice described in d (n = 4, Ctnnb1 MYC; n = 3, Trp53 MYC) or in age-matched control male mice administered AAV8-Null-Cre (n = 4). Data were analyzed by two-tailed Student’s t-test. Bars represent mean ± s.e.m. Source data
Extended Data Fig. 1
Extended Data Fig. 1. Metabolic effects of hepatic GS deletion.
a, Immunoblot for GS of brain (top) and muscle (bottom) samples from wt/wt (n = 3), wt/Δ (n = 3), Δ/Δ (n = 3) mice shown in Fig. 1d. β-actin and vinculin are shown as loading controls. b, Body weights and (c) liver weights of male wt/wt (n = 5), wt/Δ (n = 5), Δ/Δ (n = 6) and female wt/wt (n = 4), wt/Δ (n = 4), Δ/Δ (n = 6) mice. Two-tailed Student’s t-test. Bars are mean ± s.e.m. d, Glutamine and glutamate relative abundance is shown in sections of frozen liver samples from wt/wt (n = 1 male, n = 1 female) and Δ/Δ mice (n = 1 male, n = 1 female) analyzed with mass spectrometry metabolic imaging. Data were normalized with root mean square method. Scale bar = 1 mm. e, Glutamine and glutamate quantification of the metabolic images presented in (d) (n = 2 wt/wt, n = 2 Δ/Δ). Each box and whiskers represents data from one image obtained from one liver. Box with bounds at 25th-75th percentiles, line at median, and whiskers at 5th-95th percentiles, each data point represents the relative intensity of one pixel. Two-tailed Student’s t-test. f, Relative levels of 13C isotopologues for the indicated metabolites in the liver extracts of a no tracer control mouse (n = 1) and in wt/wt (n = 4) and Δ/Δ (n = 5) mice administered with U-13C6-glucose. Bars are mean ± s.e.m. Source data
Extended Data Fig. 2
Extended Data Fig. 2. Proposed mechanisms of reaction and fragmentation.
a, Schematic of the proposed reaction where α-aminoadipic acid and ammonia are used by GS to produce homoglutamine. b, Proposed mechanism for glutamine fragmentation. c, Proposed mechanism for N5-methylglutamine fragmentation.
Extended Data Fig. 3
Extended Data Fig. 3. Stoichiometry of GS activities and purification of GS wild type and R324C mutant proteins.
a, Recombinant human GS protein was incubated in 50 μl of the reaction mixture described in the methods section with 40 mM methylamine. The differences in nanomoles of ATP and N5-methylglutamine between samples harvested before and 60 minutes after methylamine addition are shown. Each data point represents an independent experiment (n = 3). Bars are mean ± s.e.m.. b, Recombinant human GS protein was incubated in 500 μl of the reaction mixture described in the Methods section. The reaction was started by adding a solution containing 20 mM 13C methylamine and 20 mM 15N ammonia. 13C N5-methylglutamine and 15N glutamine were quantified in samples harvested 60 minutes after the reaction start. Each data point represents an independent experiment (n = 3). Bars are mean ± s.e.m.. c, Schematic of the purification steps for GS WT and GS R324C described in the Methods section. d, Coomassie stained SDSPAGE gel showing the purification steps and size exclusion fractions for GS WT protein. SDS-PAGE gels for the purification of GS WT and GS R324C showed comparable results (n = 1). e, Superdex 200 size exclusion profile for the GS WT protein. f, Overlay of size exclusion profiles for GS WT and GS R324C loaded separately onto a Superdex 200 column. The elution profiles were overlaid demonstrating an identical oligomeric state for GS WT and mutant. Source data
Extended Data Fig. 4
Extended Data Fig. 4. N5-methylglutamine in vivo metabolic origin, its effects on liver metabolism, and its levels in murine cancer models.
a, b, Glutamine and N5-methylglutamine isotopologue levels in the blood of wt/wt mice (n = 4, 2 females and 2 males) before (-) and after (+) administration of 13C5 glutamine. P values refer to the sum of all detected isotopologues. Two-tailed ratio paired Student’s t-test. Bars are mean ± s.e.m.. c, Levels of glutamine in the blood of wt/wt (n = 3) and Δ/Δ (n = 3) mice injected with 13C methylamine. P value refers to the comparison of wt/wt to Δ/Δ blood at 120 minutes. Two-tailed Student’s t-test. Circles are mean ± s.e.m.. d, N5-methylglutamine levels in the liver tissue of wt/wt (n = 4, 3 females and 1 male) and Δ/Δ (n = 5, 3 females and 2 males) mice administered 0.1% w/v methylamine, supplemented to drinking water for 5 months, or in wt/wt (n = 4, 2 females and 2 males) and Δ/Δ (n = 4, 3 females and 1 male) control mice. Two-tailed Student’s t-test. Bars are mean ± s.e.m.. e, Metabolic features identified by untargeted metabolomic analysis of liver tissue of the mice described in (d) and ranked according to their correlation values with N5-methylglutamine levels shown in (d) (n = 4 wt/wt and n = 5 Δ/Δ administered methylamine, n = 4 wt/wt and n = 4 Δ/Δ with water control). Cut-off P values refers to a two tailed Pearson correlation analysis (n = 17). f, Two tailed Pearson correlation analysis (n = 17) between the α-ketoglutarate and N5-methylglutamine in the liver tissues of mice described in (d). g, α-ketoglutarate levels in liver tissue of the mice described in (d). n = 4 wt/wt and n = 5 Δ/Δ administered methylamine, n = 4 wt/wt and n = 4 Δ/Δ with water control. Two-tailed Student’s t-test. Bars are mean ± s.e.m.. h, Methylamine concentrations quantified with a standard addition method in liver tissue (n = 1) assuming that 1 g of tissue = 1 ml. Circles are mean ± s.e.m. of 2 technical replicates. i, Methylamine concentrations in portal and cardiac sera. Wild type C57Bl6/J mice were fasted overnight for 16 hours and refed for 4 hours (post-absorptive state) before being anesthetized. For each mouse samples of blood were collected by venipuncture from the portal vein and subsequently by cardiac puncture (n = 5 mice). Two-tailed ratio paired Student’s t-test. Data are mean ± s.e.m.. j, Images of IHC staining for GS in liver sections from Ctnnb1wt/wt, Rosa26wt/wt or Ctnnb1lox(ex3)/wt, Rosa26DM.lsl-MYC/DM.lsl-MYC female mice, harvested 107 and 151 days after administration of AAV8-TBG-Cre. Scale bar = 1 mm. The images shown are representative of 3 mice per genotype. k, Levels of N5-methylglutamine in the serum sampled at clinical endpoint from tumour-bearing Ctnnb1lox(ex3)/wt, Rosa26DM.lsl-MYC/DM.lsl-MYC male mice with GS wt/wt (n = 4) or GS Δ/Δ (n = 4), described in Fig. 6e. Two-tailed Student’s t-test. Bars are mean ± s.e.m.. l, Normalized urine levels of N5-methylglutamine from tumour-free mice described in Fig. 6e (n = 4) and from K-rasLSL.G12D/+, Trp53R172H/+, Pdx-1-Cre (KPC) mice with pancreatic ductal adenocarcinoma (PDAC) sampled at clinical endpoint (n = 3). Two-tailed Student’s t-test. Bars are mean ± s.e.m.. m-o, N5-methylglutamine concentrations quantified with a standard addition method in urine (m) (n = 1, pooled urine from 5 mice), serum (n) (n = 1 pooled sera from 4 mice), and liver tissue (o) (assuming that 1 g of tissue =1 ml, n = 1). Coloured circles indicate the x intercept, and their absolute values correspond to the μM concentrations of metabolites in the samples without standard addition. Circles are mean ± s.e.m. of 2 (m, o) or 3 (n) technical replicates. Source data

Similar articles

Cited by

References

    1. Kumada Y, et al. Evolution of the glutamine synthetase gene, one of the oldest existing and functioning genes. Proc. Natl Acad. Sci. USA. 1993;90:3009–3013. doi: 10.1073/pnas.90.7.3009. - DOI - PMC - PubMed
    1. Elliott WH. Adenosinetriphosphate in glutamine synthesis. Nature. 1948;161:128–129. doi: 10.1038/161128a0. - DOI - PubMed
    1. Eelen G, et al. Role of glutamine synthetase in angiogenesis beyond glutamine synthesis. Nature. 2018;561:63–69. doi: 10.1038/s41586-018-0466-7. - DOI - PubMed
    1. Shang M, et al. Macrophage-derived glutamine boosts satellite cells and muscle regeneration. Nature. 2020;587:626–631. doi: 10.1038/s41586-020-2857-9. - DOI - PMC - PubMed
    1. Bak LK, Schousboe A, Waagepetersen HS. The glutamate/GABA–glutamine cycle: aspects of transport, neurotransmitter homeostasis and ammonia transfer. J. Neurochem. 2006;98:641–653. doi: 10.1111/j.1471-4159.2006.03913.x. - DOI - PubMed

Publication types