. 2022 Nov;25(11):1505-1518.
doi: 10.1038/s41593-022-01179-2. Epub 2022 Oct 24.

Reciprocal cortico-amygdala connections regulate prosocial and selfish choices in mice

Affiliations

Reciprocal cortico-amygdala connections regulate prosocial and selfish choices in mice

Diego Scheggia et al. Nat Neurosci. 2022 Nov.

Abstract

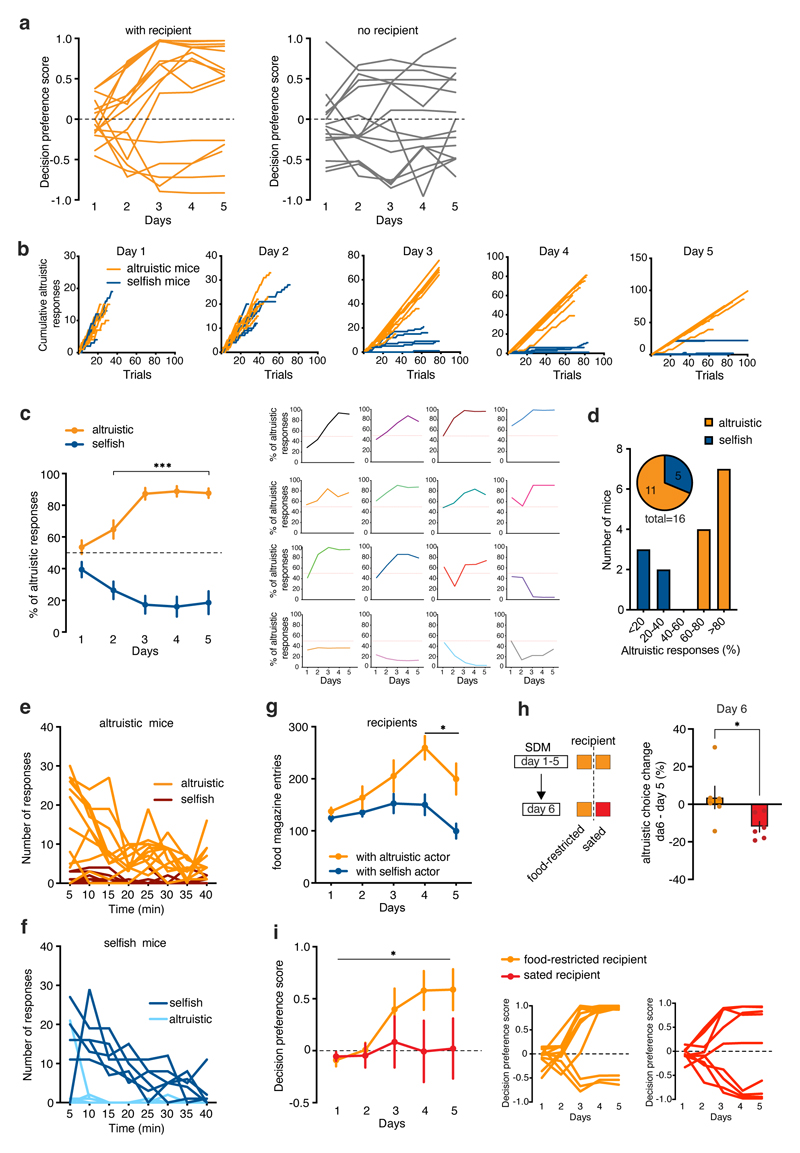
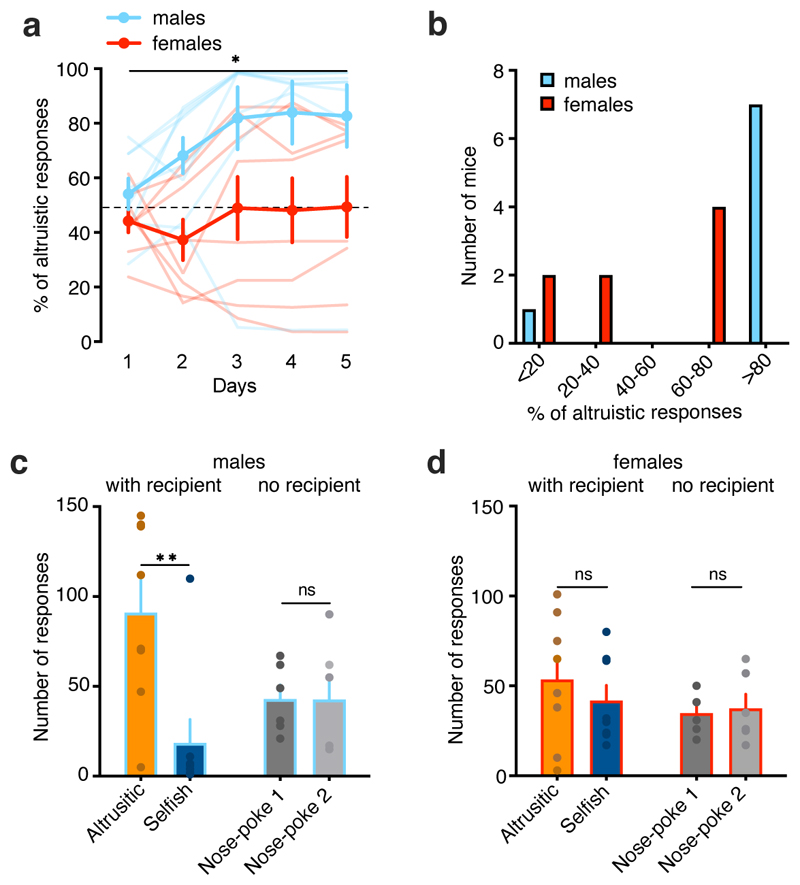
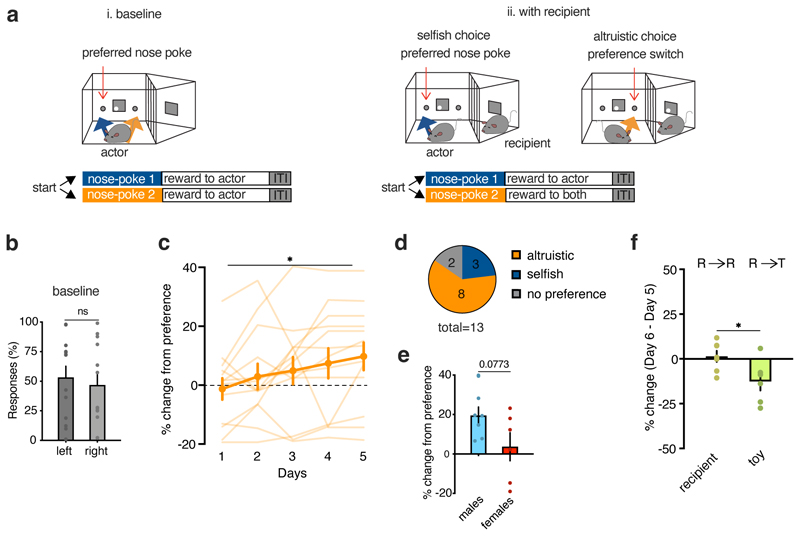
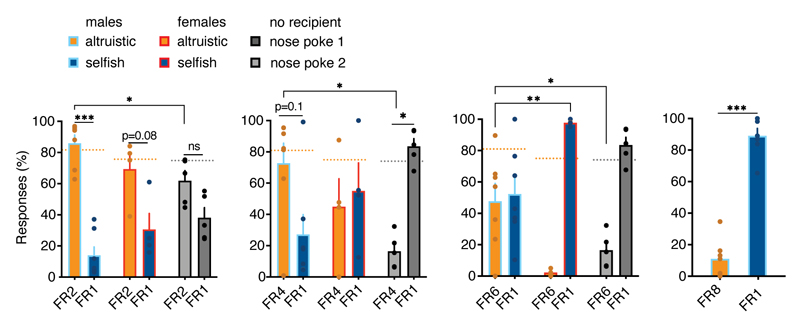
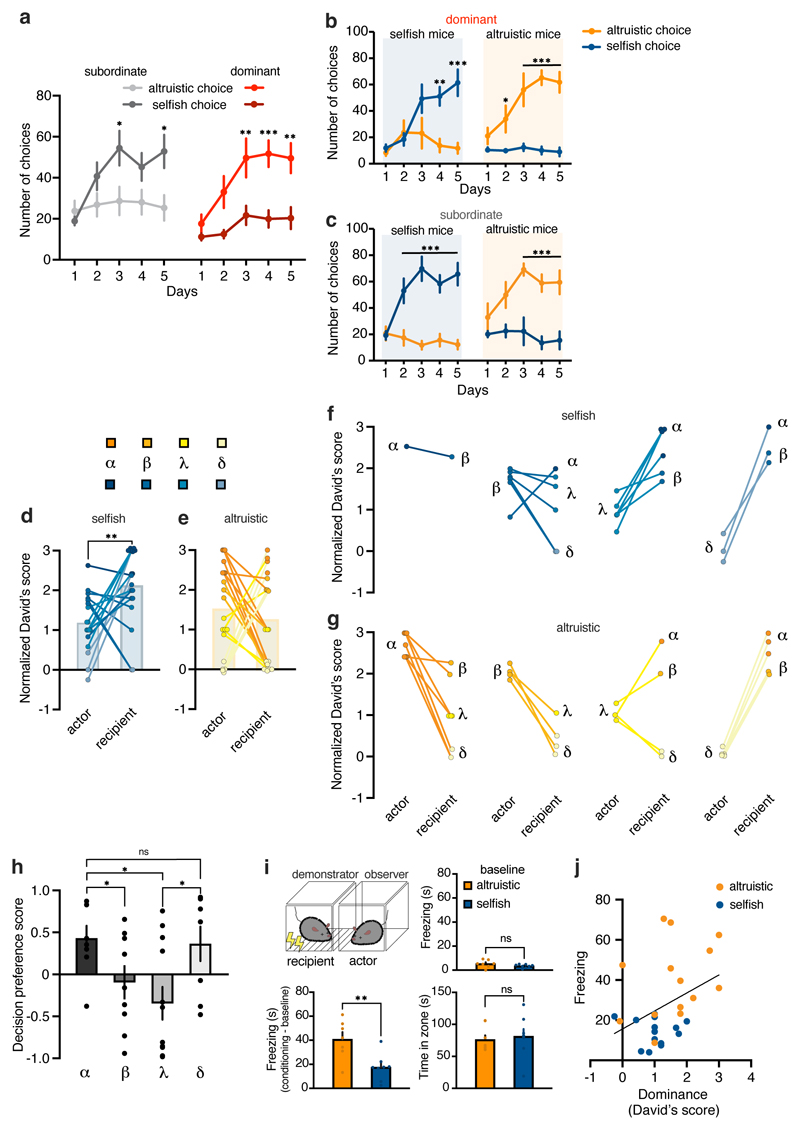
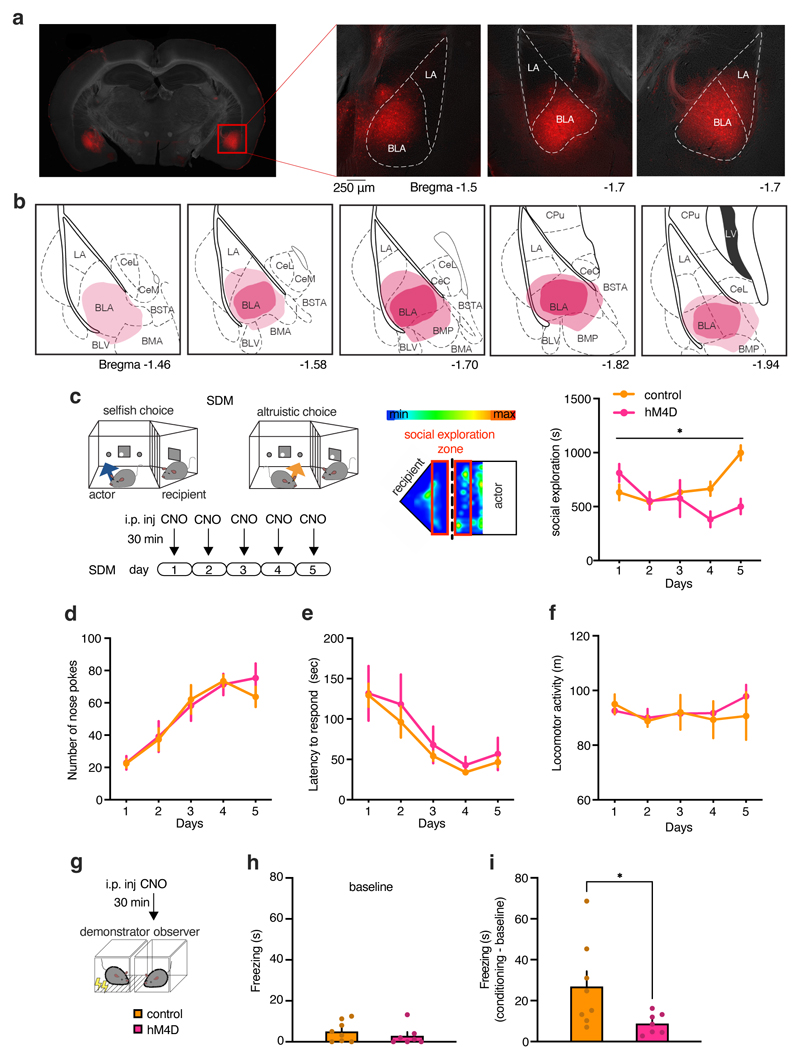
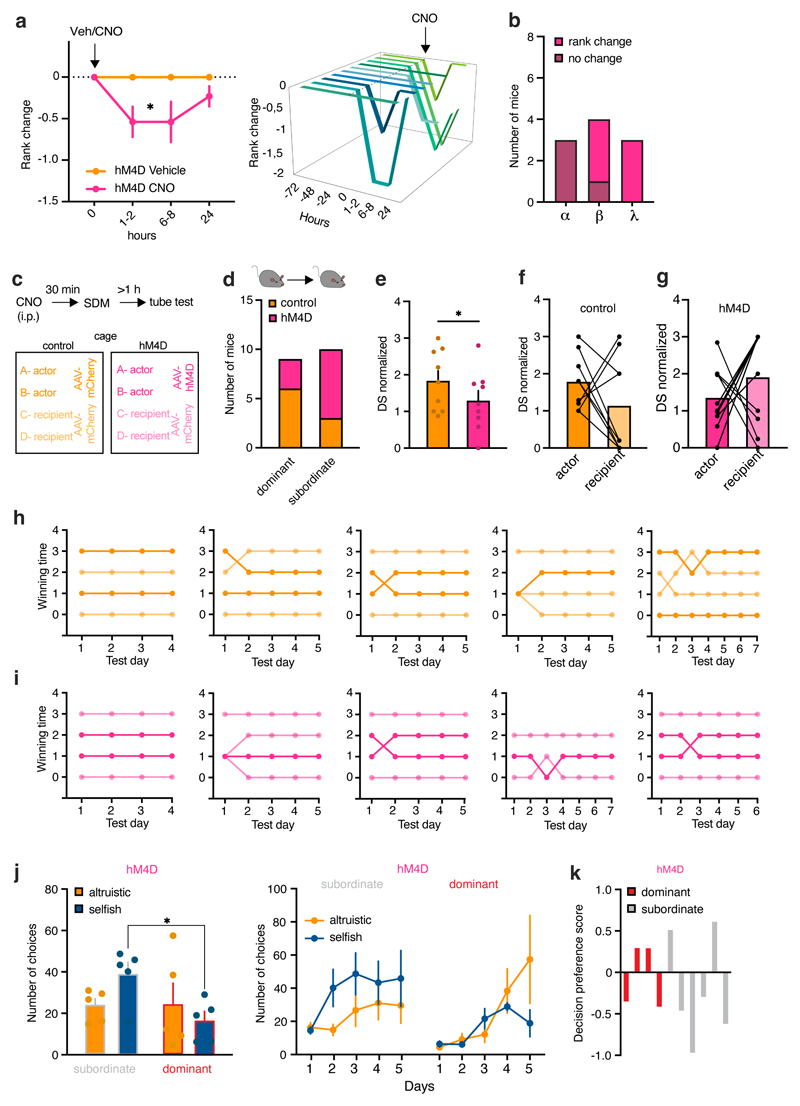
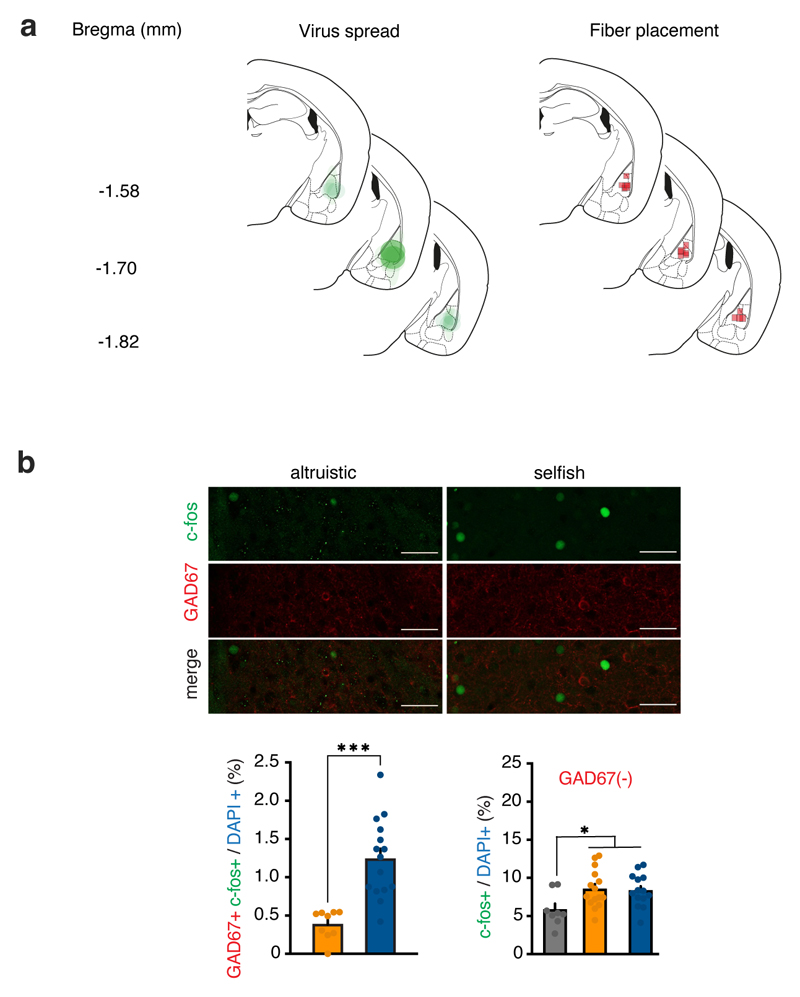
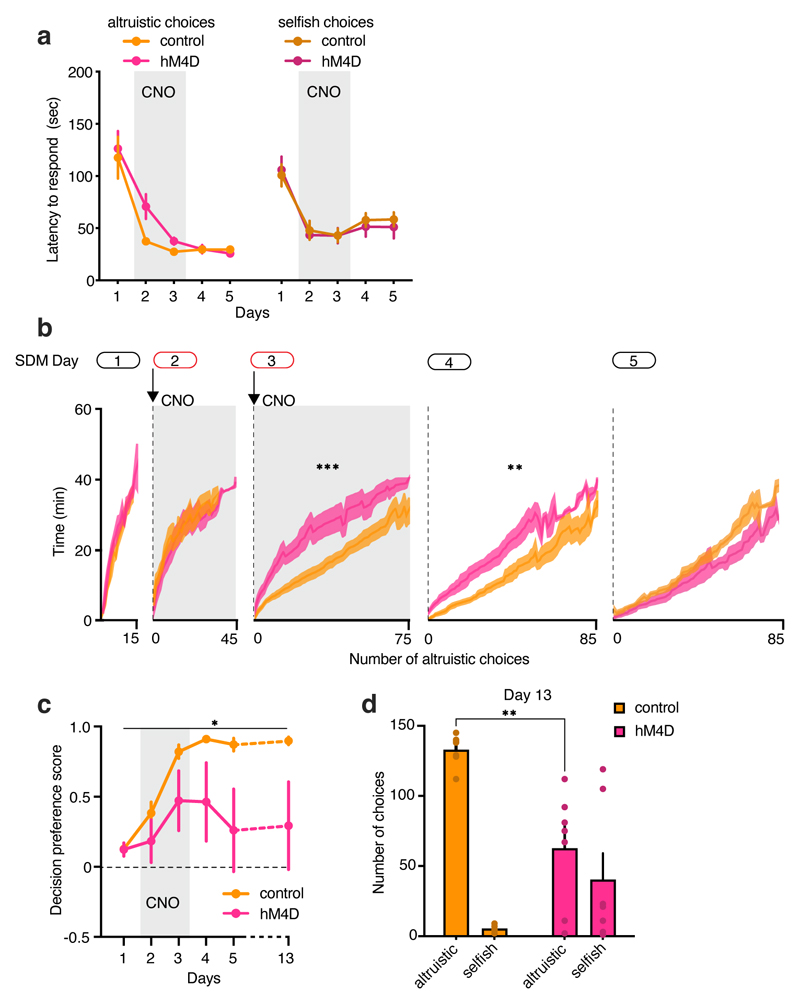
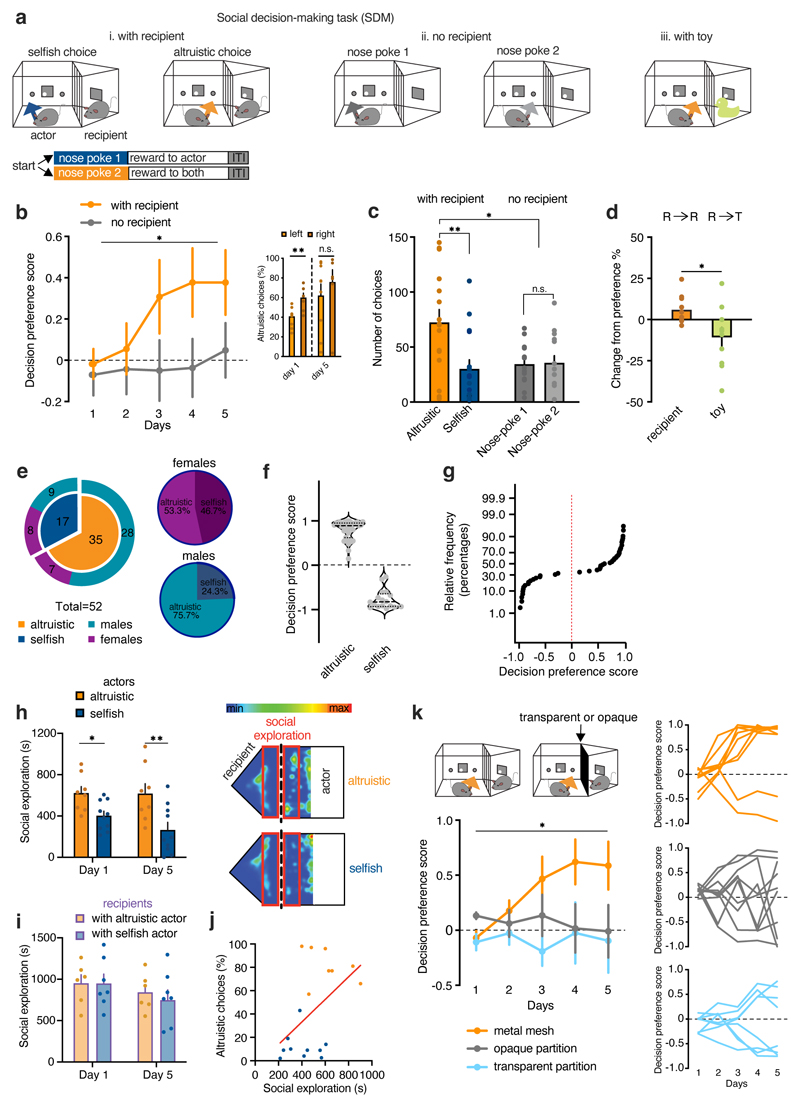
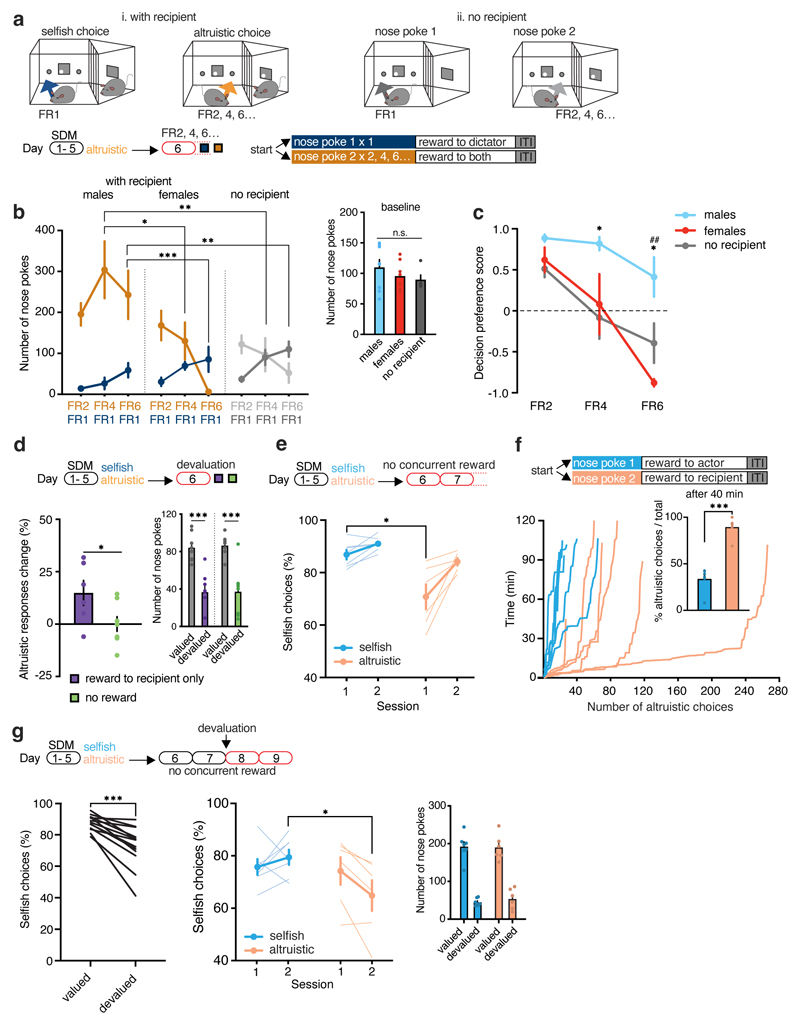
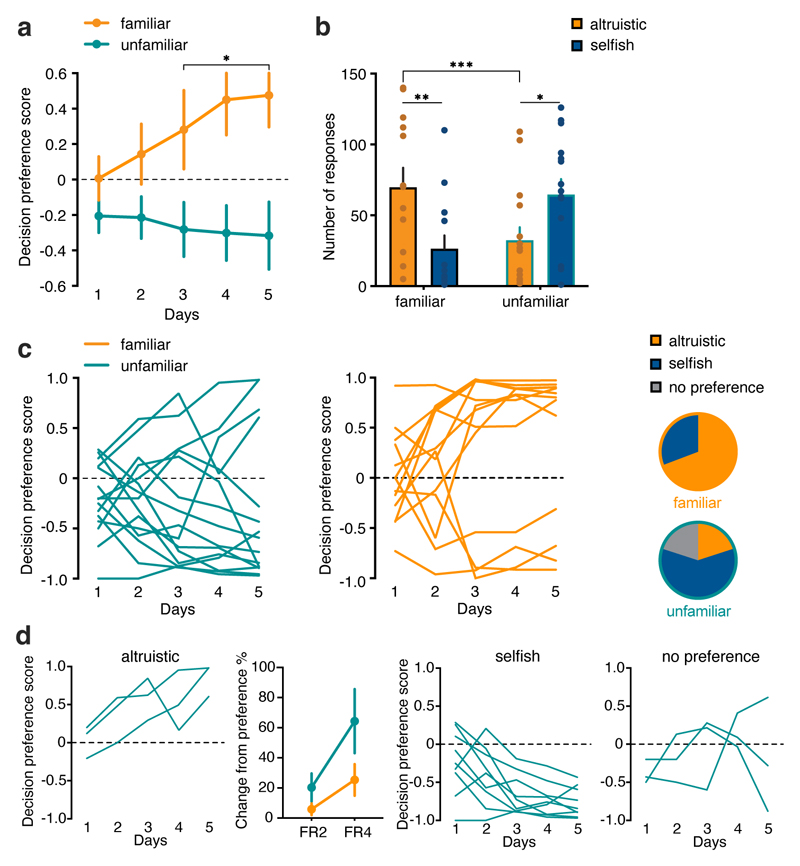
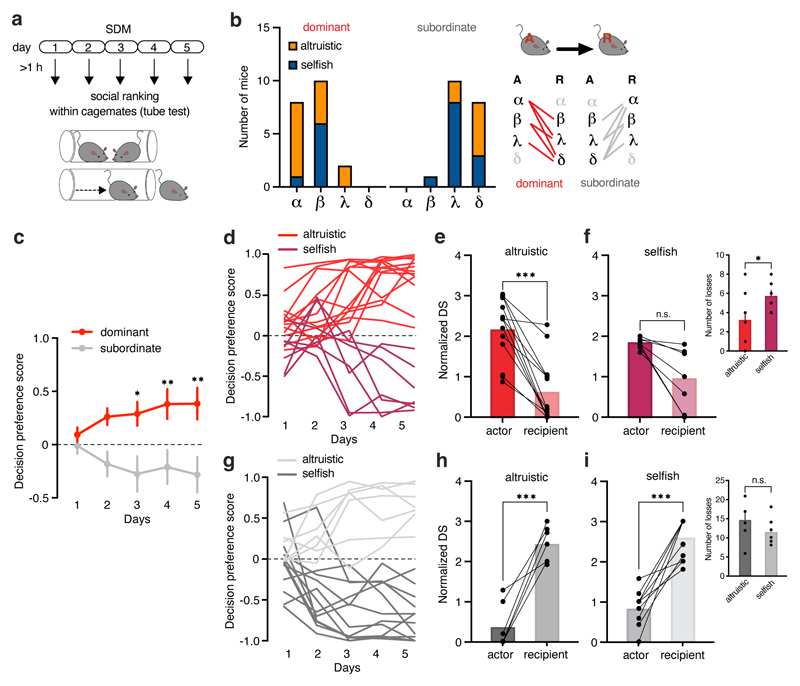
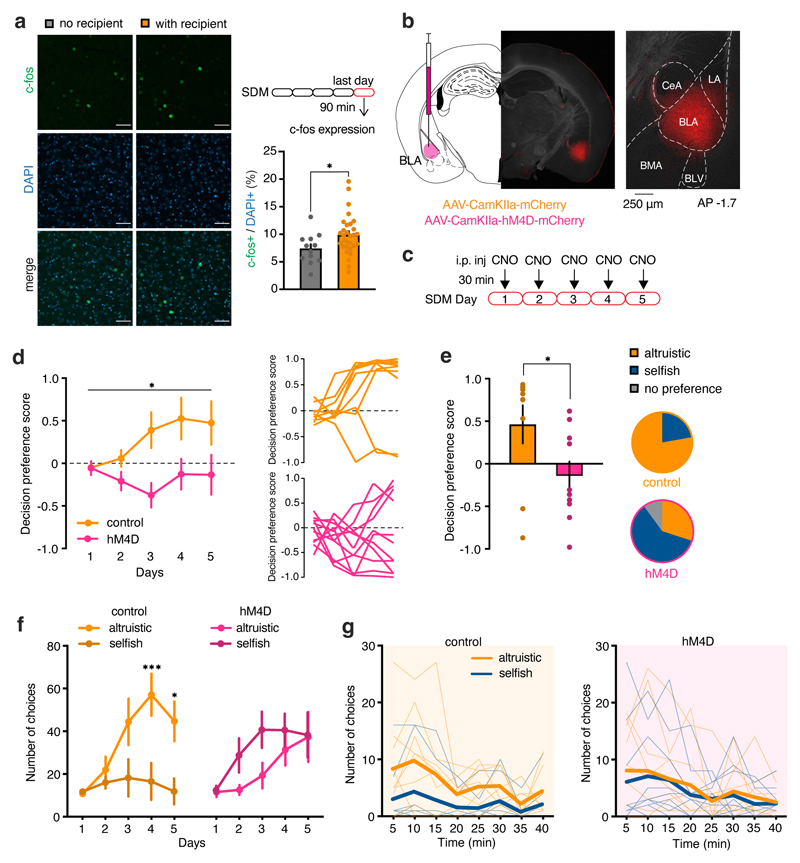
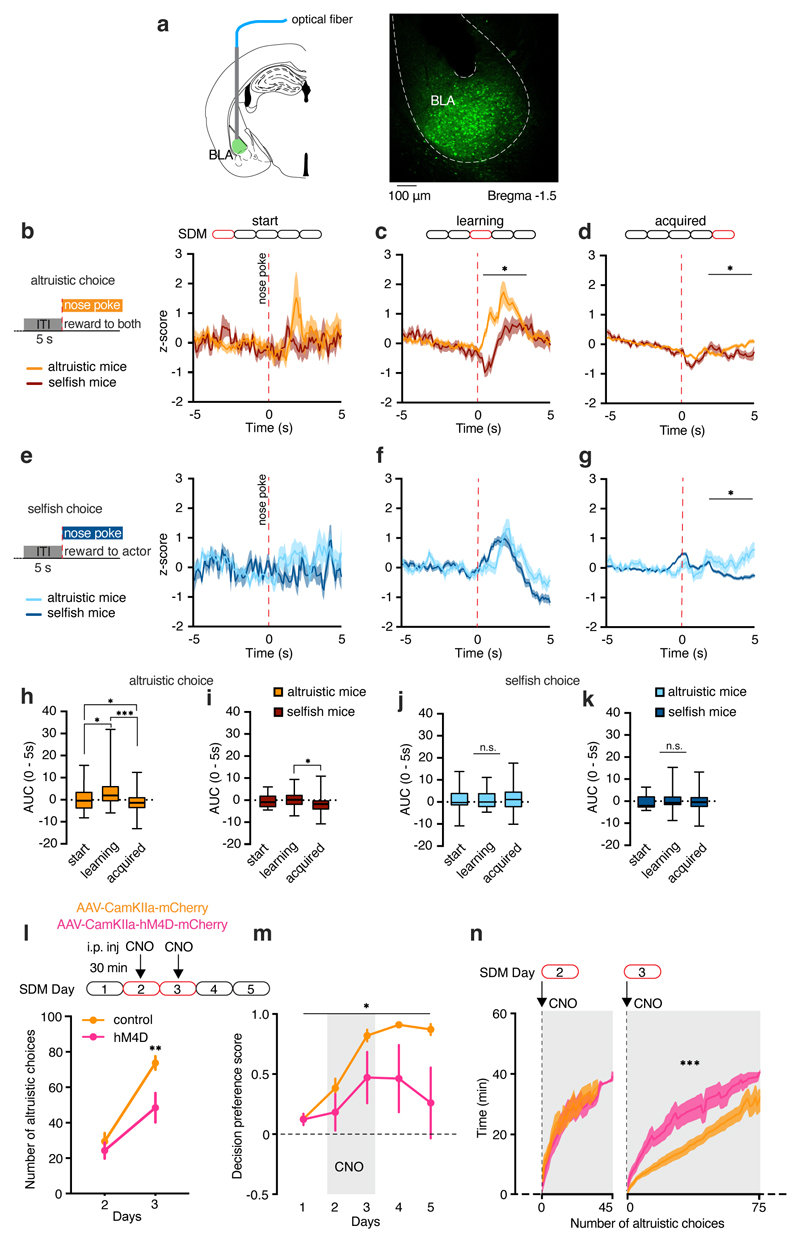
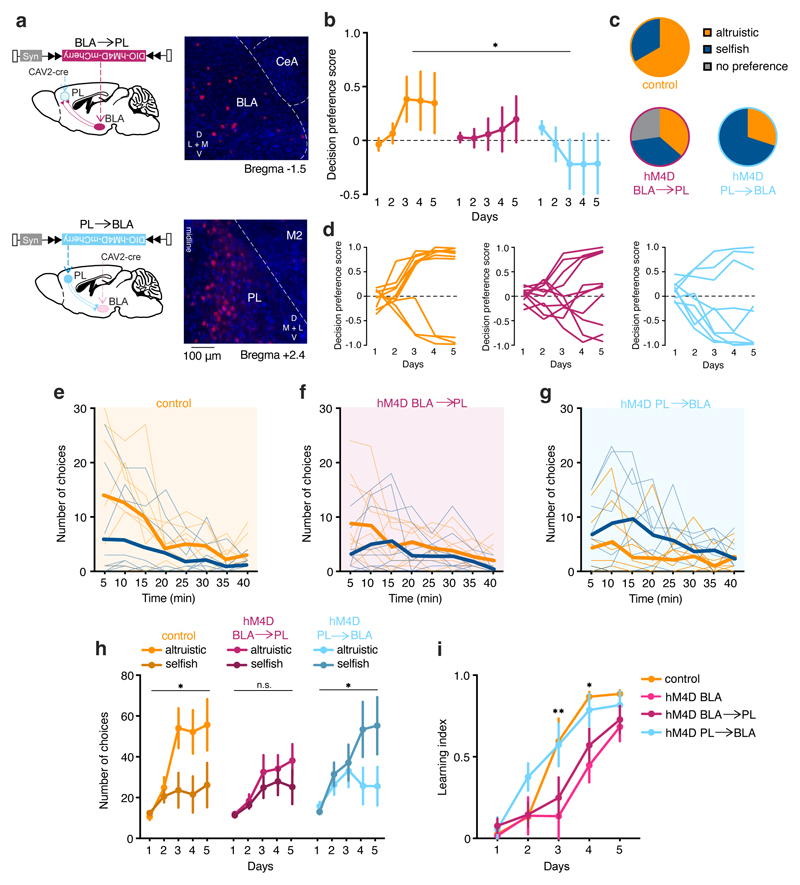
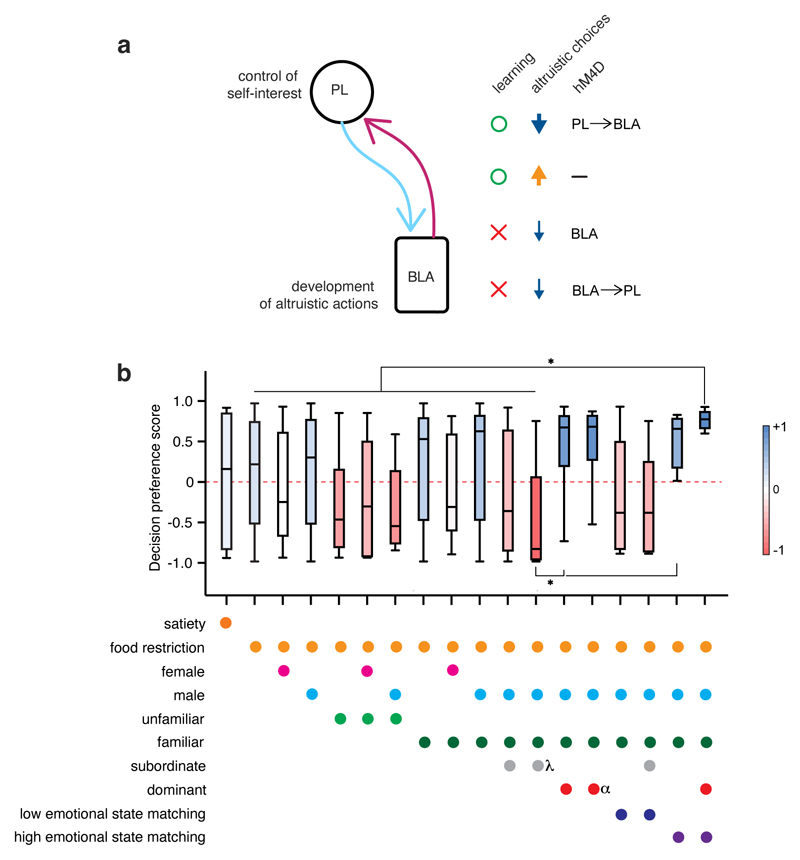
Decisions that favor one's own interest versus the interest of another individual depend on context and the relationships between individuals. The neurobiology underlying selfish choices or choices that benefit others is not understood. We developed a two-choice social decision-making task in which mice can decide whether to share a reward with their conspecifics. Preference for altruistic choices was modulated by familiarity, sex, social contact, hunger, hierarchical status and emotional state matching. Fiber photometry recordings and chemogenetic manipulations demonstrated that basolateral amygdala (BLA) neurons are involved in the establishment of prosocial decisions. In particular, BLA neurons projecting to the prelimbic (PL) region of the prefrontal cortex mediated the development of a preference for altruistic choices, whereas PL projections to the BLA modulated self-interest motives for decision-making. This provides a neurobiological model of altruistic and selfish choices with relevance to pathologies associated with dysfunctions in social decision-making.


Conflict of interest statement

Competing interests

The authors declare that they have no competing interests.

Figures

Extended Data Figure 1
Extended Data Figure 1. Characterization of behaviors in the SDM task.
a, Individual decision preference scores in mice tested with (orange) or without (grey) recipient mouse over the five days of SDM task. b, Cumulative number of altruistic choices for each mouse (altruistic, orange; selfish, blue) during each daily session in the SDM task. c, Altruistic responses (in %) in altruistic (n=11) and selfish (n=5) mice (two-way RM ANOVA, group (altruistic, selfish) x time (days 1-5), F(4, 56)=21.55, p<0.0001) and individual scores of altruistic responses across five days of SDM. d, Number of tested mice grouped by percentage of altruistic responses. e, Number of choices (orange, altruistic; maroon, selfish) of altruistic mice on the last session of training in the SDM task (two-way RM ANOVA, choice (altruistic, selfish) x time (minutes), F(7, 70)=5.67, p<0.0001). f, Number of choices (light blue, altruistic; blue, selfish) of selfish mice on the last session of training in the SDM task (two-way RM ANOVA, choice (altruistic, selfish) x time (minutes), F(7, 35)=2.61, p=0.0276). g, Number of head entries in the food magazine of recipient mice tested with altruistic (orange, n=14) or selfish (blue, n=14) actors (two-way RM ANOVA, group (altruistic, selfish) x time (days 1-5), F(4, 103)=3.04, p=0.0203). h, Following training in the SDM task actor mice were tested in an additional session with sated (red, n=6) or food-restricted (orange, n=6) recipient mice (two-tailed unpaired t-test: t=2.37, d.f.=10, p=0.0387). i, Left, decision preference score in mice tested with food-restricted (orange, n=12) or sated (red, n=9) recipient mice over the five days of SDM task (two-way RM ANOVA, group (sated, food-restricted) x time (days 1-5), F(4, 76)=2.62, p=0.0409). Right, individual curves representing decision preference scores. *p<0.05, ***p<0.001. Values are expressed as mean ± s.e.m.
Extended Data Figure 2
Extended Data Figure 2. Male mice make more altruistic responses than females.
a, Altruistic responses in males (n=8) and females (n=8) across five days of testing in the SDM (two-way RM ANOVA, gender, F(1, 14)=5.90, p=0.0292; time (days 1-5), F(4, 56)=4.59, p=0.0028). b, Number of tested mice grouped by gender and by percentage of altruistic responses. c, Number of nose pokes responses in male mice tested in the conditions with recipient (n=8) and no recipient (n=6) on day five of the SDM (two-way ANOVA, group (with recipient, no recipient) x response (nose-poke 1, nose-poke 2), F(1, 24)=6.2, p=0.0199). d, Number of nose pokes responses in female mice tested in the conditions with recipient (n=8) and no recipient (n=6) (two-way ANOVA, group (with recipient, no recipient), F(1, 12)=4.1, p=0.0630). *p<0.05, **p<0.01, n.s., not significant. Values are expressed as mean ± s.e.m.
Extended Data Figure 3
Extended Data Figure 3. Mice change their responses to share food rewards with their conspecifics.
a, Experimental design of the SDM. Actor mice were trained on a two-choice decision paradigm where nose pokes resulted in food rewards. In the condition i.”with recipient” (orange) one nose poke resulted in food reward to actor (selfish choice) and the other nose poke in food reward both to the actor and to the recipient, in the adjacent compartment (altruistic choice). After an inter-trial interval of 5 seconds (ITI), a new trial started, and actor could make their choice. The location of the two responses were counterbalanced between left and right nose-pokes. In the condition ii. “no recipient” (grey) the structure of the task was identical, but the adjacent compartment was empty. iii. In the condition “with toy”, the recipient was replaced. b, Nose poke responses (in percentage) during baseline training in the right and left nose poke holes were not different at the group level (two-tailed paired t-test: t=0.47, d.f.=24, p=0.6423, n=13 mice). c, Change of preference (in percentage) to altruistic responses during the SDM with recipient compared to the baseline (one-sample t-test, t=2.36, d.f.=64, p=0.0211, n=13 mice). d, Number of tested mice grouped by preference. e, Change of preference (in percentage) to altruistic responses during the last session of SDM in males (n=7) compared to females (n=6) mice (two-tailed paired t-test: t=1.94, d.f.=11, p=0.0773). f, Change of preference when animals were tested one additional day with their recipient (R→R, n=7) or with an inanimate object (toy, R→T, n=6) (two-tailed unpaired t-test, t=2.49, d.f.=11, p=0.0296). *p<0.05. Values are expressed as mean ± s.e.m.
Extended Data Figure 4
Extended Data Figure 4. Mice are willing to take altruistic decisions under costly situations.
Altruistic responses (orange) reinforced on FR2, FR4 and FR6 and selfish responses (blue) reinforced on FR1 expressed as percentage of the total in males (light blue, (n=7) and females (red, n=4) mice and responses on the preferred nose poke (NP1, dark grey) reinforced on FR2, FR4 and FR6 and responses on the non-preferred nose poke (NP2, light grey) reinforced on FR1 in mice tested without recipient (n=6) (FR2: two-way RM ANOVA, group (with recipient males, with recipient females, no recipient) x response (FR1, FR2), F(2, 13)=3.5, p=0.05. FR4: two-way RM ANOVA, group (with recipient males, with recipient females, no recipient) x response (FR1, FR2), F(2, 13)=5.1, p=0.0192; FR6. two-way RM ANOVA, group (with recipient males, with recipient females, no recipient) x response (FR1, FR2), F(2, 13)=6.6, p=0.0103. FR8: two-tailed unpaired t-test, t=8.32, d.f.=6, p=0.0002). *p<0.05, **p<0.01, ***p<0.005 n.s. not significant. Values are expressed as mean ± s.e.m.
Extended Data Figure 5
Extended Data Figure 5. Characterization of the role of social dominance and affective sensitivity in social decision-making.
a, Number of altruistic and selfish choices in subordinate (two-way RM ANOVA, choice (altruistic, selfish) x time (days), F(4, 152)=4.92, p=0.0009, n=19), and dominant actor mice (F(4, 144)=3.26, p=0.0122, n=20). b, Dominant actor mice grouped by altruistic (two-way RM ANOVA, choice (altruistic, selfish) x time (days), F(4, 96)=8.83, p<0.0001, n=13) and selfish preference (two-way RM ANOVA, choice (altruistic, selfish) x time (days), F(4, 48)=10.45, p<0.0001, n=7) on the SDM task. c, Subordinate actor mice grouped by altruistic (two-way RM ANOVA, choice (altruistic, selfish) x time (days), F(4, 48)=3.09, p<0.0001, n=7) and selfish preference (two-way RM ANOVA, choice (altruistic, selfish) x time (days), F(4, 88)=12.52, p<0.0001, n=12) on the SDM task. d-e, Social dominance (normalized David’s Score) quantified based on the number and directionality of interactions in the tube test in actor and recipient mice grouped by selfish (d, two-tailed paired t-test: t=3.17, d.f.=34, p=0.0032; n=18) and altruistic (e, two-tailed paired t-test: t=0.79, d.f.=38, p=0.4324; n=20) actors and respective recipient conspecific. f-g, Normalized David’s Score in actor mice grouped by altruistic (f) or selfish (g) preference and by their social rank in relation to the normalized David’s Score of their respective recipient. h, Decision preference score in actor mice grouped by social rank (α: n=8, β: n=9, γ: n=12, δ: n=8; one-way ANOVA, F(3, 33)=3.90, p=0.0172; two-tailed unpaired t-test, α vs. β: t=2.12, d.f.=15, p=0.050; α vs. γ: t=2.87, d.f.=18, p=0.0100; α vs. δ: t=2.26, d.f.=14, p=0.7982; δ vs. γ: t=2.42, d.f.=18, p=0.0261). i, Top, Schematic representation of the observational fear learning and freezing behavior in actor mice, grouped by altruistic (n=6) or selfish (n=7) preference during baseline (two-tailed unpaired t-test: t=15.31, d.f.=13, p=0.1497). Bottom, freezing behavior (conditioning-baseline) in altruistic and selfish actors (two-tailed unpaired t-test: t=3.30, d.f.=13, p=0.0057) and total time spent in the proximity of the divider between the actor and recipient compartment (two-tailed paired t-test: t=0.39, d.f.=13, p=0.7021). j, Social dominance (normalized David’s score) predicts affective sensitivity (freezing behavior during observational fear learning) (linear regression, n=27 mice, y=8.971x+15.61, F(1, 25)=4.47, p=0.0446). *p<0.05, **p<0.01, ***p<0.001. n.s. not significant. Values are expressed as mean ± s.e.m.
Extended Data Figure 6
Extended Data Figure 6. Behavioral effects of BLA neuronal silencing.
a, Representative images of viral expression in the BLA after injection with AAV-CamKIIa-hM4D-mCherry (data from 3 independent experiments). b, Reconstruction of viral expression. Red areas represent viral expression (higher expression = darker color). c, Left, schematic illustration of the actor-recipient testing chambers with graphical representation of the amount of time mice spent in different parts of the chambers (with blue as the shortest and red as the longest time). Right, social exploration, was measured in the area highlighted in red, in control (n=10) and hM4D (n=7) mice towards their recipients during the SDM task (two-way ANOVA, group (control, hM4D), F(4, 60)=5.0, p=0.0013). d, Number of nose pokes in control (n=9) and hM4D (n=10) mice (two-way ANOVA, group (control, hM4D), F(1, 13)=0.54, p=0.4721), e, Latency to respond in control (n=8) and hM4D (n=9) mice (two-way ANOVA, group (control, hM4D), F(1, 11)=0.02, p=0.877), and f, Locomotor activity (two-way ANOVA, group (control, hM4D), F(1, 11)=0.10, p=0.7566), during the five days of testing in the SDM task in control (n=6) and hM4D (n=7) mice. g, Observers mice received intraperitoneal (i.p.) injection of CNO (3 mg/kg) and after 30 minutes were tested with their respective demonstrators on the observational fear learning paradigm. h-i, Freezing behavior displayed by actor mice, control (n=8) and hM4D (n=7), during baseline (h, two-tailed unpaired t-test: t=0.83, d.f.=13, p=0.4170) and conditioning phases of the test (i, two-tailed unpaired t-test: t=2.22, d.f.=13, p=0.0447). *p<0.05. Values are expressed as mean ± s.e.m.
Extended Data Figure 7
Extended Data Figure 7. BLA neuronal silencing reduces dominance and altruistic choices.
a, Left, average rank change after CNO or vehicle injection in mice that received hM4D in the BLA (two-sided Wilcoxon matched-pairs signed-rank test, p=0.0002; vehicle n=10, CNO n=13). Right, rank changes in each hM4D-expressing mice after i.p. injection of CNO. b, Number of hM4D-expressing mice, grouped by social rank, that showed rank change following CNO injection. c, Left, control and mice that received hM4D for BLA silencing were injected with CNO (3mg/kg) 30 minutes before the SDM task. At least 1 hour after daily session, mice were tested in the tube test for assessment of social ranking within cage mates. Right, cage composition. Each cage hosted 2 actor-recipient pairs. Actor mice received hM4D or control virus in the BLA. All the recipients received the control virus. d, Number of dominant or subordinate actor mice compared to their recipient conspecific (n=19; two-sided Fisher’s exact test p=0.1789). e, Social dominance (normalized David’s Score) quantified based on the number and directionality of interactions in the tube test in actor grouped by control (n=9) and hM4D (n=9) mice (two-tailed paired t-test: t=2.15, d.f.=14, p=0.0493). f-g, Social dominance (normalized David’s Score) quantified based on the number and directionality of interactions in the tube test in (f) control (two-tailed paired t-test: t=1.30, d.f.=16, p=0.2120) and (g) hM4D actor mice (two-tailed paired t-test: t=1.331, d.f.=14, p=0.2045). h-i, Rank positions of (h) control and (i) hM4D mice in each cage over testing days. j, Number of altruistic and selfish choices in subordinate (grey, n=6) and dominant (red, n=4) mice that received hM4D in the BLA and CNO at the end of training and during the five days of SDM task (two-way ANOVA, group (dominant, subordinate), F(3, 80)=3.9, p=0.0107). k, Decision preference scores in the SDM task of hM4D-injected animal, grouped by dominant and subordinate. *p<0.05. Values are expressed as mean ± s.e.m.
Extended Data Figure 8
Extended Data Figure 8. Fiber photometry and c-fos expression in the BLA.
a, Targeting maps of GCaMP6f expression and location of optic fibers in the BLA for fiber photometry recordings. b, Top, representative images of c-fos (green) and GAD67 (red) expression. Scale bar (applicable to all micrographs), 50 μm. Bottom, bar graph quantification of c-fos GAD67 double positive cells in altruistic and selfish mice (n=21 sections from 5 animals; two-tailed unpaired t-test: t=3.33, d.f.=22, p=0.0030) and bar graph quantification of cells that were c-fos positive and GAD67 negative in altruistic and selfish mice and mice without recipient (n=37 sections from 7 animals; one-way ANOVA, F(2, 34)=3.97, p=0.0282). *p<0.05, ***p<0.001. Values are expressed as mean ± s.e.m.
Extended Data Figure 9
Extended Data Figure 9. BLA is required to develop altruistic preference.
a, Latency to respond (in sec) grouped by altruistic and selfish choices in control (light and dark orange, n=7) and hM4D mice (light and dark fuchsia, n=7) during the five days of SDM task (two-way ANOVA, group (control, hM4D, altruistic, selfish), x time (days 1-5), F(12, 96)=2.39, p=0.0093). b, Number of altruistic choices over 40 minutes of testing during the five days of the SDM in control and hM4D mice (mixed model analysis for each day of testing, day1: (control, hM4D) x time (min), F(16, 132)=0.48, p=0.9915; day 2: group F(42, 267)=0.42, p=0.9994; day 3: F(73, 685)=2.85, p<0.0001; day 4: F(80, 716)=2.13, p<0.0001; day 5: F(77, 696)=0.85, p=0.8057). c, Decision preference score in the five days of SDM and following one additional week of testing (day 13) in control (n=7) and hM4D (n=7) mice (two-way RM ANOVA, group (control, hM4D) x time (days), F(5, 60)=2.875, p=0.0416). d, Number of altruistic and selfish choices on test day 13 of the SDM in control (n=7) and hM4D (n=7) mice (two-way RM ANOVA, group (control, hM4D) x choice (altruistic, selfish), F(1, 12)=9.661, p=0.0091). *p<0.05, **p<0.01, ***p<0.001. Values are expressed as mean ± s.e.m.
Figure 1
Figure 1. Mice prefer altruistic over selfish decisions.
a, Experimental design of the SDM. b, Decision preference score in mice tested in the SDM with recipient (orange) or no recipient (grey) (two-way RM ANOVA, group (with recipient, no recipient) x time (days 1-5), F(4, 116)=2.771, p=0.0305; the decision preference scores were found to fit a normal distribution across 5 days of testing, D’Agostino and Pearson normality test, ‘with recipient’, min K2=3.122, p=0.225, n=16; ‘no recipient’ min K2=0.944, p=0.623, n=15). Inset, altruistic responses on left (n=9) and right (n=7) nose pokes on day 1 (two-tailed unpaired t-test, t=3.37, d.f.=14, p=0.0046) and day 5 (t=0.79, d.f.=14, p=0.4419). c, Number of nose poke with recipient (n=16) and no recipient (n=15; two-way RM ANOVA, group (with recipient, no recipient) x response (nose poke 1, nose poke 2), F(1, 58)=6.877, p=0.0111). d, Change of preference in an additional session with recipient (R→R, n=10) or with a toy (R→T, n=10) (two-tailed unpaired t-test, t=2.24, d.f.=18, p=0.0374). e, Left, total number of mice grouped by preference and sex. Right, altruistic and selfish preferences in males and females. f, Data distribution of decision preference score in altruistic and selfish mice. g, Cumulative frequency distribution of decision preference scores (n=52). h, Left, social exploration of altruistic (orange, n=8) and selfish (blue, n=10) actors towards their recipients during SDM day 1 and 5 (two-way ANOVA, group (altruistic, selfish), F(1, 32)=16.29, p=0.0003). Right, Schematic of the testing chambers. i, Social exploration of recipients towards altruistic (orange, n=6) or selfish (blue, n=7) actors during SDM day 1 and 5 (two-way ANOVA, group (altruistic, selfish), F(1, 11)=0.16, p=0.6902;). j, Correlation between social exploration on day 1 and preference for altruistic choices on day 5 (linear regression, r=0.4890, p=0.039, n=18 pairs). k, Left, decision preference scores in mice tested with a metal mesh (orange, n=10), a transparent (light blue, n=8) or an opaque partition (grey, n=8) (two-way RM ANOVA, group (metal mesh, transparent partition, opaque partition) x time (days 1-5), F(8, 100)=2.037, p=0.0494). Right, individual curves representing decision preference score. *p<0.05, **p<0.01. n.s. not significant. Values are expressed as mean ± s.e.m.
Figure 2
Figure 2. Mice are willing to take altruistic decisions under costly situations.
a, Experimental design of the SDM with different fixed ratio (FR) schedule. b, Left, Number of nose poke on FR1 versus FR2, FR4 and FR6 in males (n=7) and females (n=4) actors and actors tested without recipient (n=5) (between groups: two-way RM ANOVA, group (with recipient males, with recipient females, no recipient) x response (FR2, FR4, FR6), F(10, 52)=4.25, p=0.0002; within groups: two-way RM ANOVA, group (with recipient males, with recipient females, no recipient) x response (FR2, FR4, FR6), F(4, 26)=4.48, p=0.0069). Right, number of nose pokes on SDM day 5 (one-way ANOVA, F(2, 13)=0.67, p=0.5270). c, Decision preference scores with FR2, FR4 and FR6, compared to FR1, in mice tested with recipient (male, n=7 and female, n=4) and without recipient (n=5) (two-way ANOVA, group (with recipient males, with recipient females, no recipient) x response (FR2, FR4, FR6), F(4, 26)=3.55, p=0.0193). males: *p=0.0265 (FR4) and p=0.0678 (FR6) vs. no recipient, ##p=0.0010 vs females. d, Actors’ change in altruistic choices during devaluation test in the condition rewards to recipients only (n=6) and no reward (n=8, two-tailed paired t-test: t=2.28, d.f.=12, p=0.0410), and number of nose pokes during valued and devalued sessions (two-way RM ANOVA, session type (valued, devalued), F(1, 14)=43.07, p<0.0001). (e-f), Following SDM training altruistic choices did not result in concurrent reward for the actor. Percentage of selfish choices (e, two-way RM ANOVA, group (selfish, altruistic) x time (session 1-2), F(1, 11)=4.90, p=0.0488) and number of altruistic choices (f) over 120 minutes of SDM in mice grouped by selfish (n=7) or altruistic (n=6) preference (inset, percentage of altruistic choices in the first 40 minutes / total number of altruistic choices; two-tailed unpaired t-test, t=8.17, d.f.=10, p=0.0001). g, Selfish choices in the SDM (n=13), without concurrent reward (as in e-f), following satiety-induced reward devaluation compared to valued session (two-tailed paired t-test, t=5.41, d.f.=12, p=0.0002) and differences between altruistic (n=6) and selfish mice (n=7) (two-way RM ANOVA, group (selfish, altruistic) x time (session 1-2), F(1, 11)=6.37, p=0.0282). *p<0.05, **p<0.01, ***p<0.001. n.s. not significant. Values are expressed as mean ± s.e.m.
Figure 3
Figure 3. Mice display more selfish choices with unfamiliar recipients.
a, Decision preference score in the five days of SDM in mice tested with familiar (orange, n=13, males/females 7/6) or unfamiliar (green, n=15, males/females 10/5) recipients (two-way RM ANOVA, group (familiar recipient, unfamiliar recipient) x time (days 1-5), F(4, 104)=2.707, p=0.0342). b, Number of nose poke responses in the condition with familiar (black border, n=13) and unfamiliar recipient (green border, n=15; two-way RM ANOVA, group (familiar, unfamiliar) x response (altruistic, selfish), F(1, 52)=12.03, p=0.0011). c, Individual decision preference score in the SDM in mice tested with familiar or unfamiliar recipients and number of mice tested with an unfamiliar recipient (chi-square test, χ2=5.99, p=0.0143). Mice were assigned to altruistic (orange), selfish (blue) or no preference (grey) using one sample t-test to chance (50%, red line). d, Individual decision preference score in mice tested with unfamiliar recipients (n=15) grouped by preference and change from preference (expressed in %, (n=12) in the SDM with altruistic choices reinforced on FR2 and FR4. *p<0.05, **p<0.01, ***p<0.001. n.s. not significant. Values are expressed as mean ± s.e.m.
Figure 4
Figure 4. Social dominance hierarchy modulates preference for altruistic choices.
a, After SDM daily session mice were tested on the tube test (at least 1h after SDM), to measure the hierarchical relationship of animals within the same cage. Actor and recipient mice were tested pairwise and using a round robin design. b, Number of altruistic or selfish actor mice (A) that were dominant (red) or subordinate (grey) compared to the recipient (R) in the tube test (n=39). c, Decision preference score of actor mice that were dominant or subordinate in the tube test compared to their recipient (two-way ANOVA, F(4, 148)=3.46, p=0.097; dominant n=20, subordinate n=19). d, Individual decision preference score in the SDM of dominant actor mice grouped by altruistic or selfish preference (n=20). e-f, Social dominance (normalized David’s score) quantified based on the number and directionality of interactions in the tube test in actor mice that were dominant compared to their recipient, grouped by (e) altruistic (two-tailed paired t-test, t=5.01, d.f.=23,97, p<0.0001; n=13 pairs) and (f) selfish preference (two-tailed paired t-test t=2.27, d.f.=6,87, p=0.0576; n=7 pairs). Inset, number of losses by dominant altruistic and selfish actor mice in the tube test (two-tailed paired t-test, t=2.45, d.f.=18, p=0.0244). g, Individual decision preference score in the SDM of dominant actor mice grouped by altruistic or selfish preference (n=19). h-i, Normalized David’s score in actor mice that were subordinate compared to their recipient, grouped by (h) altruistic (two-tailed paired t-test, t=7.66, d.f.=11,39, p<0.0001; n=7 pairs) and (i) selfish preference (two-tailed paired t-test, t=8.6, d.f.=21,67, p<0.0001; n=12 pairs). Inset, number of losses by subordinate altruistic and selfish actor mice in the tube test (two-tailed paired t-test, t=1.65, d.f.=17, p=0.1154). *p<0.05, **p<0.01, ***p<0.001. n.s. not significant. Values are expressed as mean ± s.e.m.
Figure 5
Figure 5. BLA neuronal silencing abolishes the preference for altruistic choices.
a, Representative images and bar graph quantification of c-fos expression in mice following the last day of SDM task and number of c-fos-positive cells in mice tested with or without a recipient (n=42 sections from 7 animals, 3 independent experiments; two-tailed unpaired t-test: t=2.13, d.f.=40, p=0.0394). Scale bar (applicable to all micrographs), 50 μm. b, Male mice were bilaterally injected in the BLA with AAV-CamKIIa-mCherry (control, orange) or AAV-CamKIIa-hM4D-mCherry (hM4D, fuchsia). Representative image of a coronal section of BLA. c, 30 minutes before daily SDM session control and BLA hM4D mice received i.p. injection of CNO. As control, we also tested hM4D animals that received vehicle. Since we did not observe differences, we pooled the control animals together (two-tailed unpaired t-test: t=0.927, d.f.=8, p=0.3810). d, Left, decision preference score in the five days of SDM in control (n=9) and hM4D (n=10) mice (two-way RM ANOVA, group (control, hM4D) x time (days 1-5), F(12, 140)=1.981, p=0.0301; one sample t-test to chance (0.0), control: t=3.146, df=44, p=0.0030; hM4D: t=1.730, df=49, p=0.0899). Right, individual decision preference score in the SDM of control and hM4D. e, Average decision preference score across five day of SDM (two-tailed paired t-test: t=2.175, d.f.=17, p=0.0440) and number of control (n=9) and hM4D (n=10) mice displaying preference for altruistic or selfish choices. f, Number of altruistic and selfish choices in control (two-way ANOVA RM, choice (altruistic, selfish) x time (days 1-5), F(4, 64)=5.0, p=0.0013, n=9) and hM4D mice (choice (altruistic, selfish) x time (days 1-5), F(4, 80)=1.5, p=0.2024, n=10) over five days of SDM task. g, Representation of altruistic and selfish choices at the end of the training in the SDM task (day 5) in control (left) and hM4D (right) mice. *p<0.05, ***p<0.001. Values are expressed as mean ± s.e.m.
Figure 6
Figure 6. The BLA is required for learning of altruistic choices.
a, Virus encoding GCaMP6f (AAV-CaMKIIa-GCaMP6f) in the BLA for fiber photometry. Scale bar, 100 μm. b-d, GCaMP6f fluorescent changes in the BLA of altruistic and selfish actor mice in response to altruistic nose poke during (b) the first day of testing (‘start’, two-way RM ANOVA, group (altruistic, selfish) x time (minutes), F(1, 101)=0.86, p=0.8248; n=42 trials from 6 mice), (c) the ‘learning’ phase (two-way RM ANOVA, group x time, F(101, 14948)=3.01, p<0.00001; group, F(1, 148)=5.45, p=0.0208; n=151 trials) and (d) the last day of testing in the SDM (‘acquired’, two-way RM ANOVA, group x time, F(101, 68882)=2.46, p<0.00001; n=684 trials). e-g, GcaMP6f fluorescent changes in the BLA of altruistic and selfish actor mice in response to selfish nose poke during (e) the first day of testing (two-way RM ANOVA, group (altruistic, selfish) x time (minutes), F(101, 3939)=0.97, p=0.5541; n=42 trials from 6 mice), (f) the learning phase (two-way RM ANOVA, group x time, F(101, 56964)=2.87, p<0.00001; n=144 trials) and (g) the last day of testing in the SDM (two-way RM ANOVA, group x time, F(101, 68882)=4.25, p<0.00001; group, F(1, 564)=5.63, p=0.0179; n=566 trials). h-i, Area under the curve (AUC) after altruistic choices (0 to 5 seconds) at different periods of the SDM task in altruistic (h, one-way ANOVA, F(2, 680)=51.17, p<0.0001, first day n=25, learning phase n=117, last day n=551) and selfish (i, one-way ANOVA, F(2, 179)=5.62, p=0.0043, first day n=16, learning phase n=33, last day n=133). j-k, AUC after selfish choices in altruistic (j, one-way ANOVA, F(2, 137)=0.07, p=0.9434, first day n=28, learning phase n=48, last day n=64) and selfish (k, one-way ANOVA, F(2, 607)=0.55, p=0.5741, first day n=13, learning phase n=95, last day n=502) actor mice. l, Male mice were bilaterally injected in the BLA with AAV-CamKIIa-mCherry (control, n=7) or AAV-CamKIIa-hM4D-mCherry (hM4D, n=7). Both groups received CNO on testing day 2 and 3, 30 minutes before SDM session with familiar recipients. Number of altruistic choices in control and hM4D (two-way ANOVA RM, group (control, hM4D) x time (days 2-3), F(1, 12)=5.44, p=0.0378). m, Decision preference score in the 5 days of SDM in control (n=7) and hM4D (n=7) mice (two-way RM ANOVA, group (control, hM4D) x time (days 1-5), F(4, 48)=2.719, p=0.0404; one sample t-test to chance (0.0), control: t=10.81, df=34, p<0.0001; hM4D: t=3.17, df=34, p=0.0032). n, Number of altruistic choices on day 2-3 of the SDM in control and hM4D mice (mixed model analysis, day 2: group (control, hM4D) x time (min), F(42, 267)=0.42, p=0.9994; day 3: F(73, 685)=2.85, p<0.0001). h-k, box plots: center = median, box = quartiles, whiskers = min and max. All other values are expressed as mean ± s.e.m
Figure 7
Figure 7. Chemogenetic silencing of BLA-PFC reciprocal connection have different impact on altruistic choices.
a, Schematic showing viral injection and projection areas and example images of coronal section of BLA and PL. Mice received hM4D cre-dependent receptors in the BLA and CAV2-Cre in the PL or hM4D cre-dependent receptors in the PL and CAV2-Cre in the BLA. With this combination, we achieved DREADD expression exclusively in BLA neurons projecting to the PL (hM4D BLA→PL) and viceversa (hM4D PL→BLA). CeA=Central Amygdala. M2=secondary motor cortex. b, Decision preference score in the five days of SDM in control CNO (orange, n=10) and hM4D BLA→PL (purple, n=11) and hM4D PL→BLA (light blue, n=9) mice (two-way RM ANOVA, group (control CNO, hM4D BLA→PL, hM4D PL→BLA) x time (days 1-5), F(8, 108)=2.03, p=0.0493). c, Number of mice displaying preference for altruistic or selfish choices. Mice were assigned to altruistic (orange) or selfish (blue) or no preference (grey) analyzing decision preference scores using one sample t-test to chance. d, Individual decision preference score in the SDM of control CNO and hM4D BLA CNO. e-g, Representation of altruistic and selfish choices at the end of the training in the SDM task (day 5). h, Number of altruistic and selfish choices in control CNO (two-way ANOVA RM, choice (altruistic, selfish) x time (days 1-5), F(4, 72)=3.6, p=0.0088, n=10) hM4D BLA→PL (choice (altruistic, selfish) x time (days 1-5), F(4, 64)=2.6, p=0.0401, n=11) and hM4D PL→BLA (choice (altruistic, selfish) x time (days 1-5), F(4, 80)=0.69, p=0.5981, n=9) over five days of SDM task. i, Learning index representing the preference development in control CNO (n=10), hM4D BLA (n=10), hM4D BLA→PL (n=11), and hM4D PL→BLA (n=9) mice (two-way ANOVA RM, group x time, F(12, 140)=1.91, p=0.0376). *p<0.05, **p<0.01. n.s. not significant. Values are expressed as mean ± s.e.m.
Figure 8
Figure 8. A brain circuit and factors involved in altruistic choices.
a, Schematic model of the involvement of the BLA-PFC reciprocal connections in social decision making. Green circle = normal, red cross = impaired. b, Influence of multiple factors on the SDM task (n=146 mice). Average decision preference score (stable performance for the last three days) considering the impact of multiple factors (from 1 to 5 factors simultaneously, One-way ANOVA, Welch’s test, F(17, 67.28)=9.03, p<0.0001). *p<0.05. Right bar = mean (with blue as highest preference for altruistic choices, red as highest preference for selfish choices). Box plots: center = median, box = quartiles, whiskers = min and max.

Comment in

  • Altruism and social rewards.
    Shin HS. Shin HS. Nat Neurosci. 2022 Nov;25(11):1405-1406. doi: 10.1038/s41593-022-01190-7. Nat Neurosci. 2022. PMID: 36280800 No abstract available.

References

    1. Frith CD. Social cognition. Philos Trans R Soc B Biol Sci. 2008;363:2033–2039. - PMC - PubMed
    1. Rilling JK, King-Casas B, Sanfey AG. The neurobiology of social decision-making. Curr Opin Neurobiol. 2008;18:159–165. - PubMed
    1. Batson CD. The naked emperor: Seeking a more plausible genetic basis for psychological altruism. Econ Philos. 2010 doi: 10.1017/S0266267110000179. - DOI
    1. Preston SD. The origins of altruism in offspring care. Psychol Bull. 2013 doi: 10.1037/a0031755. - DOI - PubMed
    1. Marsh AA. Neural, cognitive, and evolutionary foundations of human altruism. Wiley Interdiscip Rev Cogn Sci. 2016;7:59–71. - PubMed

Publication types

LinkOut - more resources