. 2022 Nov;25(11):1446-1457.
doi: 10.1038/s41593-022-01183-6. Epub 2022 Oct 24.

CD8+ T cells induce interferon-responsive oligodendrocytes and microglia in white matter aging

Affiliations

CD8+ T cells induce interferon-responsive oligodendrocytes and microglia in white matter aging

Tuğberk Kaya et al. Nat Neurosci. 2022 Nov.

Abstract

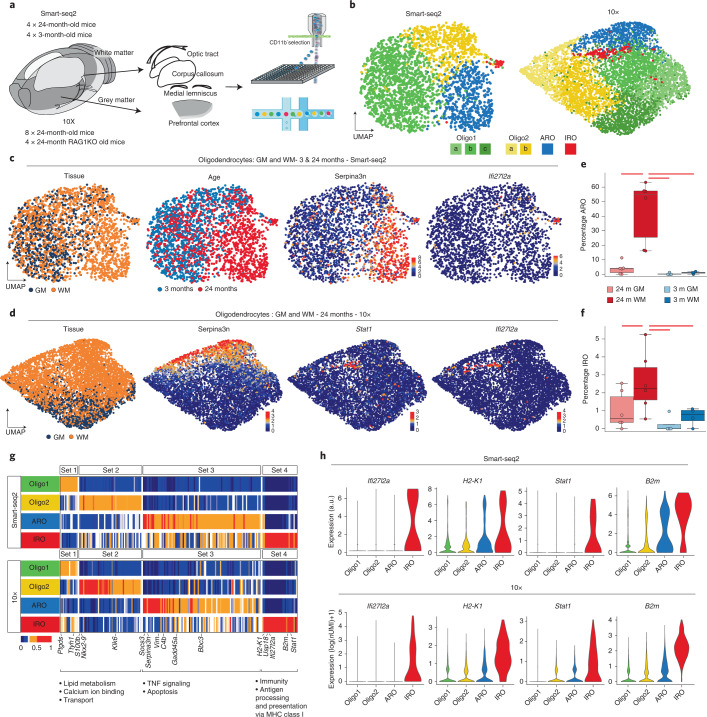
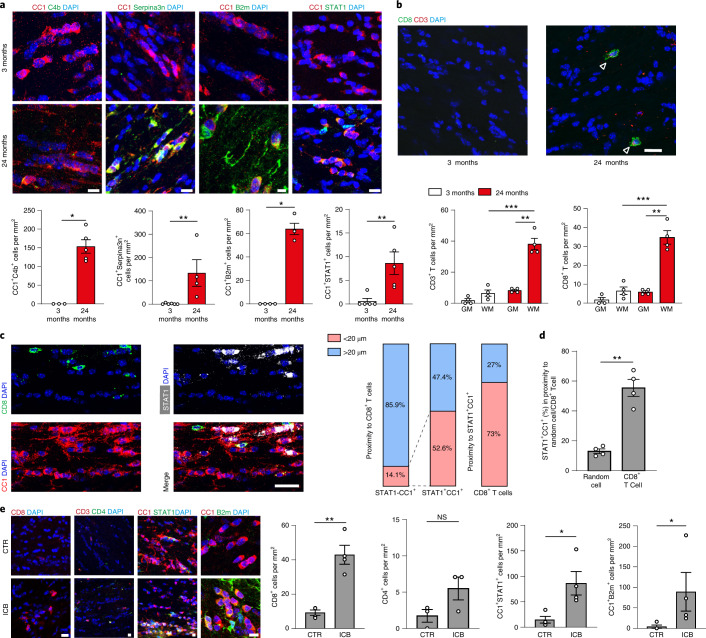
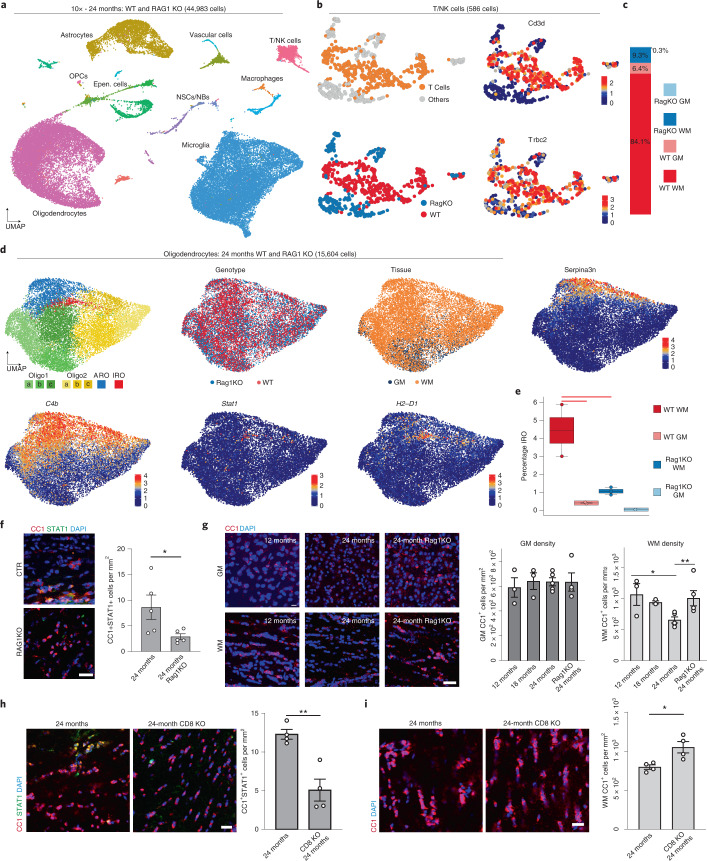
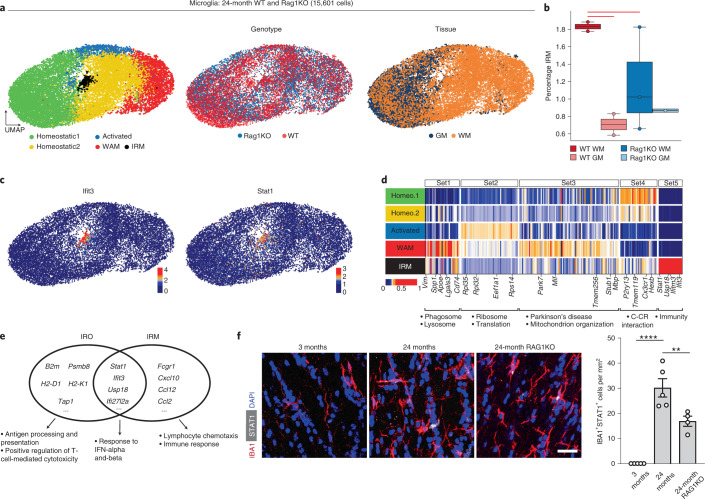
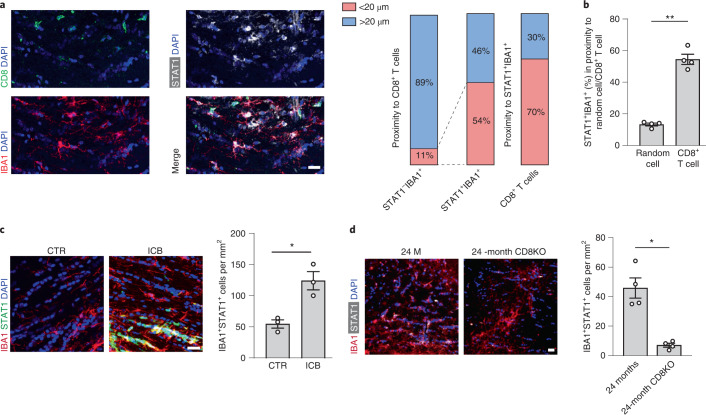
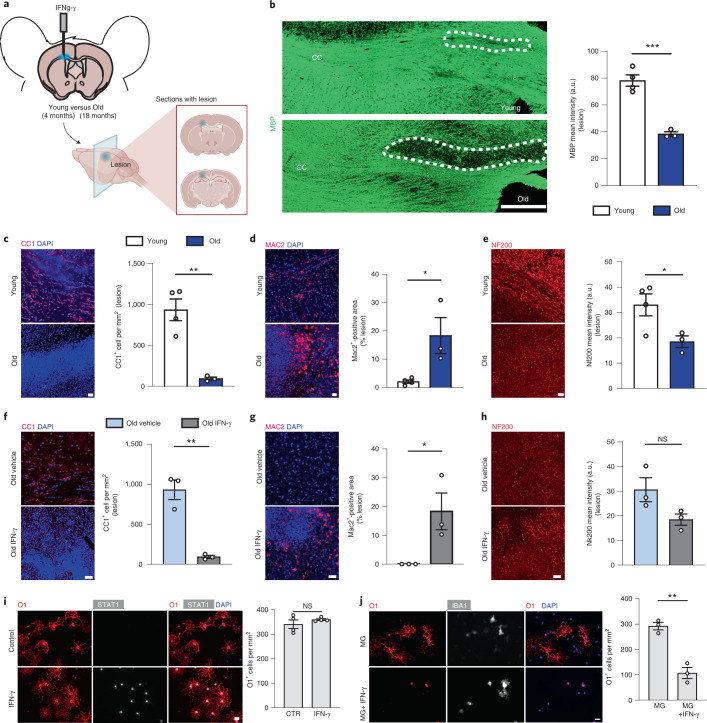
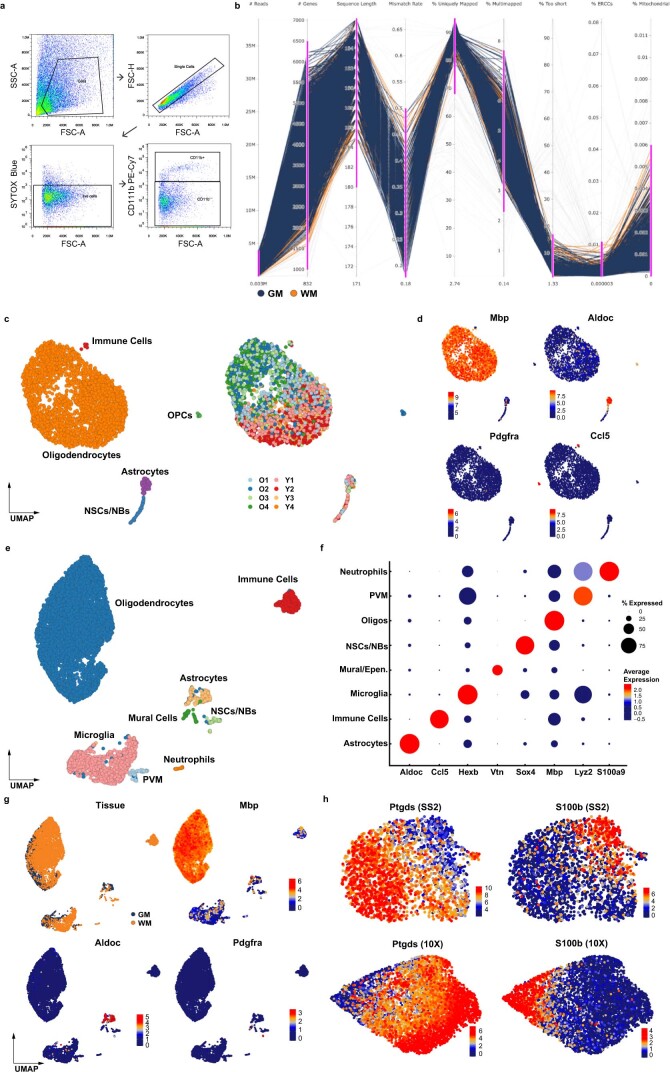
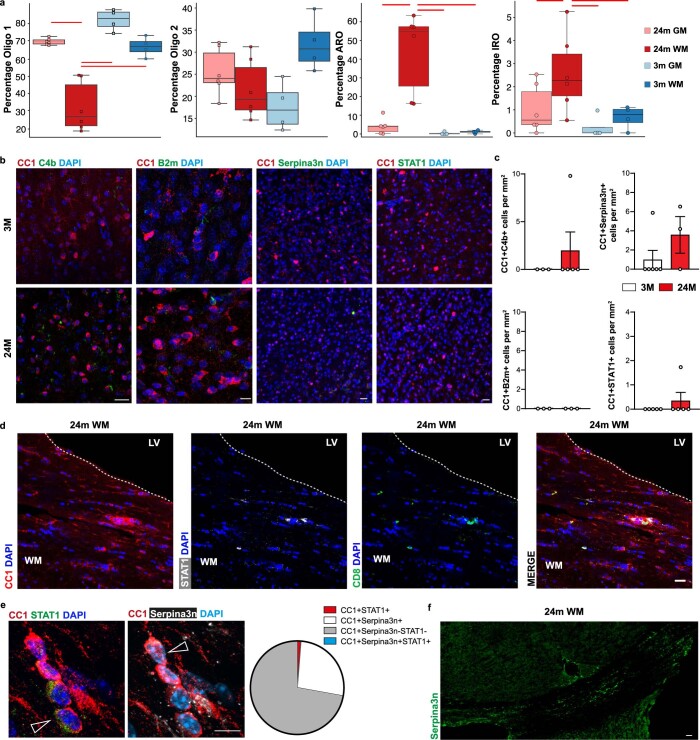
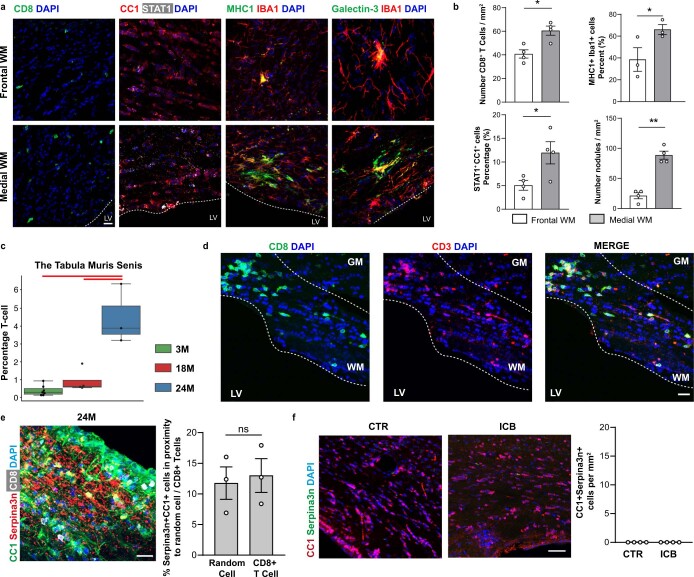
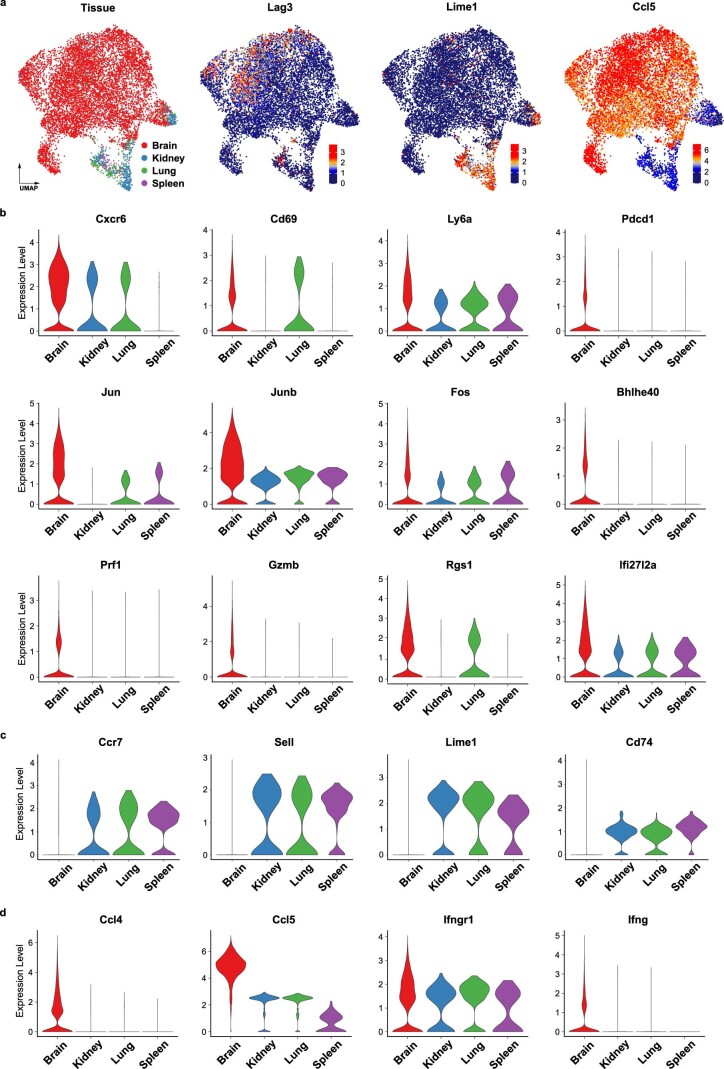
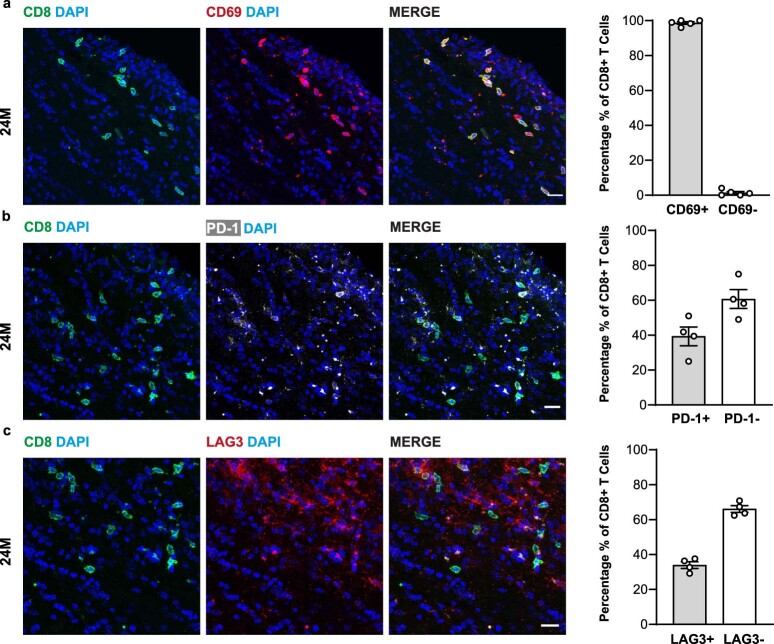
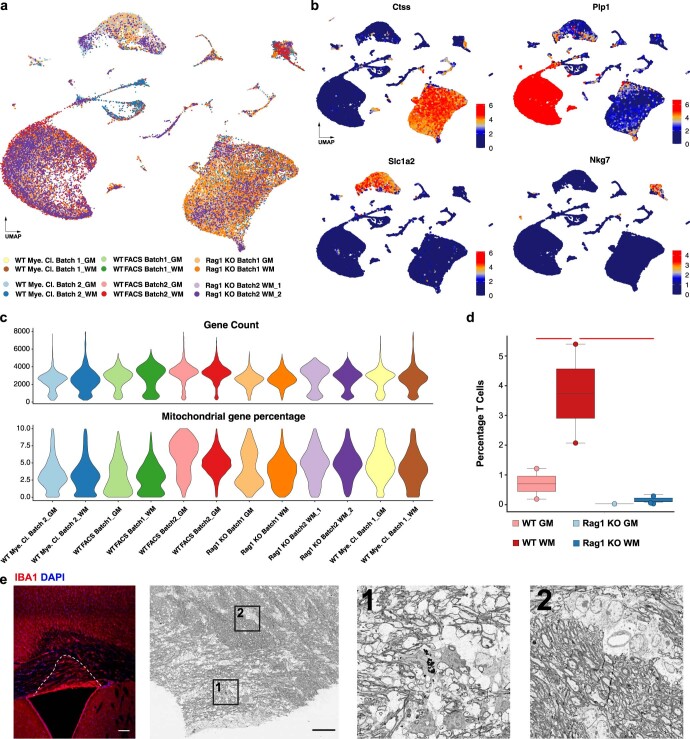
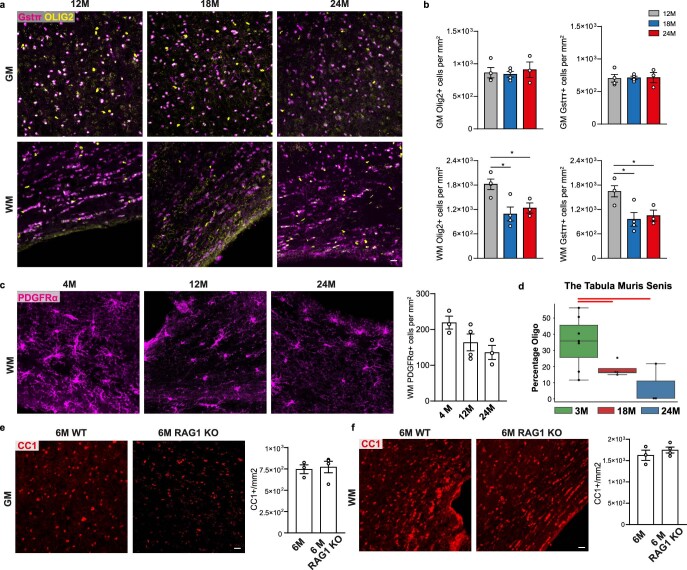
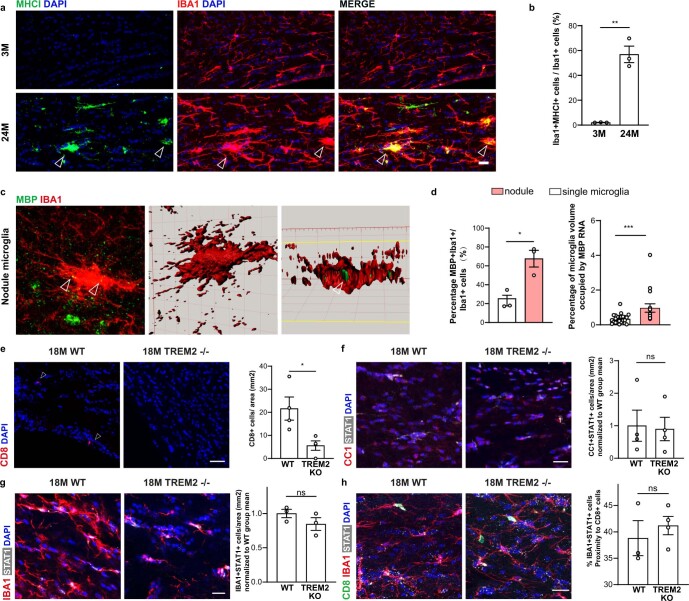
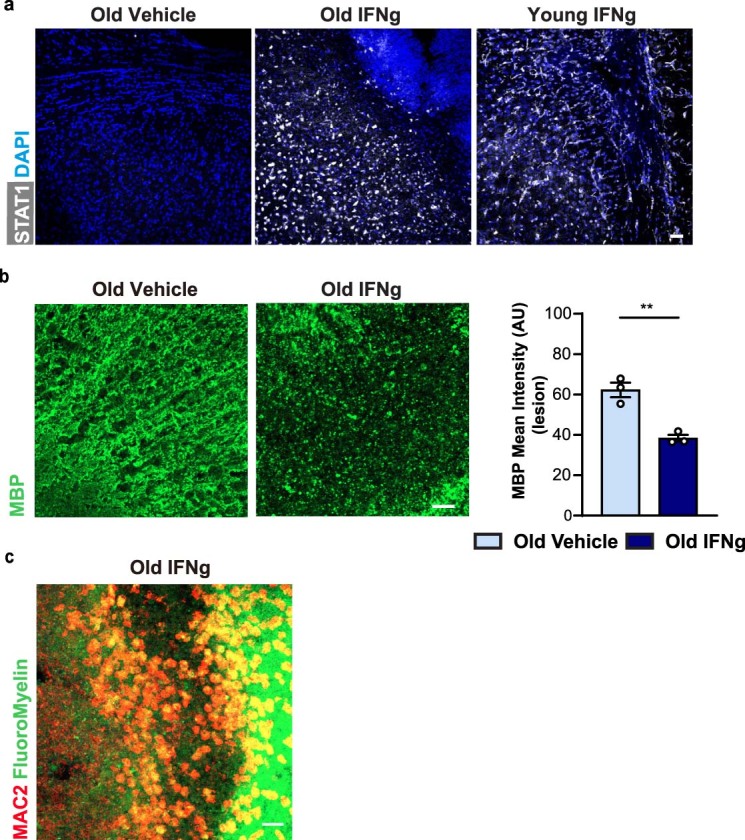
A hallmark of nervous system aging is a decline of white matter volume and function, but the underlying mechanisms leading to white matter pathology are unknown. In the present study, we found age-related alterations of oligodendrocyte cell state with a reduction in total oligodendrocyte density in aging murine white matter. Using single-cell RNA-sequencing, we identified interferon (IFN)-responsive oligodendrocytes, which localize in proximity to CD8+ T cells in aging white matter. Absence of functional lymphocytes decreased the number of IFN-responsive oligodendrocytes and rescued oligodendrocyte loss, whereas T-cell checkpoint inhibition worsened the aging response. In addition, we identified a subpopulation of lymphocyte-dependent, IFN-responsive microglia in the vicinity of the CD8+ T cells in aging white matter. In summary, we provide evidence that CD8+ T-cell-induced, IFN-responsive oligodendrocytes and microglia are important modifiers of white matter aging.


Conflict of interest statement

The authors declare no competing interests.

Figures

Fig. 1
Fig. 1. Identification of age-related gene expression signatures in oligodendrocytes.
a, Experimental design from dissection to cell sorting and cell loading for the plate-based (Smart-seq2 (SS2)) and 10× pipelines, respectively. b, UMAP plots of oligodendrocytes in the SS2 and 10× datasets, colored by identified populations. c, UMAP plots of oligodendrocytes in the SS2 dataset, colored by tissue, age and expression of selected marker genes. d, The 10× dataset oligodendrocyte UMAP plots colored by tissue and expression of selected marker genes. ef, Boxplots of the age-related oligodendrocytes (ARO) (e) and interferon-responsive oligodendrocytes (IRO) (f) cluster proportions per sample, respectively. The central line denotes the median, boxes represent the IQR and whiskers show the distribution except for outliers. Outliers are all points outside 1.5× the IQR. Each dot represents a sample (n = 20 independent experiments) and significant results (scCODA model) are indicated with red bars. 24 m, 24-month-old; 3 m, 3-month-old. g, Heatmaps of average expression of differentially expressed genes, comparing the four oligodendrocyte populations. Gene sets were identified as differentially expressed markers for each population using the SS2 dataset. Values are normalized per gene, showing the gene expression across populations. Each column represents a gene. GO terms are shown below each set of genes (Supplementary Table 3). TNF, tumor necrosis factor. h, Violin plots showing selected IRO-enriched marker genes across SS2 and 10× datasets. a.u., arbitrary units representing the corrected log(1P) (counts) value.
Fig. 2
Fig. 2. IFN-responsive oligodendrocytes localize to aged white matter close to CD8+ T cells.
a, Immunofluorescence staining and quantification of C4b, Serpina3n, B2m and STAT1 in CC1+ oligodendrocytes in the white matter of 3- and 24-month-old mice (C4b+CC1+, 3-month, n = 3, 24-month, n = 5, *P = 0.0357; Serpina3n+CC1+, 3-month, n = 6, 24-month, n = 4, **P = 0.0095; B2m+CC1+, 3-month, n = 4, 24-month, n = 4, *P = 0.0286; STAT1+CC1+, 3-month, n = 5, 24-month, n = 5, **P = 0.0079; data are mean ± s.e.m.; P values are from a two-tailed Mann–Whitney U-test). Scale bar, 20 µm; for B2m, 10 µm. b, Immunofluorescence showing CD3+CD8+ T cells (indicated by arrowheads). Scale bar, 20 μm. Quantification of CD3+ T cells and CD8+ T cells in the gray (GM) and white (WM) matter of 3- and 24-month-old mice (n = 4 mice per group, 3-month WM versus 24-month WM, CD3+, ***P = 0.0003, CD8+, ***P = 0.0005; 24-month GM versus 24-month WM, CD3+, **P = 0.0050, CD8+, **P = 0.0032; data are mean ± s.e.m.; P values represent a two-sided Student’s t-test). c, Immunofluorescence of CD8+ T cells and STAT1+CC1+ oligodendrocytes in proximity in the white matter of 24-month-old mice. Scale bars, 20 μm. Bar plots show quantification of STAT1+ and STAT1CC1+ proximity to CD8+ T cells and vice versa (3 sections per mouse were selected; a total of 134 CD8+ T cells and 272 STAT1+CC1+ oligodendrocytes from 4 mice were analyzed). d, Quantification of the percentage of STAT1+CC1+ oligodendrocytes found in proximity to random cells compared with CD8+ T cells (n = 4 mice per group, **P = 0.0052; data are mean ± s.e.m; P value represents a two-sided paried Student’s t-test). e, Immunofluorescence staining and quantification of CD8+ T cells, CD4+ T cells, B2m+ and STAT1+CC1+ oligodendrocytes in the white matter of mice treated with anti-PD-1 and CTLA-4 (ICB) and isotype control antibodies (CTR) for 6 weeks starting at an age of 18 months (CD8+, n = 4, **P = 0.0011; CD4+, n = 3; STAT1+CC1+, n = 4, *P = 0.0244; B2m+CC1+, n = 4, *P = 0.0286; data are mean ± s.e.m.; P values represent a two-sided Student’s t-test (CD8+, STAT1+CC1+) or two-tailed Mann–Whitney U-test (CD4+, B2m+CC1+)). Scale bar, 20 µm. NS, not significant. Source data
Fig. 3
Fig. 3. Absence of functional lymphocytes reduces IFN-responsive oligodendrocyte numbers and increases oligodendrocyte cell density in the aged white matter.
a, UMAP plot of 44,983 single-cell transcriptomes, colored by major cell types. b, UMAP of T cells and NK cells, colored by T-cell identity, genotype and T-cell marker genes. c, Bar plot showing the relative distribution of each genotype-tissue experimental group within the T/NK cell population. d, UMAP plots of oligodendrocytes in the Rag1−/− and wild-type integrated dataset, colored by identified clusters, genotype and tissue annotation, as well as selected marker genes. e, Boxplot of the IRO cluster proportion per sample. The central line denotes the median, boxes represent the IQR and whiskers show the distribution except for outliers. Outliers are all points outside 1.5× the IQR. Each dot represents a sample (n = 8 independent experiments) and significant results (scCODA model) are indicated with red bars. f, Immunofluorescence staining and quantification of STAT1+CC1+ oligodendrocytes in the white matter of 24-month-old wild-type and 24-month-old Rag1−/− mice (n = 5 mice per group, *P = 0.0466; data are mean ± s.e.m.; P values represent a two-sided Student’s t-test). Scale bar, 20 µm. g, Immunofluorescence staining and quantification of CC1+ oligodendrocyte density in the gray (GM) and white matter (WM) of 12-, 18- and 24-month-old wild-type and Rag1−/− mice (GM, n = 3, 3, 5, 4; WM, n = 3, 3, 5, 4; 12 months versus 24 months, *P = 0.0185, 24-month versus 24-month Rag1−/−, **P = 0.0083; data are mean ± s.e.m.; P values represent two-sided, one-way ANOVA with post hoc Tukey’s test). Scale bar, 20 µm. h, Immunofluorescence staining and quantification of CC1+STAT1+ oligodendrocytes in the white matter of 24-month-old wild-type and CD8/ mice (n = 4 mice per group, **P = 0.0035; data are mean ± s.e.m.; P value represents a two-sided Student’s t-test). Scale bar, 20 µm. i, Immunofluorescence staining and quantification of CC1+ oligodendrocyte density (red) in the white matter of 24-month-old wild-type and CD8−/− mice (n = 4 mice per group, *P = 0.0176; data are mean ± s.e.m.; P value represents a two-sided Student’s t-test). Scale bar, 20 µm. Source data
Fig. 4
Fig. 4. Identification of IFN-responsive microglia in aged white matter.
a, UMAP plots of microglia colored by identified clusters, genotype and tissue annotation. b, Boxplot of the IRM cluster proportion per sample, respectively. WAM, White matter associated microglia; WT, Wild-type. The central line denotes the median, boxes represent the IQR and whiskers show the distribution except for outliers. Outliers are all points outside 1.5× the IQR. Each dot represents a sample (n = 8 independent experiments) and significant results (scCODA model) are indicated with red bars. c, UMAP plots of selected IRM marker genes. d, Heatmaps of average expression of differentially expressed genes, comparing the five microglia populations. Gene sets 1–4 were identified in Safaiyan et al. and set 5 was identified by differential expression analysis of the IRM cluster. Values are normalized per gene, showing the gene expression across populations. Each column represents a gene. GO terms are shown below each set of genes. e, Venn diagram of top 50 differentially expressed genes of IRO and IRM clusters with an intersection set of 16 genes. Gene lists are found in Supplementary Table 3. f, Immunofluorescence staining and quantification of STAT1+IBA1+ microglia in the white matter of 3- and 24-month-old wild-type and 24-month-old Rag1−/− mice (IBA1+STAT1+, n = 5,5,4; 3 months versus 24 months, ***P = 0.000002: 24-month versus 24-month Rag1−/−, **P = 0.0087; data are mean ± s.e.m.; P value represents two-sided, one-way ANOVA with post hoc Tukey’s test). Scale bar, 20 µm. Source data
Fig. 5
Fig. 5. CD8+ T cells induce an IFN-responsive microglia state in the aged white matter.
a, Immunofluorescence staining and quantification of CD8+ T cells (green) and STAT1+IBA1+ microglia proximity in the white matter of 24-month-old mice. Scale bars, 20 μm. Bar plots show quantification of STAT1+ and STAT1IBA1+ in proximity to CD8+ T cells and vice versa (3 sections per mouse were selected, and a total of 117 CD8+ T cells and 203 STAT1+IBA1+ microglia from 4 mice were analyzed). b, Quantification of the percentage of STAT1+IBA1+ microglia found in proximity to random cells compared with CD8+ T cells (n = 4 mice per group, **P = 0.0052; data are mean ± s.e.m.; P value represents a two-sided paired Student’s t-test). c, Immunofluorescence staining and quantification of STAT1+IBA1+ microglia in the white matter of mice treated with anti-PD-1 and CTLA-4 (ICB) and isotype control antibodies (CTR) for 6 weeks starting at the age of 18 months (n = 3 mice per group, *P = 0.0125; data are mean ± s.e.m.; P value represents a two-sided Student’s t-test). Scale bar, 20 µm. d, Immunofluorescence staining and quantification of STAT1+IBA1+ microglia in the white matter of 24-month-old wild-type and 24-month-old CD8/ mice (n = 4 mice per group, *P = 0.0223; data are mean ± s.e.m.; P value represents a two-sided Student’s t-test). Source data
Fig. 6
Fig. 6. IFN-γ injections induce myelin and oligodendrocyte loss in aged mice.
a, Diagram showing the model of IFN-γ injection in the corpus callosum (CC). The lesion area was identified by the positivity for monastral blue. b, Representative pictures of the CC after injection of 1 µl of a solution of 10 ng µl−1 of IFN-γ, 48 h postinjection. The intensity of the staining for MBP (green) was used to quantify the extent of demyelination (young, n = 4; old, n = 3; ***P = 0.0006; data are mean ± s.e.m.; P value represents a two-sided Student’s t-test). a.u., arbitrary units. ce, Representative confocal images and quantifications of IFN-γ-mediated lesions in young and old mice, showing CC1+ oligodendrocytes (c), MAC2+ microglia (d) and NF200+ axons (e). The number of oligodendrocytes was expressed as number of cells per mm2; the amount of phagocytes was expressed as percentage area of the lesion occupied by MAC2+ cells; the extent of axonal damage was expressed as staining intensity of NF200 (young, n = 4; old, n = 3; CC1+, **P = 0.0031; MAC2+, *P = 0.0291; NF200+, *P = 0.0451; data are mean ± s.e.m.; P values represent a two-sided Student’s t-test). Scale bar, 20 µm. fh, Representative confocal images and quantifications of IFN-γ-mediated lesions in old mice and of the vehicle control showing CC1+ oligodendrocytes (f), MAC2+ cells (g) and NF200+ axons (h) (n = 3 mice per group, CC1+, **P = 0.0025; MAC2+, *P = 0.0451; data are mean ± s.e.m.; P values represent a two-sided Student’s t-test). i, Representative images of cultured oligodendrocytes (labeled for O1 in red and STAT1 in white) after treatment with IFN-γ for 24 h compared with control. Quantification of the number of oligodendrocytes after IFN-γ or vehicle treatment, expressed as number of O1+ cells per mm2 (n = 4 biological replicates per group, **P = 0.0022; data are mean ± s.e.m.; P values represent a two-sided Student’s t-test). j, Representative images of oligodendrocytes cultured with microglia alone (MG) or microglia together with IFN-γ (MG+IFN-γ) and stained for O1 (oligodendrocytes) and IBA1 (microglia). Quantification of the number of oligodendrocytes, expressed as number of O1+ cells per mm2 (n = 4 biological replicates per group, **P = 0.0022; data are mean ± s.e.m.; P values represent a two-sided Student’s t-test). Source data
Extended Data Fig. 1
Extended Data Fig. 1. Sorting strategy and quality control of scRNA-seq data.
a, Sorting strategy for the SS2 libraries. Flow cytometry gating of CD11b negative cells to enrich for oligodendrocytes and astrocytes. b, Parallel coordinates trace for Smart-seq2 dataset quality metrics. Distribution of 9 quantitative quality control metrics reported by fastqc or from early gene expression matrix analysis. Each line, continuously going through all metrics is a sample (single cell). Light grey samples were discarded based on windows of inclusion (depicted in fuchsia for each metric). Selected samples for the grey matter are in blue, white matter are in orange. From left to right, the metrics are: number of reads, number of genes, average length of sequence after trimming, mismatch rate during alignment, % of uniquely mapped reads, % of multimapped reads, % of reads considered too short, % of ERCCs, % of mitochondrial genes. 2538 single-cells passed the quality-control thresholds. c, UMAP plots of 2538 single-cell transcriptomes. Cell type clusters and samples from different animals are colour coded. O1-2-3-4 and Y1-2-3-4 correspond to samples from 24-month old and 3-month old animals, respectively. d, UMAP plots of selected cell type-specific marker genes in the SS2 dataset; Mbp (Oligodendrocyte), Aldoc (Astrocyte), Pdgfra (OPC), Ccl5 (Immune cells). e, UMAP plot of 8726 single-cell transcriptomes in the 10x dataset. Different cell type clusters are color coded. f, Dot plot showing cell-type marker gene expression by clusters. g, UMAP plots of tissue annotation and cell-type specific marker genes in the 10x dataset. h, UMAP plots of the oligodendrocyte populations depicting the expression of Oligo1 and Oligo2 marker genes (Ptgds and S100b, respectively), in the SS2 and 10x dataset.
Extended Data Fig. 2
Extended Data Fig. 2. Characterization of age-related and interferon-responsive oligodendrocytes.
a, Boxplots of the Oligo1, Oligo2, ARO and IRO cluster proportions per sample (n = 20 independent experiments). The central line denotes the median, boxes represent the interquartile range (IQR), and whiskers show the distribution except for outliers. Outliers are all points outside 1.5 times of the IQR. Each dot represents a sample and significant results (scCODA model) are indicated with red bars. b, Immunofluorescence showing expression of C4b, B2m, Serpina3n and STAT1 (green) in CC1+ oligodendrocytes (red) in the grey matter of 3- and 24- month old mice. Scale bar for C4b, Serpina3n and STAT1 20 µm, for B2m 10 µm. c, Quantification of CC1+ oligodendrocytes expressing C4b, B2m, Serpina3n and STAT1 at 3- and 24-month old mice in the grey matter (C4b+CC1+, 3 M, n = 3, 24 M, n = 5; Serpina3n+CC1+, 3 M, n = 6, 24 M, n = 3; B2m+CC1+, 3 M, n = 4, 24 M, n = 4; STAT1+CC1+, 3 M, n = 5, 24 M, n = 5; data are means±s.e.m.; P values from two-tailed Mann–Whitney test). d, Representative confocal images showing CD8+ T cells (green) and STAT1+CC1+ (white and red, respectively) oligodendrocytes in the white matter of 24-month old mice. e, Immunofluorescence showing expression Serpina3n (white) and STAT1 (green) in CC1+ oligodendrocytes (red) in 24-month old mice in the white matter. Scale bar, 10 µm. Arrows indicate cells positive for STAT1+CC1+ and Serpina3n+CC1+. Pie chart of percentage of different subpopulations. f, Representative confocal overview image of large showing Serpina3n distribution in the white matter of 24-month old mice. The experiment was repeated three times independently with similar results. Scale bar, 50 µm. Source data
Extended Data Fig. 3
Extended Data Fig. 3. Characterization of CD8 + T cells in the aging white matter.
a, Immunofluorescence staining showing the different densities of CD8+ T cells, STAT1+CC1+ cells, MHC1+IBA1+ cells and nodules (Galectin-3+Iba1+ cell clusters) between frontal white matter away from lateral ventricles and medial white matter close to lateral ventricles. Scale bar 20 µm. b, Quantification of CD8+ T cells, STAT1+CC1+ cells, MHC1+IBA1+ cells, and nodules (Galectin-3+IBA1+ cells cluster) density difference between frontal white matter and medial white matter of 24-month old mice (for CD8+, STAT1+CC1+, and nodules, n = 4 mice per group; CD8+, *P = 0.0438; STAT1+CC1+, *P = 0.0148; nodules, **P = 0.0088; for MHC1+IBA1+, n = 3 mice per group; *P = 0.0479; data are means±s.e.m. P values represent a two-sided paried Student’s t-test). c, T cells proportion per (n = 14 independent experiments) in the Tabula Muris Senis dataset. The central line denotes the median, boxes represent the interquartile range (IQR), and whiskers show the distribution except for outliers. Outliers are all points outside 1.5 times of the IQR. d, Representative confocal images of aged white matter stained for CD3 (red) and CD8 (green). The experiment was repeated three times independently with similar results. Scale bar, 20 µm. e, Immunofluorescence image showing CD8+ T cells (white) and Serpina3n+ (red) in CC1+ oligodendrocytes (green) in the white matter of 24-month old mice. Scale bars, 20 μm. Quantification of the percentage of Serpina3n+CC1+ oligodendrocytes found around random cells (<20 µm) compared to the percentage of Serpina3n+CC1+ oligodendrocytes found around CD8+ T cells (n = 3 mice per group; data are means±s.e.m.; P value represents a two-sided paried Student’s t-test). f, Immunofluorescence showing expression of Serpina3n (green) in CC1+ oligodendrocytes (red) in the white matter of mice treated with antibodies anti PD-1 and CTLA-4 and isotype control for 6 weeks starting at an age of 18 months. Scale bar 20 µm. Quantification of CC1+ oligodendrocytes expressing Serpina3n in the white matter of mice treated with antibodies anti PD-1 and CTLA-4 and isotype control antibodies (n = 4 mice per group; data are means±s.e.m). Source data
Extended Data Fig. 4
Extended Data Fig. 4. Comparison of transcriptome prolife of CD8 + T cells within the brain compared to other organs.
a, UMAP plots of 9732 CD8+ T cells isolated from published aged mouse scRNA-seq datasets; Brain CD8+ T cells (3 independent experiments taken from the Groh et al and the Tabula Muris Senis datasets), Kidney, Lung and spleen CD8+ T cells (2-4 independent experiments taken from the Tabula Muris Senis 21- and 24-months old datasets), colored by tissue annotation and the expression of selected marker genes. bc, Violin plots of up-regulated (b) and down-regulated (c) genes in the brain compared to kidney, lung and spleen. d, Violin plots of differentially expressed cytokine and cytokine receptor genes in the brain.
Extended Data Fig. 5
Extended Data Fig. 5. CD8 + T cells within the aged white matter express tissue-resident memory and checkpoint markers.
a, Representative confocal images of aged white matter stained for CD8 (green) with CD69 (red). Scale bar, 20 µm. Quantification of the percentage of CD8+ and CD69+ T cells in the aged white matter (three sections per mouse; 256 CD8+ T cells were analyzed from 4 mice; data are means±s.e.m). b, Representative confocal images of aged white matter stained for CD8 (green) with PD-1 (white). Scale bar, 20 µm. Quantification of the percentage of CD8+ and PD-1+ cells in the aged white matter (three sections per mouse; 237 CD8+ T cells were analyzed from 4 mice; data are means±s.e.m). c, Representative confocal images of aged white matter stained for CD8 (green) with LAG3 (red). Scale bar, 20 µm. Quantification of the percentage of CD8+ and LAG3+ cells in the aged white matter (three sections per mouse; 237 CD8+ T cells were analyzed from 4 mice; data are means±s.e.m). Source data
Extended Data Fig. 6
Extended Data Fig. 6. T cell characterization and evidence of focal areas of hypomyelination in the aged white matter.
a, UMAP plot of 44938 single-cell transcriptomes. Sequencing runs are color-coded. b, UMAP plots selected cell-type specific marker genes. c, Violin plots of gene count and mitochondrial gene percentage per cell in each sample. d, Boxplot of the T cells (Fig. 3a,b) proportion per sample (n = 8 independent experiments), respectively. The central line denotes the median, boxes represent the interquartile range (IQR), and whiskers show the distribution except for outliers. Outliers are all points outside 1.5 times of the IQR. Each dot represents a sample and significant results (scCODA model) are indicated with red bars. e, Confocal microscopy image of a vibratome brain section from 24-month old wild type mice stained for Iba1 (red) and DAPI (blue). Scale bar 100 µm. Correlative Light and Electron Microscopy of the corpus callosum in the aged mice with two boxed regions labeled as 1 and 2. Scanning electron micrograph of the same region on the adjacent vibratome section showing normal myelination next to areas with hypomyelination. Scale bar 50 µm. Boxed regions of thinner myelin with myelin fragments (1) and normal myelin (2) are shown at higher resolution. The experiment was repeated three times independently with similar results.
Extended Data Fig. 7
Extended Data Fig. 7. Evidence of oligodendrocyte loss in the aged white matter.
a, Immunofluorescence showing OLIG2+ oligodendrocytes lineage cells (yellow) and oligodendrocytes GSTπ+ (magenta) and in the grey and white matter of 12-, 18-, 24-month old mice. Scale bar 20 µm. b, Quantification OLIG2+ and GSTπ+ cells in the grey and white matter of 12-, 18-, 24-month old mice (for all the graphs in b, n = 4,4,3 mice per group; Olig2+ cells in WM, 12 M versus 24 M, *P = 0.0493, 12 M versus 18 M, *P = 0.0123; GSTπ+ cells in WM, 12 M versus 24 M, *P = 0.0481, 12 M versus 18 M, *P = 0.0180; data are mean±s.e.m.; P values represent two sided one-way ANOVA with post hoc Tukey test). c, Immunofluorescence showing and PDGFRα+ cells (magenta) in the white matter of 4-, 12-, 24-month old mice. Scale bar 20 µm. Quantification PDGFRα+ OPCs (magenta) in the white matter of 4-, 12-, 24-month old mice (PDGFRα+, n = 3,4,3; data are mean ± s.e.m.; P value represents two sided, one-way ANOVA with post hoc Tukey test). d, Oligodendrocytes proportion per sample (n = 14 independent experiments) in the Tabula Muris Senis dataset. The central line denotes the median, boxes represent the interquartile range (IQR), and whiskers show the distribution except for outliers. Outliers are all points outside 1.5 times of the IQR. e-f, Immunofluorescence showing CC1+ oligodendrocytes (red) in the grey matter and white matter of 6-month old wild type and Rag1−/− mice. Scale bar, 20 µm. Quantification of CC1+ oligodendrocytes in the grey matter and white matter of 6-month old wild type and Rag1−/− mice (n = 3,4 mice per group, mean ± s.e.m.). Source data
Extended Data Fig. 8
Extended Data Fig. 8. TREM2-independent formation of interferon-responsive oligodendrocytes and microglia in the aged white matter.
a, Immunofluorescence staining and b, quantification of MHC1+IBA1+ microglia in the white matter of 3-month old and 24-month old mice. Arrow marks MHC1+ nodules (n = 3 mice per group, **P = 0.0012; data are means±s.e.m; P value represents a two-sided Student’s t-test). Arrows mark double positive microglia nodulces. c, Immunofluorescence combined with RNAscope of MBP mRNA (green) within IBA1+ microglia nodule (red). Clipped 3D images show MBP mRNA in a microglia nodule. Arrow mark MBP mRNA inside microglia. Scale bar, 20 µm, 3D rendering 10 µm. d, Quantification of percentage of IBA1+ single microglia and IBA1+ nodule with MBP mRNA inside (n = 3 mice per group, *P = 0.0160; data are means±s.e.m; P values represent a two-sided Student’s t-test). Quantification of percentage of IBA1+ volume occupied by MBP mRNA (single microglia, n = 26 cells, IBA1+ nodules, n = 30; ***P = 0.0004; data are means±s.e.m.; P value represents two-tailed Mann-Whitney test). e, Immunofluorescence staining and quantification of CD8+ T (red) cells in the white matter of 18-month old wild type and Trem2/ (n = 4 mice per group, *P = 0.0252; data are means±s.e.m; P value represents a two-sided Student’s t-test). Arrows indicate CD8+ T cells. Scale bar 20 µm. f, Immunofluorescence staining and quantification of STAT1+CC1+ oligodendrocytes in the white matter of 18-month old wild type and 18-month old Trem2/ mice (n = 4 mice per group; data are means±s.e.m; P value represents a two-sided Student’s t-test). Scale bar, 20 µm. g, Immunofluorescence staining and quantification of STAT1+IBA1+ microglia in the white matter of 18-month old wild type and 18-month old Trem2/ mice (n = 3 mice per group; data are means±s.e.m; P value represents a two-sided Student’s t-test). Scale bar, 20 µm. h, Immunofluorescence staining of CD8+ T cells and STAT1+IBA1+ microglia in the white matter of 18-month old wild type and 18-month old Trem2/ mice. Scale bars, 20 μm. Quantification of STAT1+IBA1+ microglia and CD8+ T cells proximity (<20 µm) in 18-month old wild type and Trem2/ mice (WT, n = 3; Trem2/, n = 4 mice; data are means ± s.e.m. P value represents a two-sided Student’s t-test). Source data
Extended Data Fig. 9
Extended Data Fig. 9. Characterization of IFN-γ-mediated lesions in the white matter of young and old mice.
a, Representative confocal images of IFN-γ-mediated lesions in young and old mice and of the vehicle control stained for STAT1 (white) and DAPI (nuclei, blue). b, The data shown in Fig. 5 for IFN-γ-mediated lesions in 18-months old mice is shown here in comparison to vehicle control injections in 18-months old mice. Representative confocal images and quantifications of IFN-γ-mediated lesions in old mice and of the vehicle control showing MBP. The intensity of the staining for MBP was used to quantify the extent of demyelination (n = 3 mice per group, **P = 0.0040; data are means±s.e.m.; P value represents a two-sided Student’s t-test). c, Representative confocal images of IFN-γ-mediated lesions in old mice showing MAC2+ cells (red) with myelin (green) stained by FluoroMyelin. All scale bars, 20 μm. The experiments were repeated three times independently with similar results. Source data

Comment in

  • T cells drive aging of the brain.
    Liston A, Yshii L. Liston A, et al. Nat Immunol. 2023 Jan;24(1):12-13. doi: 10.1038/s41590-022-01390-0. Nat Immunol. 2023. PMID: 36596892 No abstract available.

References

    1. Hou Y, et al. Ageing as a risk factor for neurodegenerative disease. Nat. Rev. Neurol. 2019;15:565–581. doi: 10.1038/s41582-019-0244-7. - DOI - PubMed
    1. Stadelmann C, Timmler S, Barrantes-Freer A, Simons M. Myelin in the central nervous system: structure, function, and pathology. Physiol. Rev. 2019;99:1381–1431. doi: 10.1152/physrev.00031.2018. - DOI - PubMed
    1. Hughes, E. G., Orthmann-Murphy, J. L., Langseth, A. J. & Bergles, D. E. Myelin remodeling through experience-dependent oligodendrogenesis in the adult somatosensory cortex. Nat. Neurosci. 10.1038/s41593-018-0121-5 (2018). - PMC - PubMed
    1. Hill, R. A., Li, A. M. & Grutzendler, J. Lifelong cortical myelin plasticity and age-related degeneration in the live mammalian brain. Nat. Neurosci. 10.1038/s41593-018-0120-6 (2018). - PMC - PubMed
    1. Fard, M. K. et al. BCAS1 expression defines a population of early myelinating oligodendrocytes in multiple sclerosis lesions. Sci. Transl. Med.10.1126/scitranslmed.aam7816 (2017). - PMC - PubMed

Publication types