

Transcriptomic and metabolomic analyses reveal how girdling promotes leaf color expression in Acer rubrum L
- PMID: 36280828
- PMCID: PMC9590220
- DOI: 10.1186/s12870-022-03776-6
Transcriptomic and metabolomic analyses reveal how girdling promotes leaf color expression in Acer rubrum L
Abstract
Background: Acer rubrum L. (red maple) is a popular tree with attractive colored leaves, strong physiological adaptability, and a high ornamental value. Changes in leaf color can be an adaptive response to changes in environmental factors, and also a stress response to external disturbances. In this study, we evaluated the effect of girdling on the color expression of A. rubrum leaves. We studied the phenotypic characteristics, physiological and biochemical characteristics, and the transcriptomic and metabolomic profiles of leaves on girdled and non-girdled branches of A. rubrum.
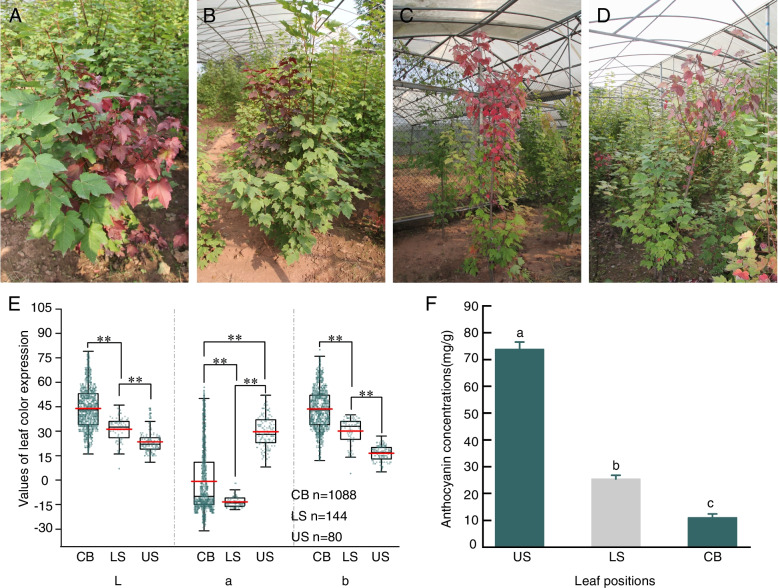
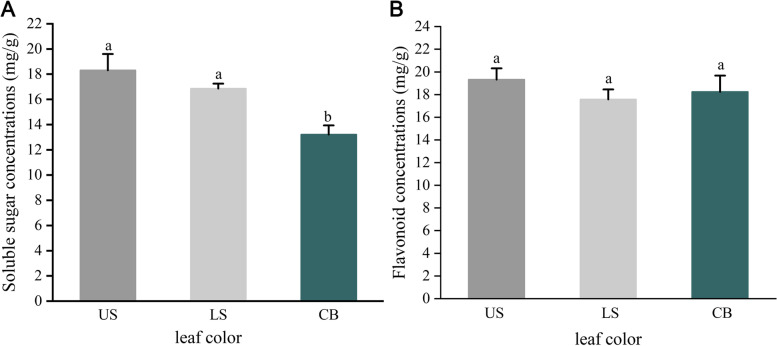
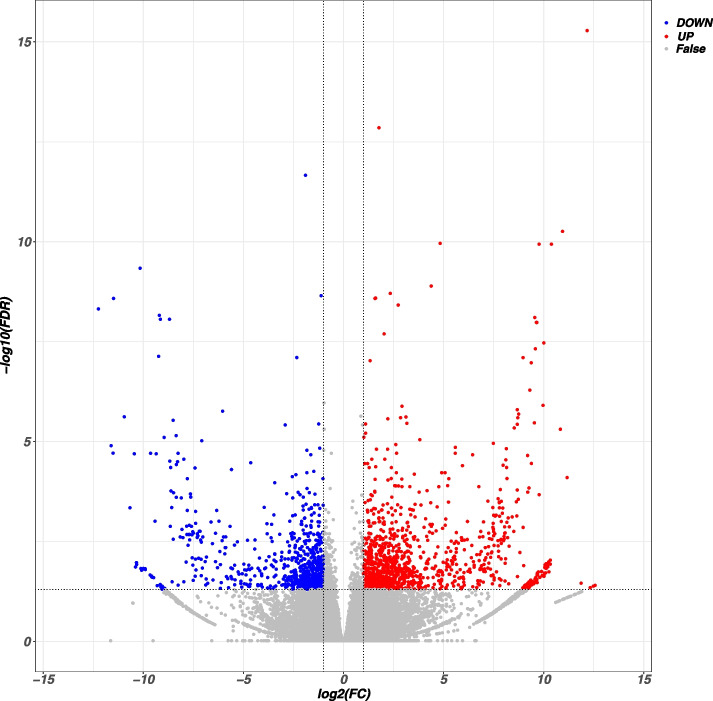
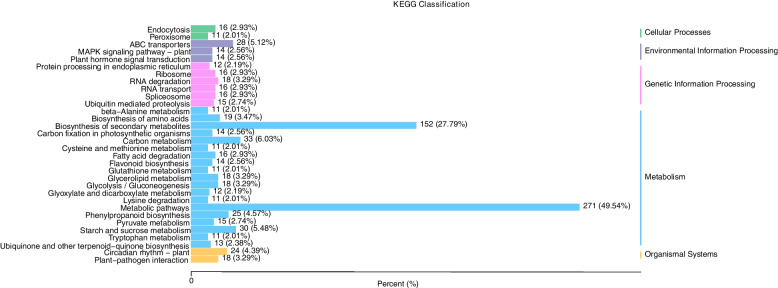
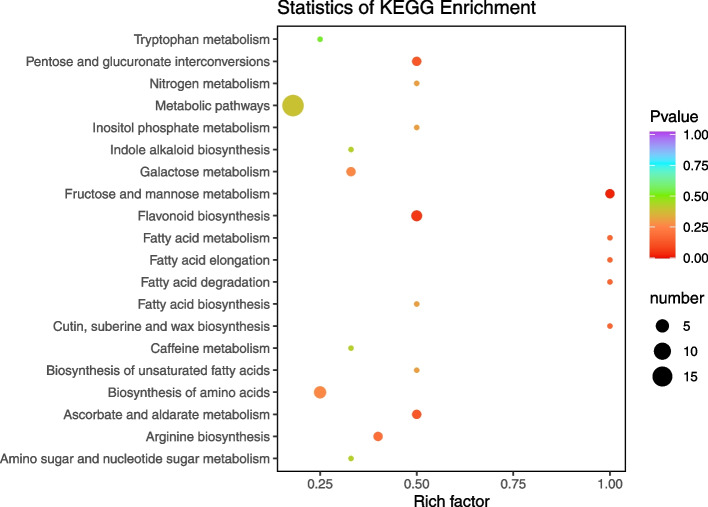
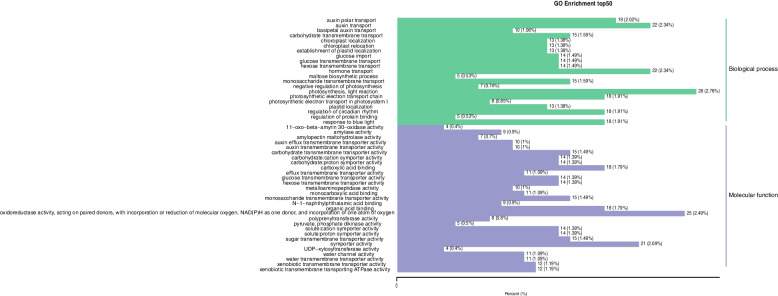
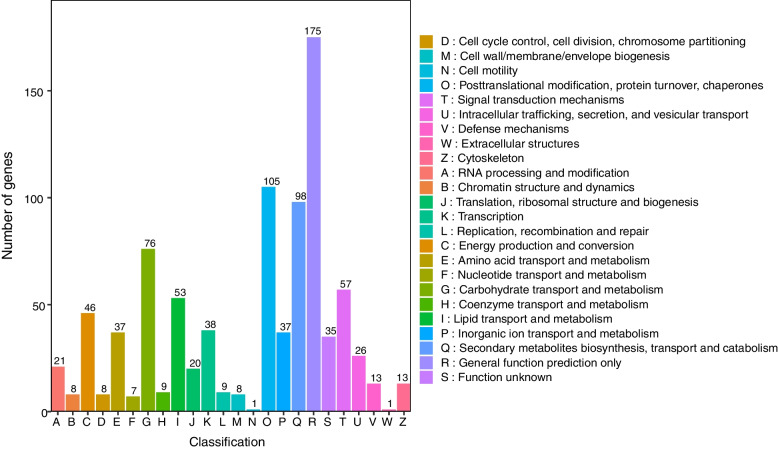
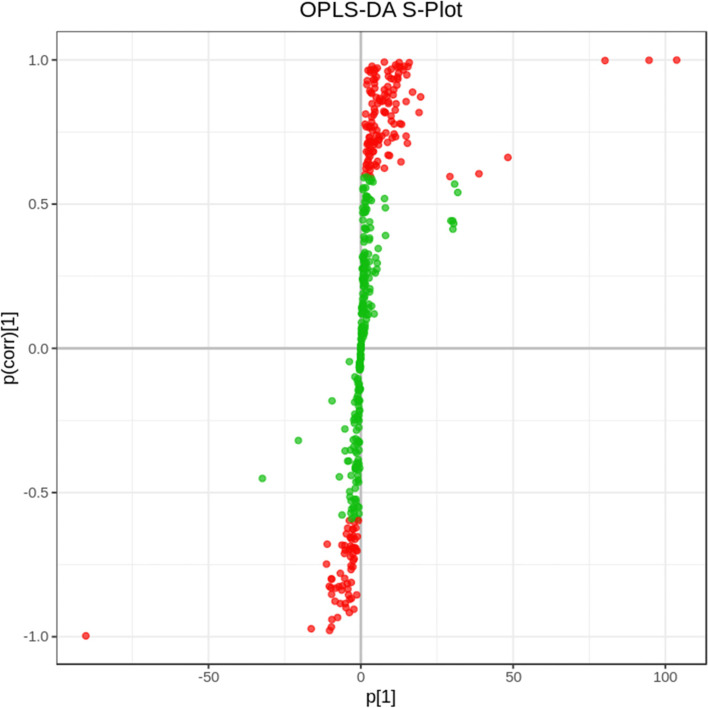
Results: Phenotypic studies showed that girdling resulted in earlier formation of red leaves, and a more intense red color in the leaves. Compared with the control branches, the girdled branches produced leaves with significantly different color parameters a*. Physiological and biochemical studies showed that girdling of branches resulted in uneven accumulation of chlorophyll, carotenoids, anthocyanins, and other pigments in leaves above the band. In the transcriptomic and metabolomic analyses, 28,432 unigenes including 1095 up-regulated genes and 708 down-regulated genes were identified, and the differentially expressed genes were mapped to various KEGG (kyoto encyclopedia of genes and genomes) pathways. Six genes encoding key transcription factors related to anthocyanin metabolism were among differentially expressed genes between leaves on girdled and non-girdled branches.
Conclusions: Girdling significantly affected the growth and photosynthesis of red maple, and affected the metabolic pathways, biosynthesis of secondary metabolites, and carbon metabolisms in the leaves. This resulted in pigment accumulation in the leaves above the girdling site, leading to marked red color expression in those leaves. A transcriptome analysis revealed six genes encoding anthocyanin-related transcription factors that were up-regulated in the leaves above the girdling site. These transcription factors are known to be involved in the regulation of phenylpropanoid biosynthesis, anthocyanin biosynthesis, and flavonoid biosynthesis. These results suggest that leaf reddening is a complex environmental adaptation strategy to maintain normal metabolism in response to environmental changes. Overall, the results of these comprehensive phenotype, physiological, biochemical, transcriptomic, and metabolomic analyses provide a deeper and more reliable understanding of the coevolution of red maple leaves in response to environmental changes.
Keywords: Acer rubrum L.; Anthocyanin; Chlorophyll; Girdling; Leaf coloration; Metabolomics; Physiological; Transcriptome.
© 2022. The Author(s).
Conflict of interest statement
The authors declare that they have no competing interests.
Figures
Similar articles
-
Stem girdling manipulates leaf sugar concentrations and anthocyanin expression in sugar maple trees during autumn.Tree Physiol. 2008 Oct;28(10):1467-73. doi: 10.1093/treephys/28.10.1467. Tree Physiol. 2008. PMID: 18708328
-
Anthocyanin metabolites and related regulatory genes analysis in leaves of Acer Pseudosieboldianum mutant during different periods of color change.BMC Genomics. 2025 Feb 22;26(1):182. doi: 10.1186/s12864-025-11378-3. BMC Genomics. 2025. PMID: 39987037 Free PMC article.
-
Unravelling the physiological and molecular mechanisms of leaf color change in Acer griseum through multi-omics analysis.Plant Physiol Biochem. 2024 Nov;216:109198. doi: 10.1016/j.plaphy.2024.109198. Epub 2024 Oct 16. Plant Physiol Biochem. 2024. PMID: 39427360
-
Comparative physiological, biochemical, metabolomic, and transcriptomic analyses reveal the formation mechanism of heartwood for Acacia melanoxylon.BMC Plant Biol. 2024 Apr 22;24(1):308. doi: 10.1186/s12870-024-04884-1. BMC Plant Biol. 2024. PMID: 38644502 Free PMC article. Review.
-
Deeper insights into the physiological and metabolic functions of the pigments in plants and their applications: beyond natural colorants.Physiol Plant. 2025 Mar-Apr;177(2):e70168. doi: 10.1111/ppl.70168. Physiol Plant. 2025. PMID: 40159765 Review.
Cited by
-
Metabolome analysis reveals flavonoid changes during the leaf color transition in Populus × euramericana 'Zhonghuahongye'.Front Plant Sci. 2023 May 8;14:1162893. doi: 10.3389/fpls.2023.1162893. eCollection 2023. Front Plant Sci. 2023. PMID: 37223816 Free PMC article.
-
In vitro induction of tetraploids and their phenotypic and transcriptome analysis in Glehnia littoralis.BMC Plant Biol. 2024 May 22;24(1):439. doi: 10.1186/s12870-024-05154-w. BMC Plant Biol. 2024. PMID: 38778255 Free PMC article.
-
Color-induced changes in Chrysanthemum morifolium: an integrative transcriptomic and metabolomic analysis of petals and non-petals.Front Plant Sci. 2024 Dec 20;15:1498577. doi: 10.3389/fpls.2024.1498577. eCollection 2024. Front Plant Sci. 2024. PMID: 39759235 Free PMC article.
-
Variability in Leaf Color Induced by Chlorophyll Deficiency: Transcriptional Changes in Bamboo Leaves.Curr Issues Mol Biol. 2024 Feb 14;46(2):1503-1515. doi: 10.3390/cimb46020097. Curr Issues Mol Biol. 2024. PMID: 38392215 Free PMC article.
-
Comparative Metabolome and Transcriptome Analyses of the Regulatory Mechanism of Light Intensity in the Synthesis of Endogenous Hormones and Anthocyanins in Anoectochilus roxburghii (Wall.) Lindl.Genes (Basel). 2024 Jul 26;15(8):989. doi: 10.3390/genes15080989. Genes (Basel). 2024. PMID: 39202350 Free PMC article.
References
-
- Yun Z, Yves B, Xiu-Hai Z, et al. Stand history is more important than climate in controlling red maple (Acer rubrum L.) growth at its northern distribution limit in western Quebec, Canada. J Plant Ecol. 2015:8(4):368.
-
- Jian Z. The overview of technique research on Acer rubrum of American colorful-leaf trees. J Guangxi Agriculture. 2009.
-
- Ren J, Zeng-Cheng D, F Tang, et al. A New Acer rubrum Cultivar ‘Jinmaihong’. Acta Horticulturae Sinica, 2013.
MeSH terms
Substances
Grants and funding
LinkOut - more resources
Full Text Sources
