

Trends in mortality from alcohol, opioid, and combined alcohol and opioid poisonings by sex, educational attainment, and race and ethnicity for the United States 2000-2019
- PMID: 36280833
- PMCID: PMC9590383
- DOI: 10.1186/s12916-022-02590-z
Trends in mortality from alcohol, opioid, and combined alcohol and opioid poisonings by sex, educational attainment, and race and ethnicity for the United States 2000-2019
Abstract
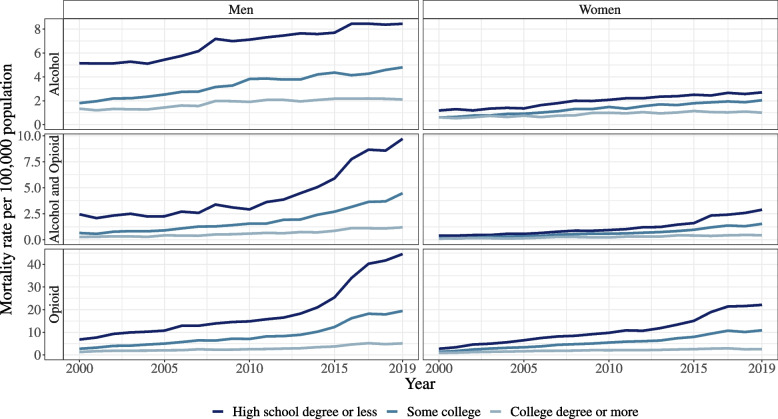
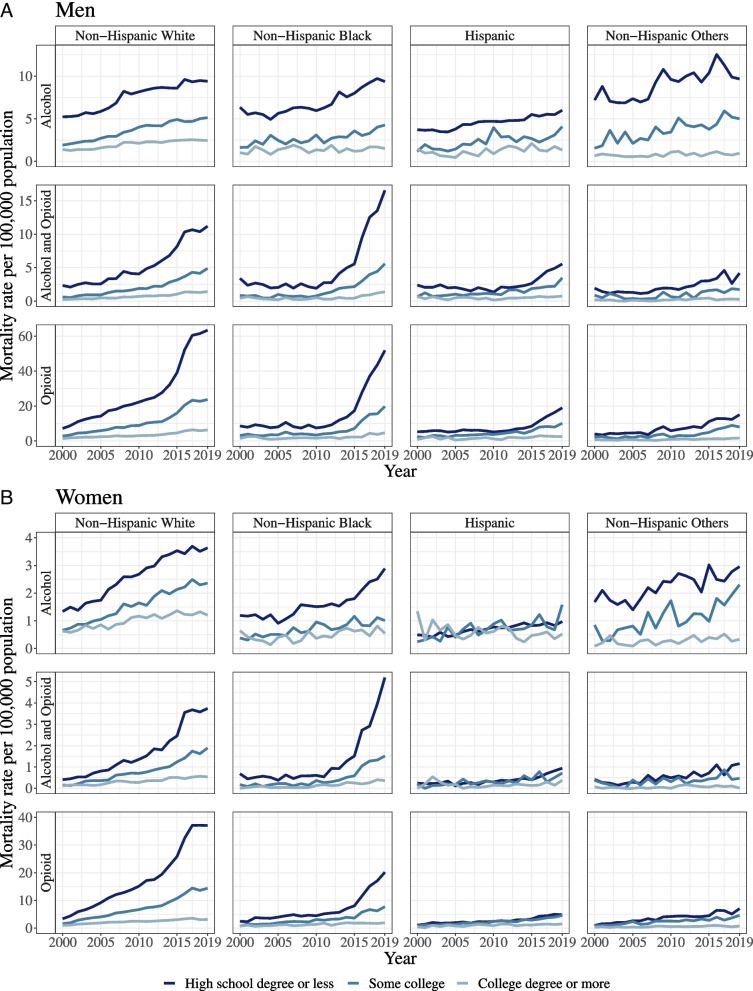
Background: The ongoing opioid epidemic and increases in alcohol-related mortality are key public health concerns in the USA, with well-documented inequalities in the degree to which groups with low and high education are affected. This study aimed to quantify disparities over time between educational and racial and ethnic groups in sex-specific mortality rates for opioid, alcohol, and combined alcohol and opioid poisonings in the USA.
Methods: The 2000-2019 Multiple Cause of Death Files from the National Vital Statistics System (NVSS) were used alongside population counts from the Current Population Survey 2000-2019. Alcohol, opioid, and combined alcohol and opioid poisonings were assigned using ICD-10 codes. Sex-stratified generalized least square regression models quantified differences between educational and racial and ethnic groups and changes in educational inequalities over time.
Results: Between 2000 and 2019, there was a 6.4-fold increase in opioid poisoning deaths, a 4.6-fold increase in combined alcohol and opioid poisoning deaths, and a 2.1-fold increase in alcohol poisoning deaths. Educational inequalities were observed for all poisoning outcomes, increasing over time for opioid-only and combined alcohol and opioid mortality. For non-Hispanic White Americans, the largest educational inequalities were observed for opioid poisonings and rates were 7.5 (men) and 7.2 (women) times higher in low compared to high education groups. Combined alcohol and opioid poisonings had larger educational inequalities for non-Hispanic Black men and women (relative to non-Hispanic White), with rates 8.9 (men) and 10.9 (women) times higher in low compared to high education groups.
Conclusions: For all types of poisoning, our analysis indicates wide and increasing gaps between those with low and high education with the largest inequalities observed for opioid-involved poisonings for non-Hispanic Black and White men and women. This study highlights population sub-groups such as individuals with low education who may be at the highest risk of increasing mortality from combined alcohol and opioid poisonings. Thereby the findings are crucial for the development of targeted public health interventions to reduce poisoning mortality and the socioeconomic inequalities related to it.
Keywords: Alcohol poisoning; Mortality; Opioid poisoning; Racial and ethnic inequalities; Socioeconomic inequalities.
© 2022. The Author(s).
Conflict of interest statement
The authors declare that they have no competing interests.
Figures
References
-
- Heron M. Deaths: leading causes for 2019. Natl Vital Stat Rep. 2021;70(9):1–114. - PubMed
-
- Centers for Disease Control and Prevention (CDC) Overdose death rates involving opioids, by type, United States, 1999-2019. 2021.
-
- National Institute on Drug Abuse (NIDA) Overdose Death Rates. 2020.
Publication types
MeSH terms
Substances
Grants and funding
LinkOut - more resources
Full Text Sources
