. 2022 Oct 24;20(1):240.
doi: 10.1186/s12915-022-01437-6.

CCHCR1-astrin interaction promotes centriole duplication through recruitment of CEP72

Affiliations

CCHCR1-astrin interaction promotes centriole duplication through recruitment of CEP72

Zhenguang Ying et al. BMC Biol. .

Abstract

Background: The centrosome is one of the most important non-membranous organelles regulating microtubule organization and progression of cell mitosis. The coiled-coil alpha-helical rod protein 1 (CCHCR1, also known as HCR) gene is considered to be a psoriasis susceptibility gene, and the protein is suggested to be localized to the P-bodies and centrosomes in mammalian cells. However, the exact cellular function of HCR and its potential regulatory role in the centrosomes remain unexplored.

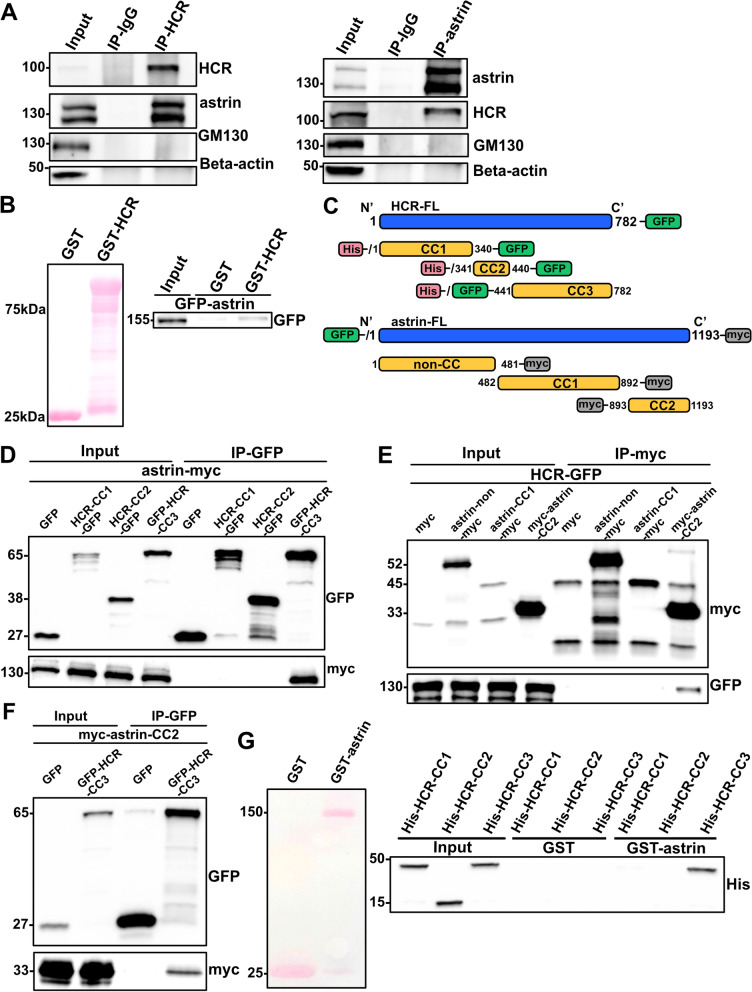
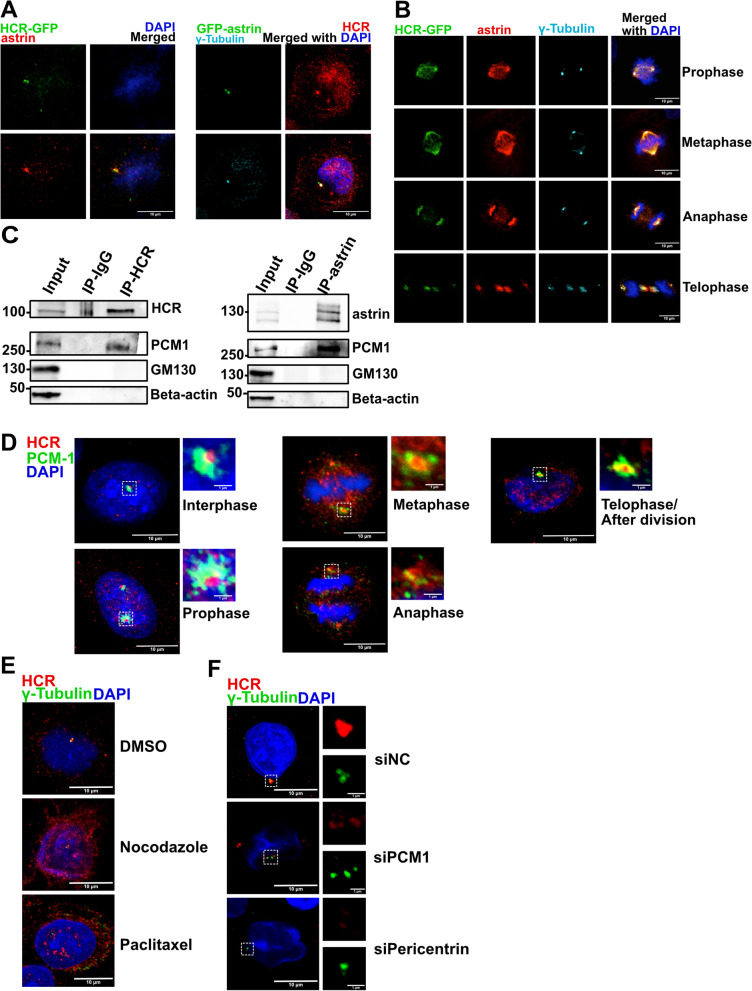
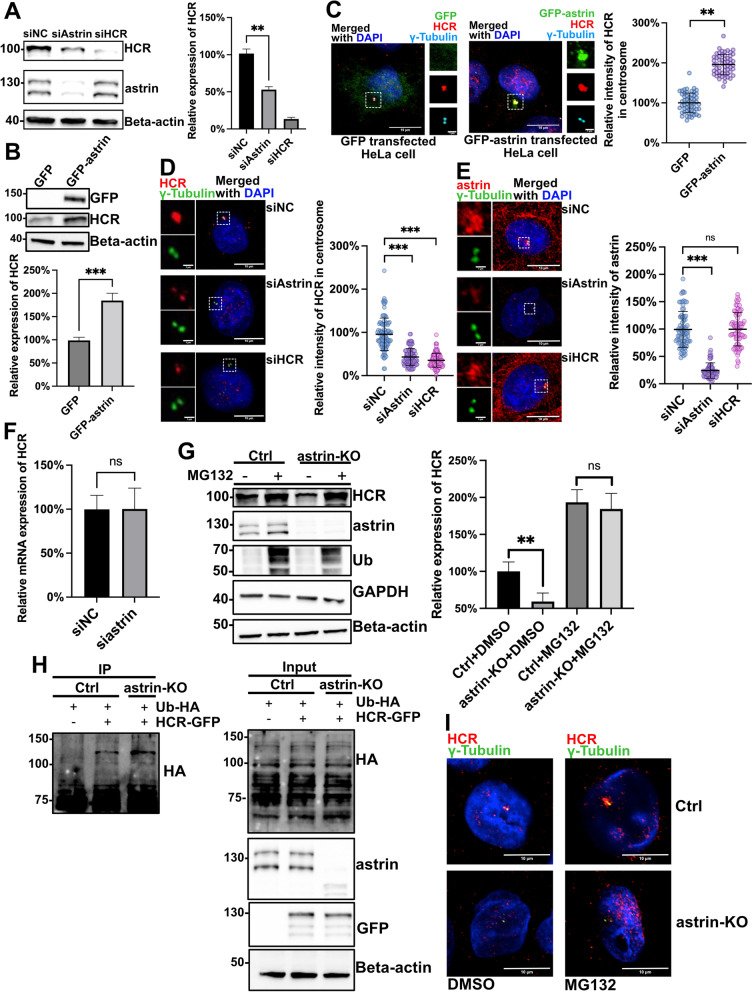
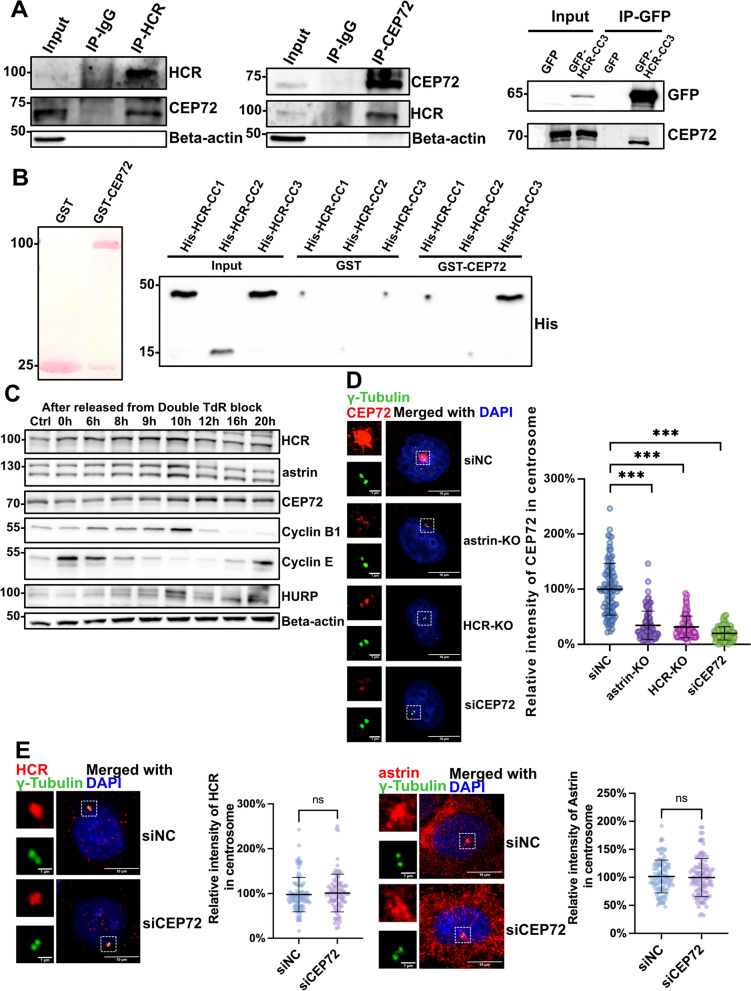
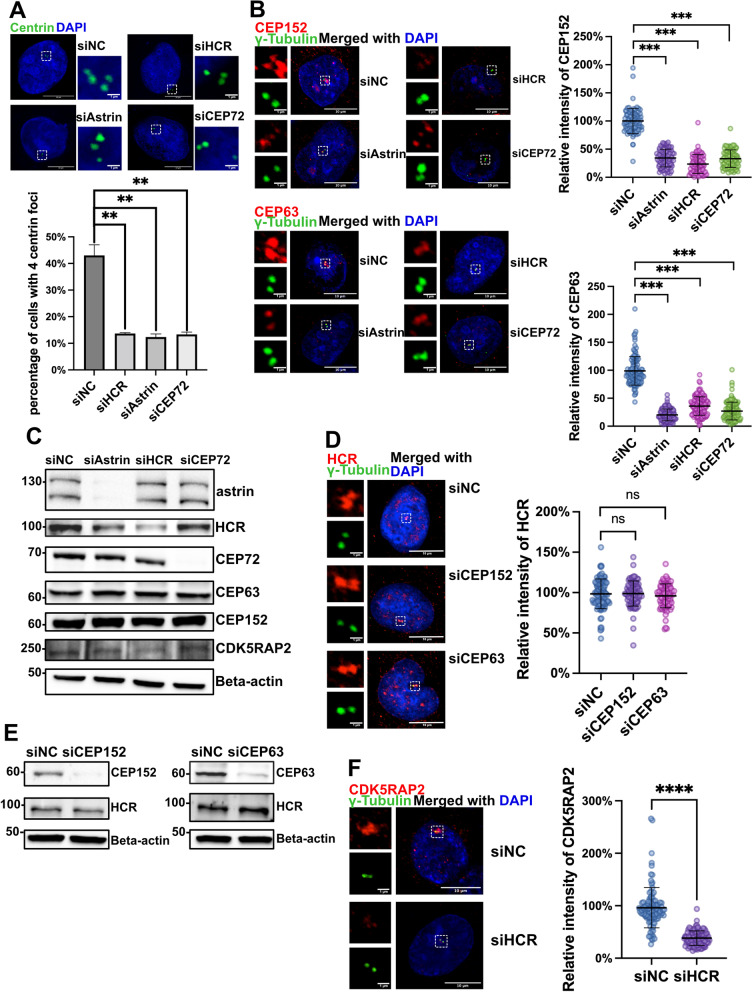
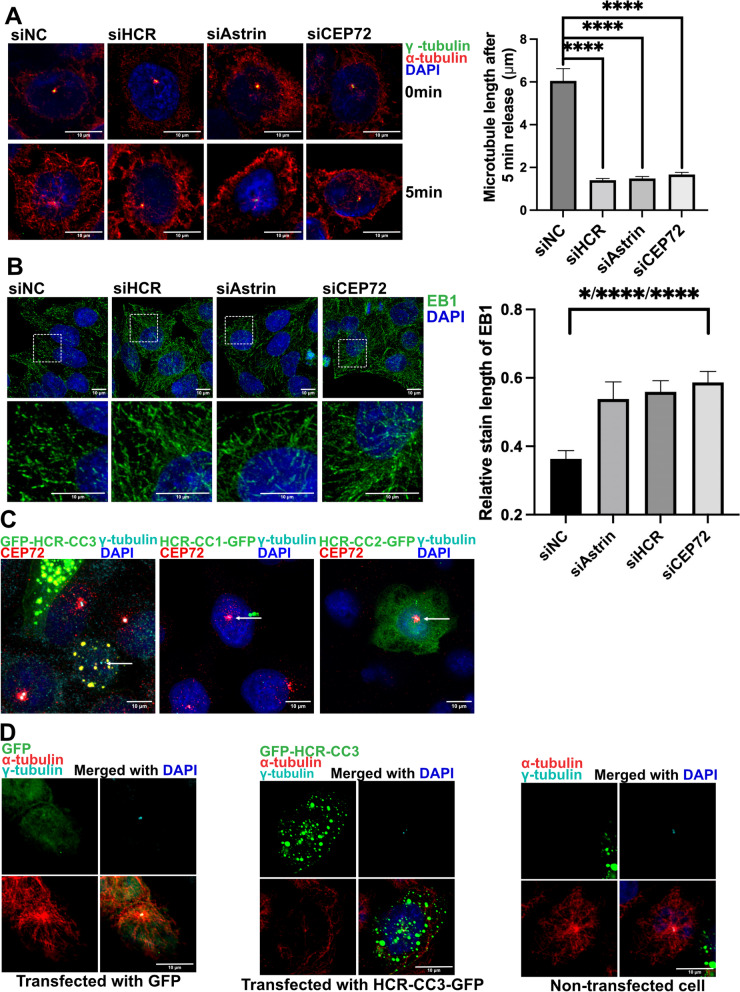
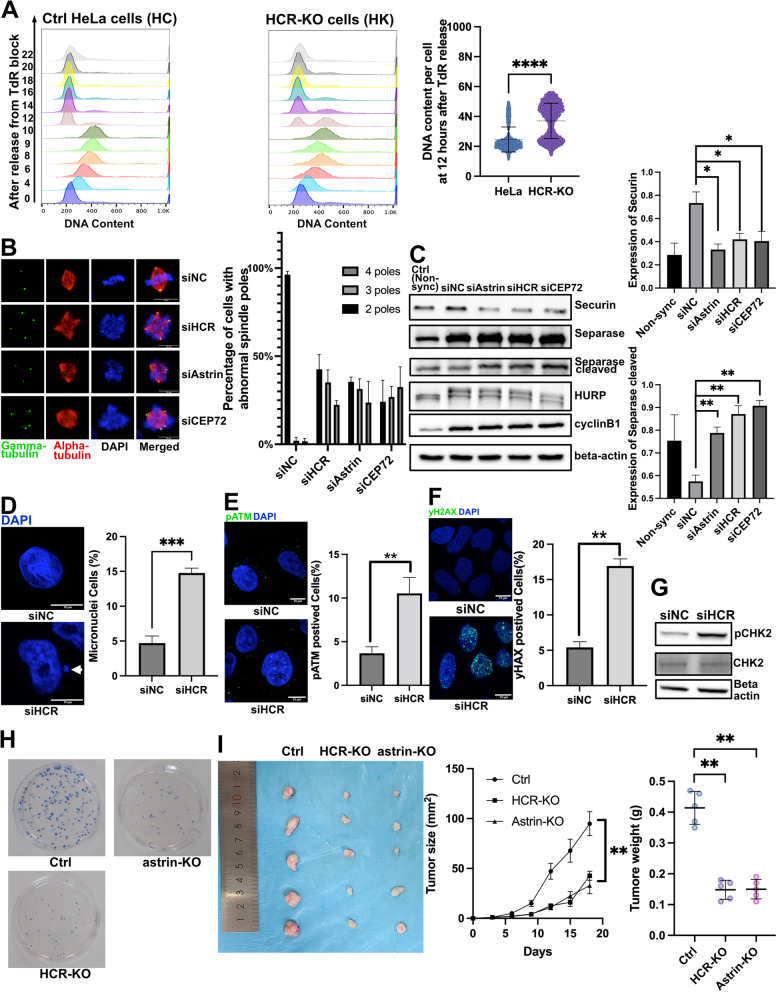
Results: We found that HCR interacts directly with astrin, a key factor in centrosome maturation and mitosis. Immunoprecipitation assays showed that the coiled-coil region present in the C-terminus of HCR and astrin respectively mediated the interaction between them. Astrin not only recruits HCR to the centrosome, but also protects HCR from ubiquitin-proteasome-mediated degradation. In addition, depletion of either HCR or astrin significantly reduced centrosome localization of CEP72 and subsequent MCPH proteins, including CEP152, CDK5RAP2, and CEP63. The absence of HCR also caused centriole duplication defects and mitotic errors, resulting in multipolar spindle formation, genomic instability, and DNA damage.

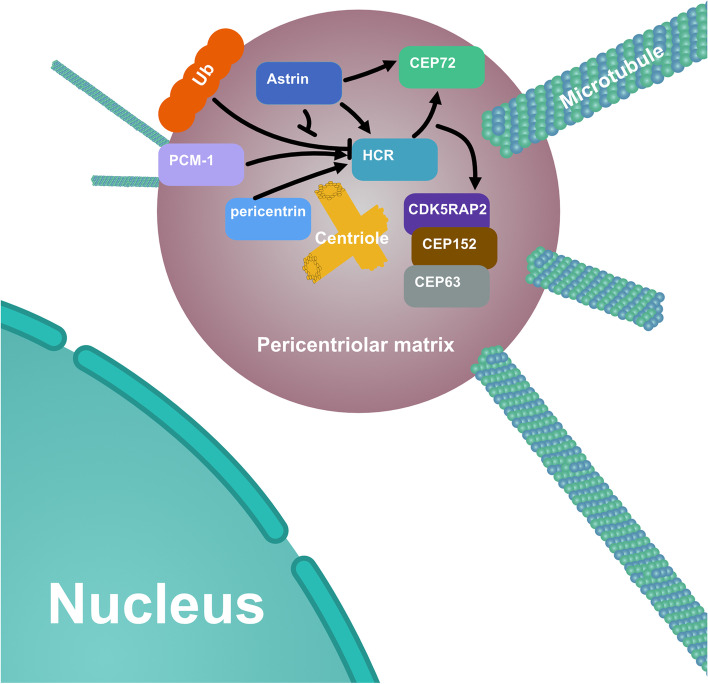
Conclusion: We conclude that HCR is localized and stabilized at the centrosome by directly binding to astrin. HCR are required for the centrosomal recruitment of MCPH proteins and centriolar duplication. Both HCR and astrin play key roles in keeping normal microtubule assembly and maintaining genomic stability.

Keywords: Astrin; CCHCR1; CEP72; Centrosome; Microtubule organization; Mitosis.


Conflict of interest statement

The authors declare that they have no competing interests.

Figures

Fig. 1
Fig. 1
Direct interaction of HCR with astrin. A Reciprocal co-immunoprecipitation analysis of HCR binding to astrin. HeLa cell lysates were immunoprecipitated with astrin, HCR, or control rabbit IgG antibodies and analyzed by western blotting with anti-astrin and anti-HCR antibodies. Anti-GM130 and anti-beta actin antibodies were used as negative controls. B GST pull-down assay of the interaction between astrin and GST-tagged HCR. Total lysates of HeLa cells expressing GFP-astrin were incubated with GST alone or GST-HCR purified from bacterial cells. Precipitates were detected with an anti-GFP antibody. C Schematic models of the deletion mutants of HCR and astrin. D Co-immunoprecipitation analysis of the astrin-binding domain on HCR. GFP vector alone or each HCR-GFP fragment were co-transfected with myc-astrin into HeLa cells, and then, lysates were immunoprecipitated with an anti-myc antibody and analyzed by anti-myc and anti-GFP antibodies. E Co-immunoprecipitation analysis of the HCR-binding domain on astrin. PCMV-myc empty vector or each myc-astrin fragment was co-transfected with HCR-GFP into HeLa cells, and then, lysates were immunoprecipitated with an anti-myc antibody and analyzed by anti-GFP and anti-myc antibodies. F Co-immunoprecipitation analysis of the interactive domains between HCR and astrin. GFP vector alone or GFP-HCR-CC3 fragment was co-transfected with myc-astrin-CC2 into HeLa cells, and then, lysates were immunoprecipitated with an anti-myc antibody and analyzed by anti-GFP or anti-myc antibodies. G In vitro analysis of the domain in HCR required for interacting with astrin. GST-tagged astrin and His-tagged HCR fragments were purified from E. coli strain BL21(DE3), and a pull-down assay was performed to examine the astrin-binding domain in HCR
Fig. 2
Fig. 2
HCR co-localizes with astrin at the centrosome and mitotic spindle. A HeLa cells stably expressing HCR-GFP (green) were stained with an astrin antibody (red) and DAPI (blue) followed by confocal microscopy analysis (left panel); HeLa cells transfected with GFP-astrin (green) were stained with HCR (red) and gamma-tubulin (cyan) antibodies and DAPI (blue) for nuclear staining (right panel); scale bars, 10 μm. B Mitotic HeLa cells stably transfected with HCR-GFP (green) were stained with astrin (red), gamma-tubulin (cyan), and DAPI (blue); scale bars, 10 μm. C HeLa cell lysates were immunoprecipitated with control rabbit IgG or anti-HCR and detected by immunoblotting for HCR and PCM1. Beta-actin was used as a negative control (left panel) or immunoprecipitated with astrin and analyzed by western blotting for astrin and PCM1. Beta-actin was used as negative control (right panel). D HeLa cells were synchronized and stained with PCM1 (green), HCR (red), and DAPI (blue); scale bars, 10 μm; inset scale bars, 1 μm. E HeLa cells were treated with DMSO, 2 μg/ml nocodazole, or 1 μM paclitaxel and then stained with anti-HCR (red), anti-gamma-tubulin (green), and DAPI (blue); scale bars, 10 μm. F HeLa cells were transfected with the indicated siRNA and then immunostained for HCR (red) and gamma-tubulin (green). The nucleus was stained with DAPI (blue); scale bars, 10 μm; inset scale bars, 1 μm
Fig. 3
Fig. 3
Astrin protects HCR from ubiquitination and ensures the centrosome localization of HCR. A Negative control, astrin, and HCR siRNA-treated HeLa cells were analyzed by western blotting with antibodies against HCR, astrin, and beta-actin. The relative abundance of HCR protein was normalized to beta-actin and statistically analyzed. Error bars represent the mean ± SD of three independently performed experiments (n = 3); **P < 0.01 and ***P < 0.001 (Student’s t test). The individual data values were provided in Additional file 6: Raw Data. B HeLa cells transfected with GFP alone or GFP-astrin were immunoblotted for GFP, HCR, and beta-actin. The relative protein levels of HCR were statistically analyzed across three independent experiments (n = 3). Error bars represent the mean ± SD; ***P < 0.001 (Student’s t test). The individual data values were provided in Additional file 6: Raw Data. C GFP alone or GFP-astrin-transfected HeLa cells were subjected to immunostaining with HCR (red), gamma-tubulin (cyan), and DAPI (blue); scale bars, 10 μm; inset scale bars, 1 μm. The relative intensity of HCR in the centrosome was normalized to gamma-tubulin and statistically analyzed. Error bars represent the mean ± SD; **P < 0.01 (Student’s t test). D Negative control, astrin, or HCR siRNA-treated HeLa cells were co-stained with HCR (red), gamma-tubulin (green), and DAPI (blue); scale bars, 10 μm; inset scale bars, 1 μm. The relative intensity of HCR in the centrosome was normalized to gamma-tubulin and statistically analyzed. One hundred cells (n = 100) per group were counted for each condition from three independent experiments. Error bars represent the mean ± SD; ***P < 0.001 (Student’s t test). E Negative control, astrin, and HCR siRNA-treated HeLa cells were co-stained with astrin (red), gamma-tubulin (green), and DAPI (blue); scale bars, 10 μm; inset scale bars, 1 μm. The relative intensity of HCR in the centrosome was normalized by gamma-tubulin and statistically analyzed. One hundred cells (n = 100) per group were counted for each condition from three independent experiments. Error bars represent the mean ± SD; ***P < 0.001; ns, no significance (Student’s t test). F Real-time PCR analysis of HCR mRNA levels in control and astrin siRNA-transfected HeLa cells. For statistical analysis, HCR mRNA levels were normalized to GAPDH; n = 4; ns, no significance (Student’s t test). The individual data values were provided in Additional file 6: Raw Data. G Parental and astrin-KO HeLa cells were treated with MG132 or DMSO for 16 h to suppress the ubiquitin-proteasome pathway. The lysates of each group were analyzed by immunoblotting with antibodies to HCR, astrin, ubiquitin, GAPDH, and beta-actin. For quantitative analysis, the level of HCR of each group was normalized to beta-actin. Error bars represent the mean ± SD of three independently performed experiments (n = 3); **P < 0.01; ns, no significance (Student’s t test). The individual data values were provided in Additional file 6: Raw Data. H mCherry empty vector or HCR-mCherry plasmid in conjunction with ubiquitin-HA was transfected into parental or astrin-KO HeLa cells for immunoprecipitation. The precipitates were analyzed by western blot with the indicated antibodies. I DMSO- or MG132-treated parental HeLa cells and astrin-KO HeLa cells were co-stained with HCR (red), gamma-tubulin (green), and DAPI (blue); scale bars, 10 μm
Fig. 4
Fig. 4
HCR directly binds to and ensures the centrosomal localization of CEP72. A Co-immunoprecipitation analysis of HCR binding to CEP72. HeLa cell lysates were immunoprecipitated with CEP72, HCR, or control rabbit IgG antibodies and analyzed by western blotting with anti-CEP72 and anti-HCR antibodies. Beta-actin was used as a negative control (left penal). GFP alone or GFP-HCR-CC3 plasmid was transfected into HeLa cells and immunoprecipitated using an GFP antibody. The precipitates were detected by immunoblotting with antibodies to GFP and CEP72 (right panel). B In vitro binding assay of HCR coiled-coil domains with CEP72. GST alone, GST-tagged CEP72, and His-tagged HCR fragments were purified from E. coli strain BL21(DE3), and a pull-down assay was performed to examine the CEP72-binding domain in HCR. C HeLa cells released from double-thymidine arrest were harvested at each time point and were analyzed by immunoblotting with antibodies against HCR, astrin, CEP72, cyclin B1, cyclin E, HURP, and beta-actin. D Negative control, CEP72 siRNA-treated HeLa cells, astrin-KO cells, and HCR-KO cells were co-stained with CEP72 (red), gamma-tubulin (green), and DAPI (blue); scale bars,10 μm; inset scale bars, 1 μm. For quantitative analysis, the intensity of CEP72 at the centrosome was normalized by gamma-tubulin. One hundred cells (n = 100) per group were counted from three independent experiments. Error bars represent the mean ± SD. ***P < 0.001 (Student’s t test). E Negative control or CEP72 siRNA-treated HeLa cells were co-stained with HCR (red) and gamma-tubulin (green) antibodies and DAPI (blue) for nuclear staining (upper panel) or co-stained with astrin (red) and gamma-tubulin (green) antibodies and DAPI (blue) for nuclear staining (lower panel). For quantitative analysis, the intensity of HCR (upper panel) or astrin (lower panel) at the centrosome was normalized to gamma-tubulin. One hundred cells (n = 100) per group were counted from three independent experiments. Each bar represents the mean ± SD (upper panel); ns, no significance (Student’s t test); scale bars, 10 μm; inset scale bars, 1 μm
Fig. 5
Fig. 5
HCR promotes centriole duplication by recruiting MCPH proteins to the centrosome. A Negative control, astrin, HCR, and CEP72 siRNA-treated HeLa cells were co-stained with centrin-1 (green) and DAPI (blue). For quantitative analysis, the number of centrioles in each cell was counted for a total of 100 cells from three independent experiments. Error bars represent the mean ± SD; **P < 0.01 (Student’s t test); scale bars, 10 μm. B Negative control, astrin, HCR, and CEP72 siRNA-treated HeLa cells were co-stained with anti-CEP152 (red), anti-gamma-tubulin (green), and DAPI (blue) for nuclear staining (upper panel) or co-stained with anti-CEP63 (red), anti-gamma-tubulin (green), and DAPI (blue) for nuclear staining (lower panel). For quantitative analysis, the intensity of CEP152 or CEP63 at the centrosome was normalized to gamma-tubulin. Cells (n = 100 per group) were counted from three independent experiments. Error bars represent the mean ± SD; ***P < 0.001 (Student’s t test); scale bars,10 μm; inset scale bars, 1 μm. C Negative control, astrin, HCR, and CEP72 siRNA-treated HeLa cells were analyzed by immunoblotting with antibodies against astrin, HCR, CEP72, CEP152, CEP163, CDK5RAP2, and beta-actin. D Negative control, CEP152, and CEP63 siRNA-treated HeLa cells were co-stained with HCR (red), gamma-tubulin (green), and DAPI (blue). For quantitative analysis, the intensity of HCR at the centrosome was normalized by gamma-tubulin. Cells (n = 100 per group) were counted from three independent experiments. Error bars represent the mean ± SD; ns, no significance (Student’s t test); scale bars, 10 μm; inset scale bars, 1 μm. E Negative control, CEP152, and CEP63 siRNA-treated HeLa cells were analyzed by western blotting using antibodies against astrin, HCR, CEP72, and beta-actin. F Negative control and HCR siRNA-treated HeLa cells were co-stained with CDK5RAP2 (red), gamma-tubulin (green), and DAPI (blue) for immunofluorescence detection. For quantitative analysis, the intensity of CDK5RAP2 at the centrosome was normalized to gamma-tubulin. scale bars, 10 μm; inset scale bars, 1 μm. Cells (n = 100 per group) were counted from three independent experiments. Error bars represent the mean ± SD; ***P < 0.001 (Student’s t test)
Fig. 6
Fig. 6
HCR regulates microtubule organization by recruiting CEP72 to the centrosome. A Microtubule regrowth assay of negative control, astrin, HCR, and CEP72 siRNA-treated HeLa cells co-stained with gamma-tubulin (green), alpha-tubulin (red), and DAPI (blue). The quantified analysis was based on alpha-tubulin staining length. Error bars represent the mean ± SD of cells (n = 100 per group) from three independently performed experiments; ****P < 0.0001 (Student’s t test); scale bars, 10 μm. B Negative control, astrin, HCR, and CEP72 siRNA-treated HeLa cells were co-stained with EB1 (green) and DAPI (blue) for immunofluorescence detection. Quantitative analysis was based on the staining length of EB1. Error bars represent the mean ± SD of cells (n = 100 each group) from three independently performed experiments. ****P < 0.0001 (Student’s t test); scale bars, 10 μm. C GFP-tagged HCR deletion fragments (green) were transfected into HeLa cells and co-stained with CEP72 (red) and DAPI (blue). Arrows represent the area of the centrosome; scale bars, 10 μm. D Microtubule regrowth assay of vector- or HCR-3-GFP-transfected HeLa cells co-stained with alpha-tubulin (red), gamma-tubulin (cyan), and DAPI (blue); scale bars indicate 10 μm
Fig. 7
Fig. 7
HCR depletion causes mitotic defects, DNA damage, and decreased tumor proliferation. A After releasing from double-thymidine arrest for the indicated time, parental HeLa cells and HCR-KO HeLa cells were fixed and stained with PI (DNA staining) for flow cytometry. The DNA content in cells is diploid (2N) in the G1 phase and becomes tetraploid (4N) from S to G2/M phase. When mitosis ends, the DNA content in the cell should revert from 4N to 2N. The cell cycle results were analyzed and plotted based on the DNA content in cells. A total of 10,000 cells were counted per group. B Negative control, astrin, HCR, and CEP72 siRNA-treated HeLa cells were treated with 100 ng/ml nocodazole for 16 h to be arrested in M phase and co-stained with gamma-tubulin (green), alpha-tubulin (red), and DAPI (blue). Cells (n = 100 each group) were counted from three independent experiments. Error bars represent the mean ± SD; *P < 0.05 (Student’s t test). C Negative control, astrin, HCR, and CEP72 siRNA-treated HeLa cells were treated with 100 ng/ml nocodazole for 16 h to be arrested in M phase and were analyzed by immunoblotting with antibodies to securin, separase, HURP, cyclin B1, and beta-actin, and the relative protein levels of securin and cleaved separase were analyzed statistically. Error bars represent the mean ± SD of three independently performed experiments (n = 3); *P < 0.05 and **P < 0.01 (Student’s t test). The individual data values were provided in Additional file 6: Raw Data. D Negative control and HCR siRNA-treated HeLa cells were stained with DAPI (blue). The quantified analysis was based on the percentage of the cells containing micronucleus. Cells (n = 100) were counted from three independent experiments. Each bar represents the mean ± SD; ***P < 0.001 (Student’s t test). Arrow represents the micronuclei. E Negative control and HCR siRNA-treated HeLa cells were co-stained with pATM (green) and DAPI (blue). The quantified analysis was based on the percentage of pATM-positive cells. Cells (n = 100 each group) were counted from three independent experiments. Error bar represents the mean ± SD; **P < 0.01 (Student’s t test). F Negative control and HCR siRNA-treated HeLa cells were co-stained with gamma-H2AX (green) and DAPI (blue). The quantified analysis was based on the percentage of gamma-H2AX-positive cells. Cells (n = 100 each group) were counted from three independent experiments. Error bar represents the mean ± SD; **P < 0.01 (Student’s t test). G Negative control and HCR siRNA-treated HeLa cells were analyzed by immunoblotting with antibodies to pCHK2, CHK2, and beta-actin. H Colony formation assays of parental HeLa cells, HCR-KO cells, and astrin-KO cells. I Parental HeLa cells, HCR-KO cells, and astrin-KO cells (1 × 10⁶) were transplanted in the athymic mice, and tumor sizes were measured every 3 days after the formation of a measurable tumor. Error bars represent the mean ± SD for different animal measurements (n = 5 each group); P < 0.01, one-way ANOVA for tumor weight analysis and two-way ANOVA for tumor size analysis. The individual data values were provided in Additional file 6: Raw Data
Fig. 8
Fig. 8
Localization and regulatory relationship of HCR and its related proteins on centrosomes. HCR delivery to centrosome requires PCM1, pericentrin, and astrin. HCR is protected by astrin from ubiquitination and recruits CEP72 and MCPH proteins to the centrosome

Similar articles

Cited by

References

    1. Desai A, Mitchison TJ. Microtubule polymerization dynamics. Annu Rev Cell Dev Biol. 1997;13:83–117. - PubMed
    1. Hixon ML, Gualberto A. The control of mitosis. Front Biosci. 2000;5:D50–D57. - PubMed
    1. Musacchio A, Hardwick KG. The spindle checkpoint: structural insights into dynamic signalling. Nat Rev Mol Cell Biol. 2002;3:731–741. - PubMed
    1. Nunes V, Ferreira JG. From the cytoskeleton to the nucleus: an integrated view on early spindle assembly. Semin Cell Dev Biol. 2021. 10.1016/j.semcdb.2021.03.006. - PubMed
    1. Kubo A, Sasaki H, Yuba-Kubo A, Tsukita S, Shiina N. Centriolar satellites: molecular characterization, Atp-dependent movement toward centrioles and possible involvement in ciliogenesis. J Cell Biol. 1999;147:969–980. - PMC - PubMed

Publication types