

Low-abundance populations distinguish microbiome performance in plant cell wall deconstruction
- PMID: 36280858
- PMCID: PMC9594917
- DOI: 10.1186/s40168-022-01377-x
Low-abundance populations distinguish microbiome performance in plant cell wall deconstruction
Abstract
Background: Plant cell walls are interwoven structures recalcitrant to degradation. Native and adapted microbiomes can be particularly effective at plant cell wall deconstruction. Although most understanding of biological cell wall deconstruction has been obtained from isolates, cultivated microbiomes that break down cell walls have emerged as new sources for biotechnologically relevant microbes and enzymes. These microbiomes provide a unique resource to identify key interacting functional microbial groups and to guide the design of specialized synthetic microbial communities.
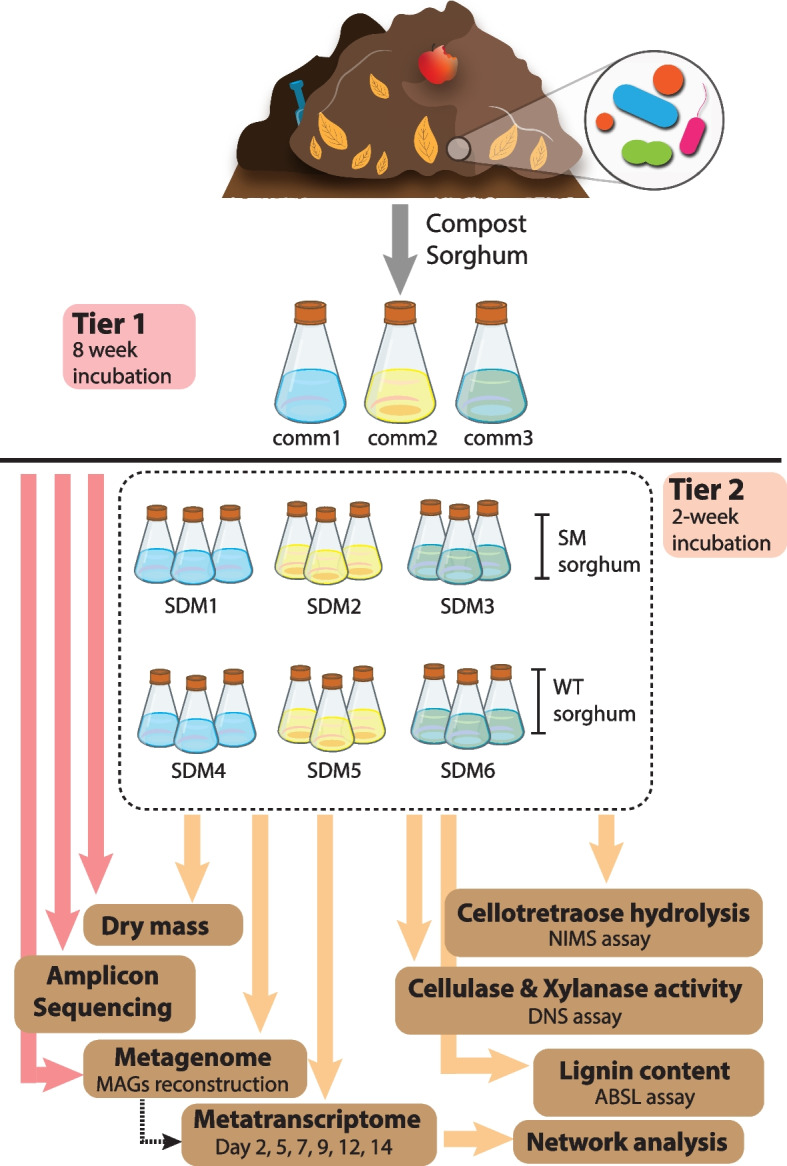
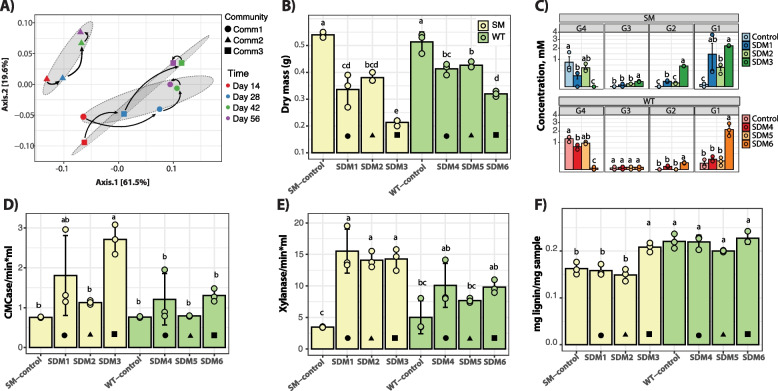
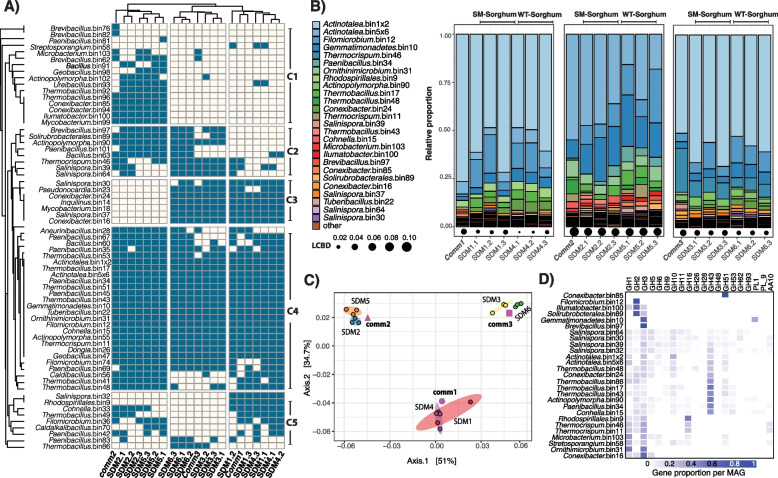
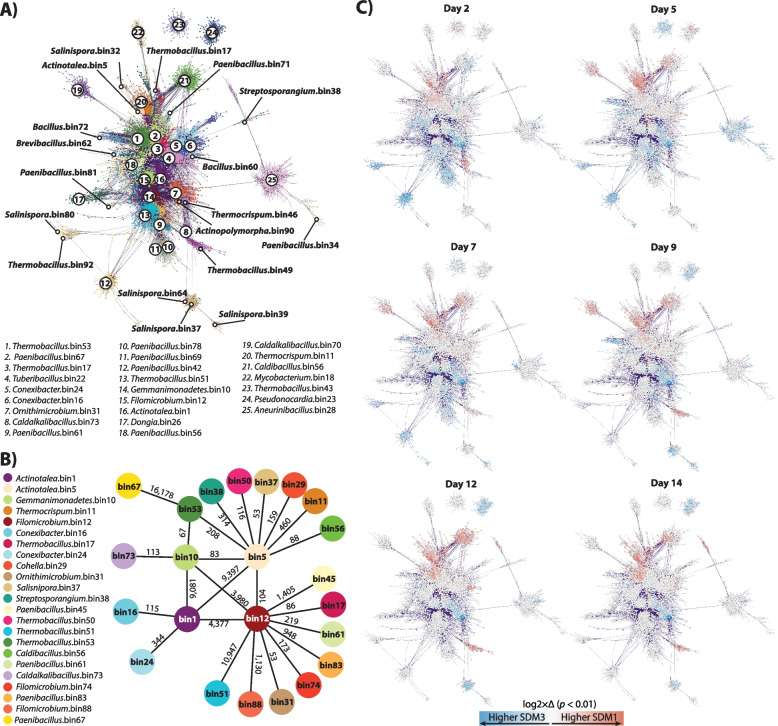
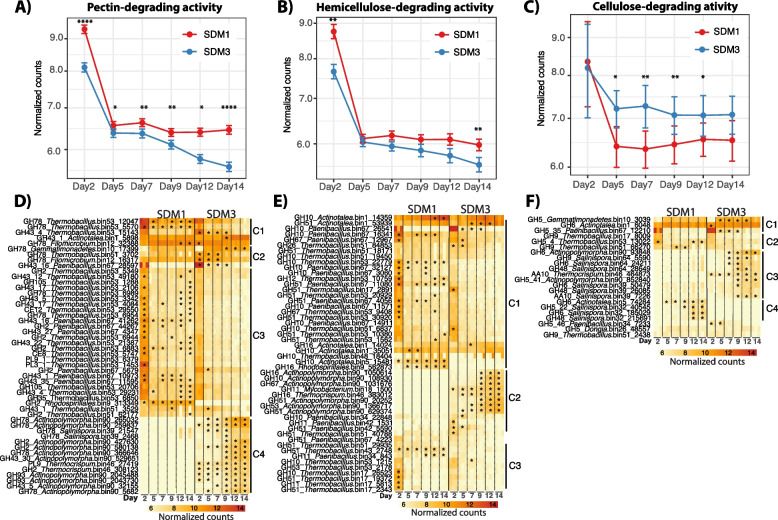
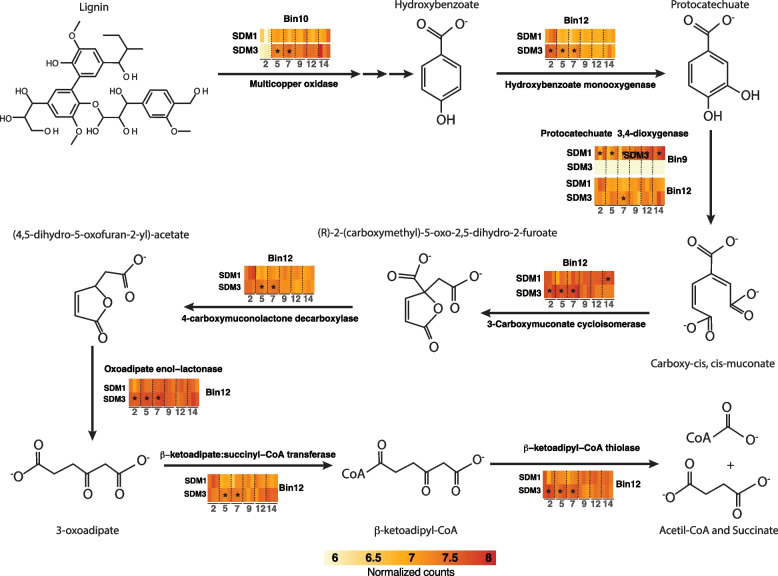
Results: To establish a system assessing comparative microbiome performance, parallel microbiomes were cultivated on sorghum (Sorghum bicolor L. Moench) from compost inocula. Biomass loss and biochemical assays indicated that these microbiomes diverged in their ability to deconstruct biomass. Network reconstructions from gene expression dynamics identified key groups and potential interactions within the adapted sorghum-degrading communities, including Actinotalea, Filomicrobium, and Gemmatimonadetes populations. Functional analysis demonstrated that the microbiomes proceeded through successive stages that are linked to enzymes that deconstruct plant cell wall polymers. The combination of network and functional analysis highlighted the importance of cellulose-degrading Actinobacteria in differentiating the performance of these microbiomes.
Conclusions: The two-tier cultivation of compost-derived microbiomes on sorghum led to the establishment of microbiomes for which community structure and performance could be assessed. The work reinforces the observation that subtle differences in community composition and the genomic content of strains may lead to significant differences in community performance. Video Abstract.
Keywords: Biomass deconstruction; Lignocellulose degradation; Microbiome; Transcriptomic network.
© 2022. The Author(s).
Conflict of interest statement
The authors declare that they have no competing interests.
Figures
Similar articles
-
Neotropical termite microbiomes as sources of novel plant cell wall degrading enzymes.Sci Rep. 2020 Mar 2;10(1):3864. doi: 10.1038/s41598-020-60850-5. Sci Rep. 2020. PMID: 32123275 Free PMC article.
-
Plant developmental stage drives the differentiation in ecological role of the maize microbiome.Microbiome. 2021 Aug 13;9(1):171. doi: 10.1186/s40168-021-01118-6. Microbiome. 2021. PMID: 34389047 Free PMC article.
-
Proteogenomic analysis of a thermophilic bacterial consortium adapted to deconstruct switchgrass.PLoS One. 2013 Jul 19;8(7):e68465. doi: 10.1371/journal.pone.0068465. Print 2013. PLoS One. 2013. PMID: 23894306 Free PMC article.
-
Nature's recyclers: anaerobic microbial communities drive crude biomass deconstruction.Curr Opin Biotechnol. 2020 Apr;62:38-47. doi: 10.1016/j.copbio.2019.08.015. Epub 2019 Oct 5. Curr Opin Biotechnol. 2020. PMID: 31593910 Review.
-
Plant biomass degradation by gut microbiomes: more of the same or something new?Curr Opin Biotechnol. 2009 Jun;20(3):358-63. doi: 10.1016/j.copbio.2009.05.004. Epub 2009 Jun 8. Curr Opin Biotechnol. 2009. PMID: 19515552 Review.
Cited by
-
The Undeniable Potential of Thermophiles in Industrial Processes.Int J Mol Sci. 2024 Jul 13;25(14):7685. doi: 10.3390/ijms25147685. Int J Mol Sci. 2024. PMID: 39062928 Free PMC article. Review.
-
Seed banking impacts native Acacia ulicifolia seed microbiome composition and function.Environ Microbiome. 2025 Jan 13;20(1):4. doi: 10.1186/s40793-024-00657-3. Environ Microbiome. 2025. PMID: 39800756 Free PMC article.
-
Evaluating agar-plating and dilution-to-extinction isolation methods for generating oak-associated microbial culture collections.ISME Commun. 2025 Feb 11;5(1):ycaf019. doi: 10.1093/ismeco/ycaf019. eCollection 2025 Jan. ISME Commun. 2025. PMID: 40041709 Free PMC article.
-
Thermophilic biocatalysts for one-step conversion of citrus waste into lactic acid.Appl Microbiol Biotechnol. 2024 Jan 20;108(1):155. doi: 10.1007/s00253-023-12904-7. Appl Microbiol Biotechnol. 2024. PMID: 38244047 Free PMC article.
-
Gut microbiome of mealworms (Tenebrio molitor Larvae) show similar responses to polystyrene and corn straw diets.Microbiome. 2023 May 5;11(1):98. doi: 10.1186/s40168-023-01550-w. Microbiome. 2023. PMID: 37147715 Free PMC article.
