

Unraveling the dynamics of the Omicron and Delta variants of the 2019 coronavirus in the presence of vaccination, mask usage, and antiviral treatment
- PMID: 36281307
- PMCID: PMC9581714
- DOI: 10.1016/j.apm.2022.09.017
Unraveling the dynamics of the Omicron and Delta variants of the 2019 coronavirus in the presence of vaccination, mask usage, and antiviral treatment
Abstract
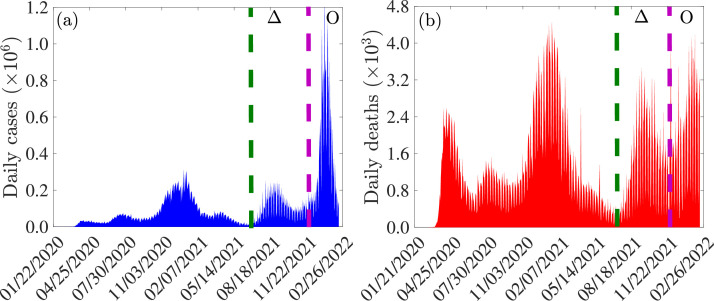
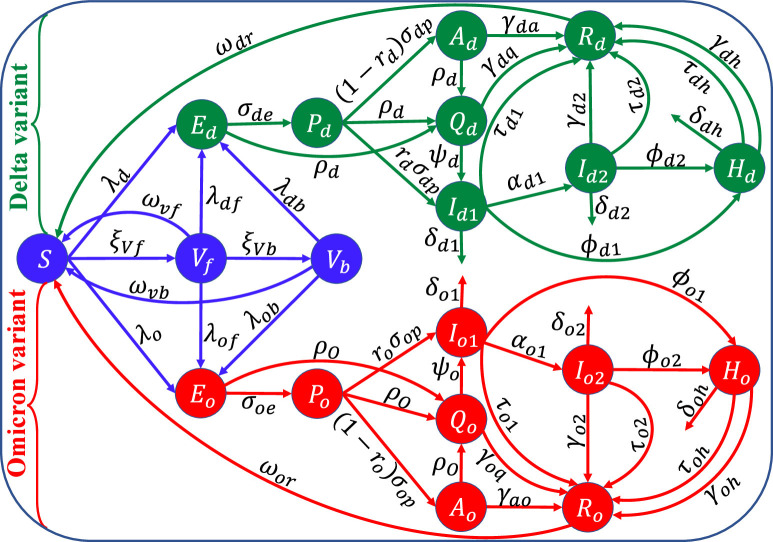
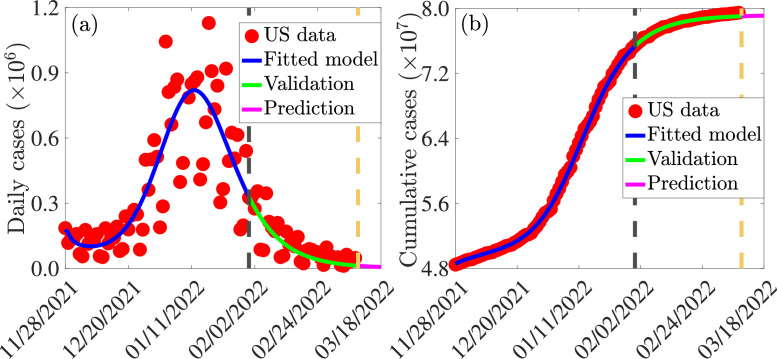
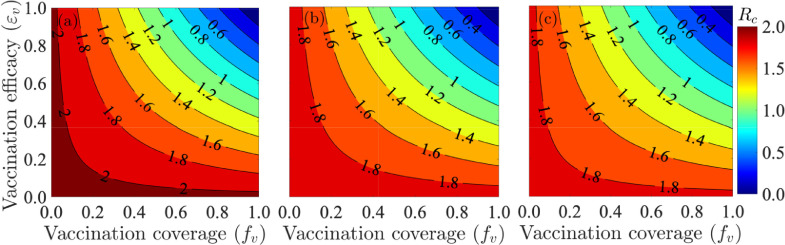
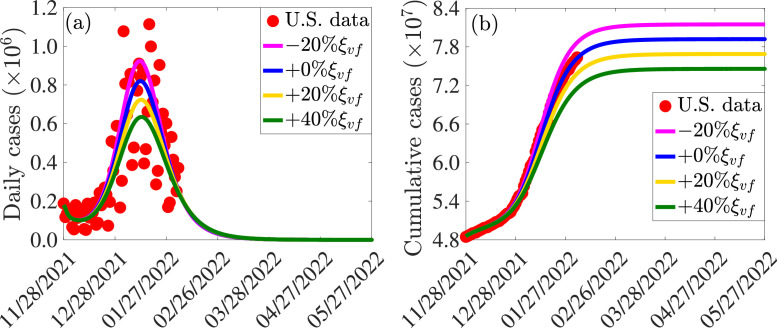
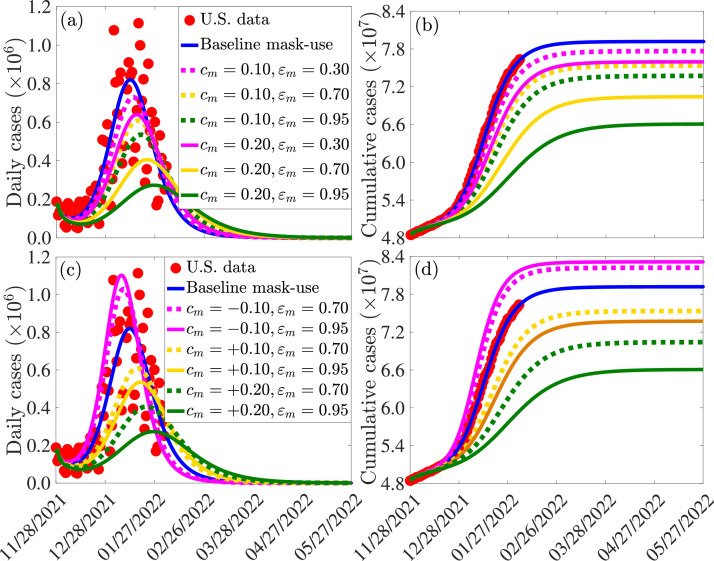
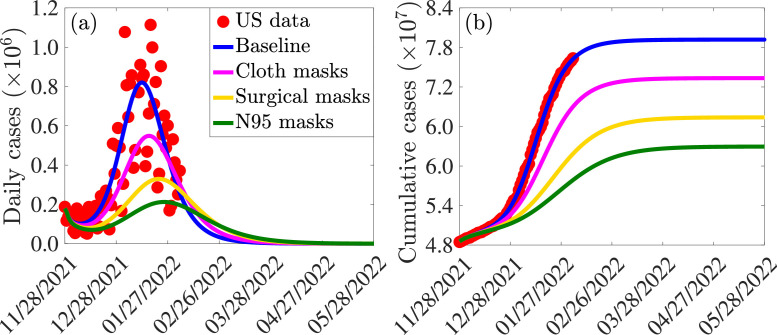
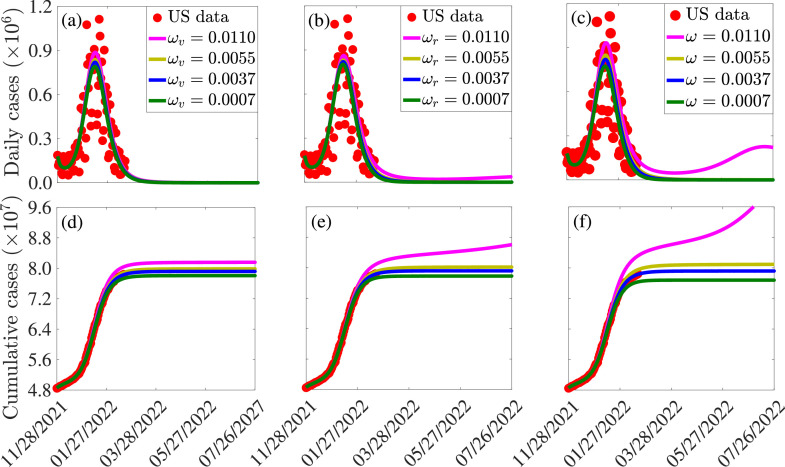
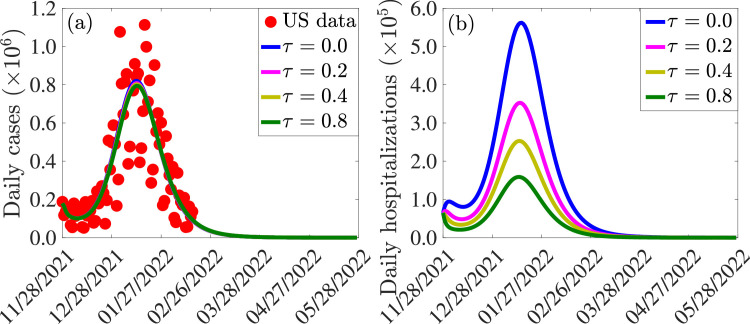
The effectiveness of control interventions against COVID-19 is threatened by the emergence of SARS-CoV-2 variants of concern. We present a mathematical model for studying the transmission dynamics of two of these variants (Delta and Omicron) in the United States, in the presence of vaccination, treatment of individuals with clinical symptoms of the disease and the use of face masks. The model is parameterized and cross-validated using observed daily case data for COVID-19 in the United States for the period from November 2021 (when Omicron first emerged) to March 2022. Rigorous qualitative analysis of the model shows that the disease-free equilibrium of the model is locally-asymptotically stable when the control reproduction number of the model (denoted by ) is less than one. This equilibrium is shown to be globally-asymptotically stable for a special case of the model, where disease-induced mortality is negligible and both vaccine-derived immunity in fully-vaccinated individuals and natural immunity do not wane, when the associated reproduction number is less than one. The epidemiological implication of the latter result is that the combined vaccination-boosting strategy can lead to the elimination of the pandemic if its implementation can bring (and maintain) the associated reproduction number to a value less than one. An analytical expression for the vaccine-derived herd immunity threshold is derived. Using this expression, together with the baseline values of the parameters of the parameterized model, we showed that the vaccine-derived herd immunity can be achieved in the United States (so that the pandemic will be eliminated) if at least of the population is fully-vaccinated with two of the three vaccines approved for use in the United States (Pfizer or Moderna vaccine). Furthermore, this study showed (as of the time of writing in March 2022) that the control reproduction number of the Omicron variant was approximately 3.5 times that of the Delta variant (the reproduction of the latter is computed to be ), indicating that Delta had practically died out and that Omicron has competitively-excluded Delta (to become the predominant variant in the United States). Based on our analysis and parameterization at the time of writing of this paper (March 2022), our study suggests that SARS-CoV-2 elimination is feasible by June 2022 if the current baseline level of the coverage of fully-vaccinated individuals is increased by about . The prospect of pandemic elimination is significantly improved if vaccination is combined with a face mask strategy that prioritizes moderately effective and high-quality masks. Having a high percentage of the populace wearing the moderately-effective surgical mask is more beneficial to the community than having low percentage of the populace wearing the highly-effective N95 masks. We showed that waning natural and vaccine-derived immunity (if considered individually) offer marginal impact on disease burden, except for the case when they wane at a much faster rate (e.g., within three months), in comparison to the baseline (estimated to be within 9 months to a year). Treatment of symptomatic individuals has marginal effect in reducing daily cases of SARS-CoV-2, in comparison to the baseline, but it has significant impact in reducing daily hospitalizations. Furthermore, while treatment significantly reduces daily hospitalizations (and, consequently, deaths), the prospects of COVID-19 elimination in the United States are significantly enhanced if investments in control resources are focused on mask usage and vaccination rather than on treatment.
Keywords: COVID-19; Masks; Reproduction number; Vaccination and antiviral treatment; Vaccine-derived herd immunity; Waning immunity.
© 2022 Elsevier Inc. All rights reserved.
Conflict of interest statement
The author(s) declare no competing interests.
Figures
Similar articles
-
Mathematical assessment of the role of waning and boosting immunity against the BA.1 Omicron variant in the United States.Math Biosci Eng. 2023 Jan;20(1):179-212. doi: 10.3934/mbe.2023009. Epub 2022 Sep 30. Math Biosci Eng. 2023. PMID: 36650762
-
Mathematical assessment of the roles of age heterogeneity and vaccination on the dynamics and control of SARS-CoV-2.Infect Dis Model. 2024 Apr 26;9(3):828-874. doi: 10.1016/j.idm.2024.04.007. eCollection 2024 Sep. Infect Dis Model. 2024. PMID: 38725431 Free PMC article.
-
Toward Achieving a Vaccine-Derived Herd Immunity Threshold for COVID-19 in the U.S.Front Public Health. 2021 Jul 23;9:709369. doi: 10.3389/fpubh.2021.709369. eCollection 2021. Front Public Health. 2021. PMID: 34368071 Free PMC article.
-
Role of previous infection with SARS-CoV-2 in protecting against omicron reinfections and severe complications of COVID-19 compared to pre-omicron variants: a systematic review.BMC Infect Dis. 2023 Jun 26;23(1):432. doi: 10.1186/s12879-023-08328-3. BMC Infect Dis. 2023. PMID: 37365490 Free PMC article.
-
Can a combination of vaccination and face mask wearing contain the COVID-19 pandemic?Microb Biotechnol. 2022 Mar;15(3):721-737. doi: 10.1111/1751-7915.13997. Epub 2021 Dec 28. Microb Biotechnol. 2022. PMID: 34962710 Free PMC article. Review.
Cited by
-
A deterministic compartmental model for the transition between variants in the spread of Covid-19 in Italy.PLoS One. 2023 Nov 14;18(11):e0293416. doi: 10.1371/journal.pone.0293416. eCollection 2023. PLoS One. 2023. PMID: 37963148 Free PMC article.
-
Compartmental Models Driven by Renewal Processes: Survival Analysis and Applications to SVIS Epidemic Models.Sci Rep. 2025 Jan 14;15(1):1943. doi: 10.1038/s41598-024-80166-y. Sci Rep. 2025. PMID: 39809805 Free PMC article.
-
The effect of shortening the quarantine period and lifting the indoor mask mandate on the spread of COVID-19: a mathematical modeling approach.Front Public Health. 2023 Jul 21;11:1166528. doi: 10.3389/fpubh.2023.1166528. eCollection 2023. Front Public Health. 2023. PMID: 37546304 Free PMC article.
-
Risk estimation of lifted mask mandates and emerging variants using mathematical model.Heliyon. 2023 Jun;9(6):e16841. doi: 10.1016/j.heliyon.2023.e16841. Epub 2023 Jun 7. Heliyon. 2023. PMID: 37303548 Free PMC article.
-
Incorporating social determinants of health into transmission modeling of COVID-19 vaccine in the US: a scoping review.Lancet Reg Health Am. 2024 Jun 7;35:100806. doi: 10.1016/j.lana.2024.100806. eCollection 2024 Jul. Lancet Reg Health Am. 2024. PMID: 38948323 Free PMC article.
References
LinkOut - more resources
Full Text Sources
Miscellaneous
