

Identification of Mechanisms by Which Genetic Susceptibility Loci Influence Systemic Sclerosis Risk Using Functional Genomics in Primary T Cells and Monocytes
- PMID: 36281738
- PMCID: PMC10953390
- DOI: 10.1002/art.42396
Identification of Mechanisms by Which Genetic Susceptibility Loci Influence Systemic Sclerosis Risk Using Functional Genomics in Primary T Cells and Monocytes
Abstract
Objective: Systemic sclerosis (SSc) is a complex autoimmune disease with a strong genetic component. However, most of the genes associated with the disease are still unknown because associated variants affect mostly noncoding intergenic elements of the genome. We used functional genomics to translate the genetic findings into a better understanding of the disease.
Methods: Promoter capture Hi-C and RNA-sequencing experiments were performed in CD4+ T cells and CD14+ monocytes from 10 SSc patients and 5 healthy controls to link SSc-associated variants with their target genes, followed by differential expression and differential interaction analyses between cell types.
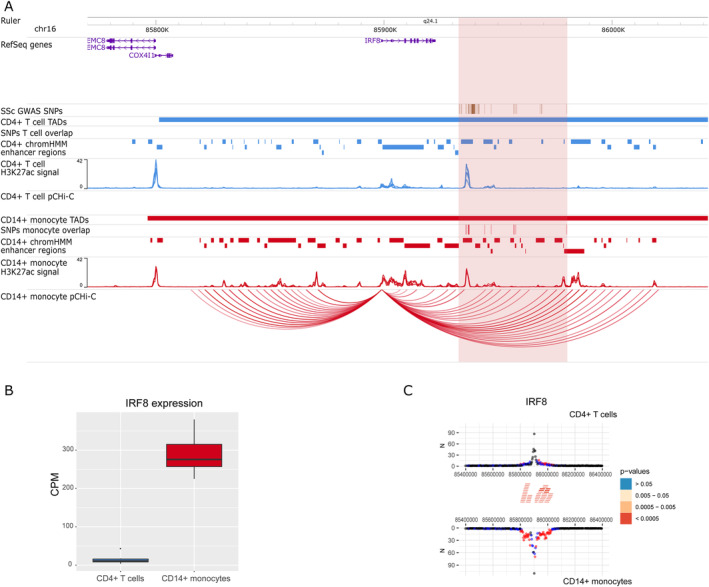
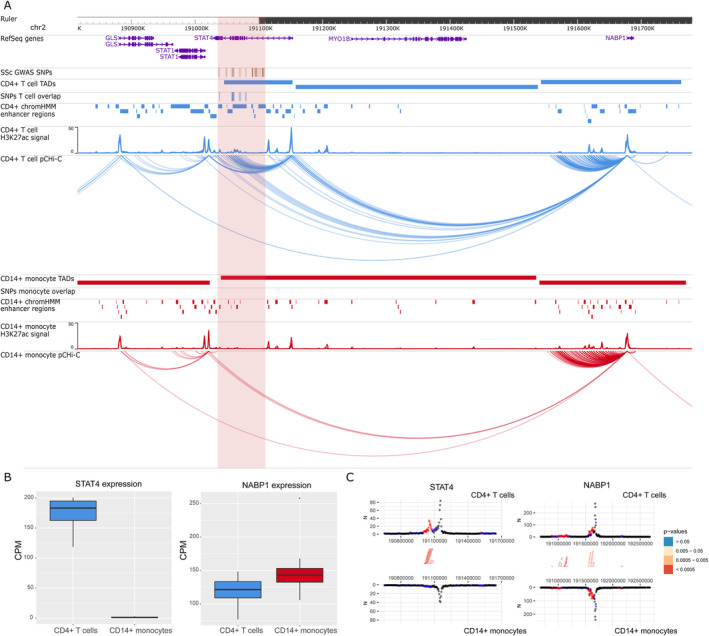
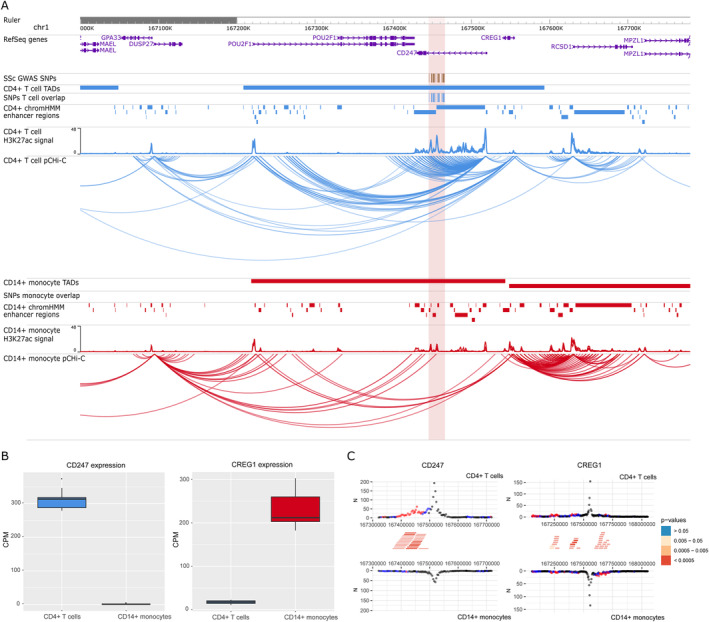
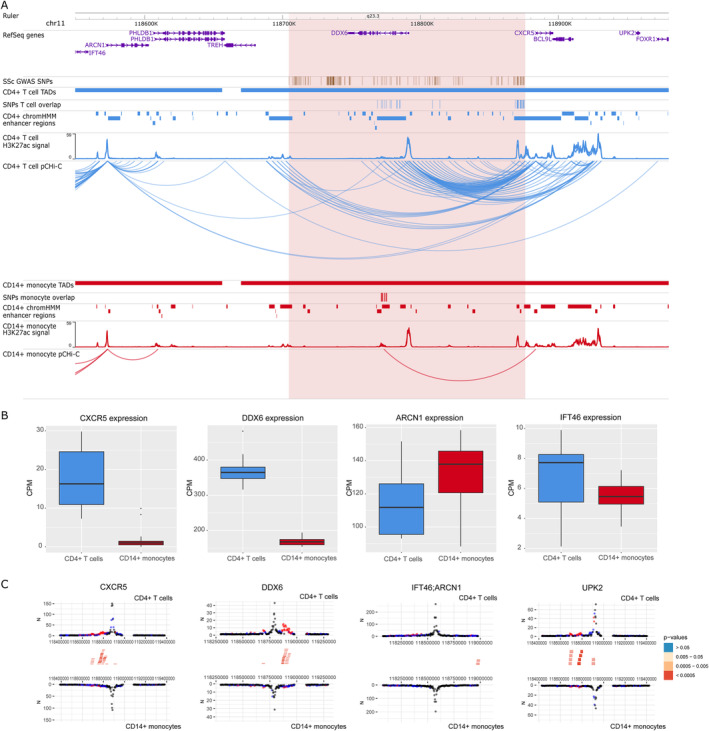
Results: We linked SSc-associated loci to 39 new potential target genes and confirmed 7 previously known SSc-associated genes. We highlight novel causal genes, such as CXCR5, as the most probable candidate gene for the DDX6 locus. Some previously known SSc-associated genes, such as IRF8, STAT4, and CD247, showed cell type-specific interactions. We also identified 15 potential drug targets already in use in other similar immune-mediated diseases that could be repurposed for SSc treatment. Furthermore, we observed that interactions were directly correlated with the expression of important genes implicated in cell type-specific pathways and found evidence that chromatin conformation is associated with genotype.
Conclusion: Our study revealed potential causal genes for SSc-associated loci, some of them acting in a cell type-specific manner, suggesting novel biologic mechanisms that might mediate SSc pathogenesis.
© 2022 The Authors. Arthritis & Rheumatology published by Wiley Periodicals LLC on behalf of American College of Rheumatology.
Figures
Similar articles
-
Broadening our understanding of genetic risk for scleroderma/systemic sclerosis by querying the chromatin architecture surrounding the risk haplotypes.BMC Med Genomics. 2021 Apr 24;14(1):114. doi: 10.1186/s12920-021-00964-5. BMC Med Genomics. 2021. PMID: 33894768 Free PMC article.
-
Epigenomics and transcriptomics of systemic sclerosis CD4+ T cells reveal long-range dysregulation of key inflammatory pathways mediated by disease-associated susceptibility loci.Genome Med. 2020 Sep 25;12(1):81. doi: 10.1186/s13073-020-00779-6. Genome Med. 2020. PMID: 32977850 Free PMC article.
-
Identification of NF-κB and PLCL2 as new susceptibility genes and highlights on a potential role of IRF8 through interferon signature modulation in systemic sclerosis.Arthritis Res Ther. 2015 Mar 21;17(1):71. doi: 10.1186/s13075-015-0572-y. Arthritis Res Ther. 2015. PMID: 25880423 Free PMC article.
-
Immunogenetics of systemic sclerosis: Defining heritability, functional variants and shared-autoimmunity pathways.J Autoimmun. 2015 Nov;64:53-65. doi: 10.1016/j.jaut.2015.07.005. Epub 2015 Jul 23. J Autoimmun. 2015. PMID: 26212856 Review.
-
Systemic sclerosis pathogenesis: contribution of recent advances in genetics.Curr Opin Rheumatol. 2020 Nov;32(6):505-514. doi: 10.1097/BOR.0000000000000735. Curr Opin Rheumatol. 2020. PMID: 32826477 Review.
Cited by
-
Comprehensive analysis of human monocyte subsets using full-spectrum flow cytometry and hierarchical marker clustering.Front Immunol. 2024 Apr 29;15:1405249. doi: 10.3389/fimmu.2024.1405249. eCollection 2024. Front Immunol. 2024. PMID: 38742110 Free PMC article.
-
Immunogenetics of Systemic Sclerosis.Genes (Basel). 2024 May 5;15(5):586. doi: 10.3390/genes15050586. Genes (Basel). 2024. PMID: 38790215 Free PMC article. Review.
-
Multi-omics analysis in primary T cells elucidates mechanisms behind disease-associated genetic loci.Genome Biol. 2025 Feb 10;26(1):26. doi: 10.1186/s13059-025-03492-y. Genome Biol. 2025. PMID: 39930543 Free PMC article.
-
Unraveling an enhancer-silencer regulatory element showing epistatic interaction with a variant that escaped genome-wide association studies.Cell Genom. 2025 Jul 9;5(7):100889. doi: 10.1016/j.xgen.2025.100889. Epub 2025 May 28. Cell Genom. 2025. PMID: 40441141 Free PMC article.
-
Chromosome conformation capture approaches to investigate 3D genome architecture in Ankylosing Spondylitis.Front Genet. 2023 Jan 25;14:1129207. doi: 10.3389/fgene.2023.1129207. eCollection 2023. Front Genet. 2023. PMID: 36760998 Free PMC article.
References
-
- Denton CP, Khanna D. Systemic sclerosis [review]. Lancet 2017;390:1685–99. - PubMed
-
- Stifano G, Christmann RB. Macrophage involvement in systemic sclerosis: do we need more evidence? [review]. Curr Rheumatol Rep 2016;18:2. - PubMed
-
- Pillai S. T and B lymphocytes in fibrosis and systemic sclerosis [review]. Curr Opin Rheumatol 2019;31:576–81. - PubMed
-
- Fuschiotti P. T cells and cytokines in systemic sclerosis [review]. Curr Opin Rheumatol 2018;30:594–9. - PubMed
Publication types
MeSH terms
Grants and funding
LinkOut - more resources
Full Text Sources
Medical
Molecular Biology Databases
Research Materials
Miscellaneous
