Loss of primary cilia promotes inflammation and carcinogenesis
- PMID: 36281991
- PMCID: PMC9724674
- DOI: 10.15252/embr.202255687
Loss of primary cilia promotes inflammation and carcinogenesis
Abstract
Primary cilia (PC) are important signaling hubs, and we here explored their role in colonic pathology. In the colon, PC are mostly present on fibroblasts, and exposure of mice to either chemically induced colitis-associated colon carcinogenesis (CAC) or dextran sodium sulfate (DSS)-induced acute colitis decreases PC numbers. We generated conditional knockout mice with reduced numbers of PC on colonic fibroblasts. These mice show increased susceptibility to CAC, as well as DSS-induced colitis. Secretome and immunohistochemical analyses of DSS-treated mice display an elevated production of the proinflammatory cytokine IL-6 in PC-deficient colons. An inflammatory environment diminishes PC presence in primary fibroblast cultures, which is triggered by IL-6 as identified by RNA-seq analysis together with blocking experiments. These findings suggest an activation loop between IL-6 production and PC loss. An analysis of PC presence on biopsies of patients with ulcerative colitis or colorectal cancer (CRC) reveals decreased numbers of PC on colonic fibroblasts in pathological compared with surrounding normal tissue. Taken together, we provide evidence that a decrease in colonic PC numbers promotes colitis and CRC.
Keywords: colitis; colon carcinogenesis; colonic fibroblasts; inflammation; primary cilia.
© 2022 The Authors. Published under the terms of the CC BY NC ND 4.0 license.
Figures

- A–D
PC were identified by immunostaining for Arl13b (in green except in (D); arrowheads in the panel on the right‐hand side), and in parallel by identifying epithelial cells with E‐cadherin (A), fibroblasts with vimentin (B), and CD140a (C), labeling (all in red), and myofibroblasts by α‐SMA stain (D) (in green). Nuclei were stained with DAPI (in blue). Scale bars represent 30, 10, and 3 μm, respectively (from the left to the right).
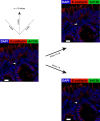

Experimental timeline for azoxymethane (AOM)/dextran sodium sulfate (DSS)‐induced CAC.
Hematoxylin/Eosin staining of paraffin‐sections from normal colon and colon of AOM/DSS‐treated C57Bl/6 mice as indicated in (A). Representative areas of normal colon and colon with low‐ and high‐grade dysplasia are shown. Features include hyperchromasia, stratification, and elongated cell nuclei in low‐grade dysplasia and marked hyperchromasia and increased pleomorphism of nuclei, as well as loss of cell polarity in high‐grade dysplasia. Scale bars represent 100 μm.
Box‐and‐whisker plots showing quantitative analysis of PC expression on vimentin+ cells in normal colon, and colon with low‐ and high‐grade dysplasia in mice exposed to the AOM/DSS protocol (analyzing at least 12 fields depicted from four different mice as illustrated in the middle and right panel of (B)). The box plot shows the median (inside line), 25–75 percentiles (box bottom to top), and the Whiskers connect the minimum and the maximum values to the Box. Significance values were determined by two‐tailed unpaired t‐tests (***p < 10−3).
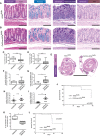
- A, B
No alterations in the architecture between colons of Kif3a flx/flx (A) and ColVIcre‐Kif3a flx/flx (B) mice are detectable. Representative images for stains with hematoxylin and eosin, Alcian blue (pH 2.5), Periodic acid–Schiff (PAS), and immunohistochemistry for Ki‐67 are shown. Alcian blue stains negatively charged mucopolysaccharides and glycoproteins, whereas PAS recognizes neutral mucopolysaccharides as well. Ki‐67‐positive cell nuclei were confined to the lower third of the crypts. Scale bars represent 100 μm.
- C, D
Quantitative analysis of PC expression on vimentin+ (C) and CD140a+ (D) cells in colons of Kif3a flx/flx and ColVIcre‐Kif3a flx/flx mice as described in Fig 2C.
- E–I
CAC was induced in control (n = 7) and ColVIcre‐Kif3a flx/flx (n = 7) female mice according to the timeline shown in Fig 2A. (E) Representative images of hematoxylin and eosin staining of paraffin‐embedded colon sections. Areas with high‐grade dysplasia are delimited by black lines. (F–I) Box‐and‐whisker plots depicting area (F, G) and number (H, I) of low‐ and high‐grade dysplasia per mouse.
- J
Kaplan–Meier survival curves of AOM/DSS‐treated male Kif3a flx/flx (n = 13) and ColVIcre‐Kif3a flx/flx (n = 11) mice. CAC was induced as described in Fig 2A.
- K
Quantitative analysis of PC expression on vimentin+ cells in normal colon of Ift88 flx/flx (n = 7) and ColVIcre‐IFT88 flx/flx (n = 6) mice.
- L
Kaplan–Meier survival curves of AOM/DSS‐treated male Ift88 flx/flx (n = 11) and ColVIcre‐Ift88 flx/flx (n = 12) mice. Colon carcinogenesis was induced as described in Fig 2A.
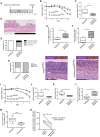
- A
Experimental timeline for DSS‐induced colitis in control (n = 7) and ColVIcre‐Kif3a flx/flx (n = 7) male mice.
- B, C
Relative weight development in DSS‐treated mice represented as % of relative weight loss (B) and the area under the curve (AUC) for the relative weight development (C). Individual body weight at the start of the protocol was taken as 100%. (B) Error bars represent standard deviation. *p < 0.05 by two‐tailed unpaired t‐tests. (C) The AUC was calculated for each mouse and compared between the two cohorts of mice. The box plot shows the median (inside line), 25–75 percentiles (box bottom to top), and the Whiskers connect the minimum and the maximum values to the Box.
- D–F
At the end of the protocol described in (A) mice were sacrificed and colons were analyzed by histology for colitis severity including areas of irregular crypts (i.e., nonparallel crypts, variable crypt diameters, bifurcation and branched crypts; D, E) and crypt loss (i.e., mucosa devoid of crypts; D, F). Data are presented as Box‐and‐whisker plots. *p < 0.05 by two‐tailed unpaired t‐test. Scale bar represents 1.5 mm.
- G
Incidence of dysplasia in DSS‐treated ColVIcre‐Kif3a flx/flx mice. Low‐ and high‐grade dysplasia was identified as described in Fig 2B.
- H
Elevated numbers of F4/80+ macrophages in colons of DSS‐treated ColVIcre‐Kif3a flx/flx mice. Representative images for F4/80 staining in areas with crypt loss are shown. At least five fields in the regions of crypt loss were analyzed from each colon of control (n = 6) and ColVIcre‐Kif3a flx/flx (n = 6) mice. Mean cell numbers were scored as low (< 500 cells/mm2) or high (> 500 cells/mm2). Scale bar represents 250 μm.
- K
Quantitative analysis of PC expression on vimentin+ cells in normal colon of Ift88 flx/flx (n = 7) and ColVIcre‐IFT88 flx/flx (n = 6) mice. *p < 0.05 by two‐tailed unpaired t‐test.
- I, J
Weight development in DSS‐treated ColVIcre‐Ift88 flx/flx (n = 6) and control (n = 7) mice following the indicated timeline. Shown are relative weight loss in % (I) and the AUC for the relative weight development (J). For the statistical analysis see (B, C).
- K, L
At the end of the protocol described in (I) mice were sacrificed and colons were analyzed for length (K), and crypt loss (L). Data are presented as Box‐and‐whisker plots. **p < 0.01 by two‐tailed unpaired t‐test.
- M
Comparison of primary cilia numbers on vimentinpositive cells in colons of untreated and DSS‐treated wild type mice. DSS treatment was performed as illustrated in (A). Primary cilia in DSS‐treated mice were depicted in areas of regeneration (14 fields in average 0.250 mm2). Significance values were determined by two‐tailed unpaired t‐tests (**p < 10−2).
- N
Decreased number of PC in inflamed tissue of patients with ulcerative colitis. Shown are the results of matched‐pair analysis for PC expression per vimentin+ cells as an arbitrary unit (AU, see Materials and Methods). The lines link values obtained for regions of ulceration in the ileum with those of normal regions from the same patient, demonstrating the difference in each pair.


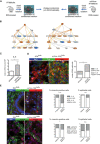
Preparation of conditioned medium. Colons were taken from DSS‐treated (7 days) Ift88 flx/flx (n = 6) and ColVIcre‐IFT88 flx/flx (n = 6) mice and kept for 4 h in PBS.
Graphical summaries of IPA pathway analysis of proteins identified by shotgun proteomics of conditioned media generated as described in (A). Nodes significantly upregulated (orange) and downregulated (blue) in the conditioned medium prepared as described in (A).
Transcript levels of Il‐6 in DSS‐treated Kif3a flx/flx and ColVIcre‐Kif3a flx/flx mice (according to the protocol shown in Fig 4A). Three independent mRNA samples were analyzed by RT–qPCR, and mean values standardized to the expression of the housekeeping gene Tbp are shown. Error bars represent SEM.
Elevated numbers of IL‐6‐expressing F4/80+ macrophages in ColVIcre‐Kif3a flx/flx mice treated with DSS as described in Fig 4A. At least five fields in the regions of crypt loss were analyzed. Scale bar represents 100 μm. *p < 0.05 was calculated by the chi‐squared test.
Elevated IL‐6 expression in colonic epithelial cells and fibroblasts of PC‐deficient mice upon DSS treatment as described in Fig 4A. Representative images and corresponding quantification of vimentinpositive fibroblasts (in green) and vimentinnegative epithelial cells (identified by histological criteria) labeled for IL‐6 (upper panel) and p‐STAT3 (lower panel) in red. Nuclei were stained with DAPI (in blue). White arrowheads indicate IL‐6 (upper panel) and nuclear staining for pSTAT3 (lower panel) for vimentinpositive fibroblasts, blue arrowheads the respective labeling for epithelial cells. Scale bars represent 100 μm. *p < 0.05, ****p < 10−4, n.s. (not significant) was calculated by the chi‐squared test on absolute numbers and is presented as % of cells positive for the indicated marker within vimentinpositive and epithelial cells, respectively.
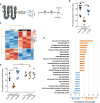
Generation of primary CF cultures from Ift88 flx/flx mice, that is, control animals. CF were isolated as described in the Materials and Methods section and passaged twice (2P‐CF) at days 5–7 (P1) and 9–11 (P2), and exposed to starvation at day 15 after isolation.
Starvation in the presence of inflammatory conditioned medium (inf‐CM) prevents PC formation on 2P‐CF, as observed in starvation medium (PBS, 0.5% BSA) and control conditioned medium (co‐CM). Conditioned media were generated from 4 h cultures of colons isolated from DSS‐treated (inf‐CM) and untreated (co‐CM) mice (n = 6). Error bars represent standard deviation.
Heat map of paired RNA‐seq analysis of 2P‐CF treated with either co‐CM (n = 3) or inf‐CM (n = 3) displaying two distinct clusters.
Analysis of gene expression signatures revealed the IL‐6/Jak/Stat3 pro‐inflammatory core gene set as the most elevated one in inf‐CM treated cells.
Blocking of Il‐6 abrogates the PC‐dampening effect of inf‐CM on 2P‐CF. Cells were treated for 24 h in starvation medium (control), inf‐CM, or co‐CM in the presence of antagonistic Il‐6 antibody or isotype control (5 μg/ml each). Error bars represent standard deviation.

Representative images of primary CF isolated from Ift88 flx/flx and ColVIcre‐Ift88 flx/flx mice starved 24 h (right panels) or not (left panels) to induce primary cilia expression. Primary cilia were stained with Arl13b (in green) and nuclei with DAPI (in blue). Scale bars represent 20 μm.
Kinetics of PC presence at different time points upon induction of starvation. CF cultures were isolated from distinct animals (n = 3 for each time point). Error bars represent standard deviation. *p < 0.05, **p < 0.01, ****p < 10−4 by two‐tailed unpaired t‐test.

- A
Representative image of vimentin+ fibroblasts (in green) expressing PC (identified using Arl13b, in red) in a normal colon. Nuclei were stained with DAPI (in blue). Most PC are detected on vimentin+ cells (arrow), and few on vimentin‐negative epithelial cells (arrowhead). Scale bars represent 50 μm in the upper and 10 μm in the lower panel.
- B, C
Quantitative analysis of PC presence on tumoral and peritumoral regions of colons from CRC patients (n = 28) at tumor (T) stages 1–4. The panels represent the quantification of PC expression (B) of vimentinpositive cells per mm2 and (C) per vimentinpositive cells as an arbitrary unit (AU, see Materials and Methods). Data are presented as Box‐and‐whisker plots. The box plot shows the median (inside line), 25–75 percentiles (box bottom to top), and the Whiskers connect the minimum and the maximum values to the Box. *p < 0.05, **p < 0.01, ***p < 10−3, ****p < 10−4 by two‐tailed unpaired t‐test. Images were acquired on an Andor Dragonfly Spinning Disk Confocal microscope and analyzed with the Imaris software. Quantification of PC and Vimentin+ fibroblasts was done on at least five random fields (about 1 mm2 each) per sample using ImageJ software.

- A, B
Representative images of the tissue of a stage I CRC patient showing the decreased number of primary cilia in tumoral (A) versus peritumoral (B) tissues. PC are indicated by arrows in vimentinpositive fibroblasts and stars in vimentinlow endothelial cells with elongated nucleus. Arrowheads indicate vimentinnegative epithelial cells. Scale bars represent 50 and 10 μm in the upper and lower panel, respectively.

References
Publication types
MeSH terms
Substances
LinkOut - more resources
Full Text Sources
Molecular Biology Databases

