. 2023 Jul;291(1):73-91.
doi: 10.1111/jmi.13151. Epub 2022 Nov 4.

A perspective of fluorescence microscopy for cellular structural biology with EGFR as witness

Affiliations

A perspective of fluorescence microscopy for cellular structural biology with EGFR as witness

M L Martin-Fernandez. J Microsc. 2023 Jul.

Abstract

The epidermal growth factor receptor (EGFR) is a poster child for the understanding of receptor behaviour, and of paramount importance to cell function and human health. Cloned almost forty years ago, the interest in EGFR's structure/function relationships remains unabated, not least because changes in oncogenic EGFR mutants are key drivers of the formation of lung and brain tumours. The structure of the assemblies formed by EGFR have been comprehensibly investigated by techniques such as high-resolution X-ray crystallography, NMR and all-atom molecular dynamics (MD) simulations. However, the complexity embedded in the portfolio of EGFR states that are only possible in the physiological environment of cells has often proved refractory to cell-free structural methods. Conversely, some key inroads made by quantitative fluorescence microscopy and super-resolution have depended on exploiting the wealth of structures available. Here, a brief personal perspective is provided on how quantitative fluorescence microscopy and super-resolution methods have cross-fertilised with cell-free-derived EGFR structural information. I primarily discuss areas in which my research group has made a contribution to fill gaps in EGFR's cellular structural biology and towards developing new tools to investigate macromolecular assemblies in cells.

Keywords: EGFR; FLIM-FRET; microscopy; single molecule; super-resolution.


Figures

FIGURE 1
FIGURE 1
Schematic representation of EGFR/ErbB/Her family receptors. (A) EGFR is one of four members of the EGFR/ErbB/Her family in humans. The other members are ErbB2/Her2, which is an orphan receptor without known soluble activating ligand; ErbB3/Her3 has a significantly impaired kinase domain, ; and ErbB4/Her4. EGFR binds and is activated by its cognate agonist growth factors: EGF itself, TGF‐α (transforming growth factor alpha), ARG (amphiregulin) and EGN (epigen). Bispecific ligands regulating both EGFR and ErbB4 are HB‐EGF (heparin‐binding EGF‐like growth factor), EPR (epiregulin), and BTC (betacellulin). Neuregulins (NRGs) 1 and 2 regulate ErbB3 and ErbB4, whereas NRG3 and NRG4 appear to be specific for ErbB4. (B) Domain composition of human EGFR. The extracellular region contains four domains. DI and DIII are closely related in sequence, as are DII and DIV. A short extracellular juxtamembrane (eJM) region separates the extracellular region from the transmembrane (TM) domain. Within the cell, a short intracellular juxtamembrane (iJM) region separates the tyrosine kinase domain (TKD) from the membrane. A representative EGFR tyrosine kinase domain (TKD) structure is shown. The TKD is followed by a carboxy‐terminal largely unstructured tail that contains at least five tyrosine autophosphorylation sites. Figure reprinted from Ref. (28). Copyright Cold Spring Harbor Laboratory Press
FIGURE 2
FIGURE 2
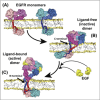
Near full‐length models of EGFR in a realistic membrane environment. (A) Model of the EGFR monomer; the simulation of the ectodomain was started from PDB entry 1NQL. The ectodomain is linked by a single helix embedded in embedded in a POPC/POPS membrane to the juxtamembrane and kinase domain in their inactive conformation., (B) Model of the ligand‐free inactive dimer. The extracellular dimer was simulated starting from the crystal structure PDB entry 3NJP after removing the two bound ligands, which results in significant rearrangement of the c‐terminal portion of DIV, increasing their separation above the membrane. This favours a link with a C‐terminal transmembrane dimer and a membrane‐embedded juxtamembrane dimer connected via the extended juxtamembrane to the (inactive) symmetric kinase dimer. (C) Model of the ligand‐bound active dimer. The back‐to‐back extracellular dimer bound to two EGF molecules is linked to a N‐terminal transmembrane dimer, which induces the formation of an antiparallel dimer of the N‐terminal portion of the juxtamembrane domains that moves away from the plasma membrane and catalyses the formation of the asymmetric kinase dimer (PDB entry 2GS6). The latter is placed according to the orientation seen in the crystal structure PDB entry 3GOP. Reprinted from Ref. (52), Copyright (2013), with permission from Elsevier
FIGURE 3
FIGURE 3
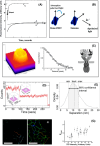
Example fluorescence microscopy methods to characterise state and conformation. (A) Photobleaching recovery curves of 3T3 cells at 23°C in the presence of 10 mM sodium azide to inhibit internalisation (curve A). Cells incubated for 20 min at 37°C in the presence of medium containing serum (curve B). For comparison control cells were labelled with the lipid probe DiI (3,3‐dioctadecylindocarbocyanine iodide) show fast recovery of ∼80% of the fluorescence that was bleached (curve C). From these data fractions of moving molecules and diffusion rates were calculated. (B) Cartoon illustrating how FRET depolarises the emission of the acceptor molecule. On absorption of vertically polarised light, the photonless transfer of excited state energy to the acceptor decouples the emission of the acceptor from the polarisation of the photon emitted by the donor. This is exploited in homo FRET as the degree of depolarisation scales with the number of transfer events. (C) (left) Confocal image of a BaF/3 cell expressing EGFR‐eGFP. The z axis represents the fluorescence intensity and the x, y axes the spatial coordinates. This image is an optical section taken near the cell equator and shows the membrane location of the EGFR‐eGFP and concentration fluctuation; (middle) spatial autocorrelation function: the average cluster density <N> ( = number of clusters/μm2) was determined from extrapolating the spatial autocorrelation function at zero lag (g(0)) using a Gaussian‐plus‐offset function as described by Petersen et al. (right) Model of the tetramer suggested by combining the image correlation and FRET data. (D) Example intensity bleaching time course of an image spot containing two molecules showing the change in the image after the first bleaching event. (E) An example of a seven‐parameter fit of the intensity and position of the two molecules and errors described by 1σ confidence intervals. (F) (left) Confocal image of acceptor intensity and (right) fluorescence lifetime image of the changes in the fluorescence lifetime of the FRET donor colour coded as a function of the degree of FRET efficiency. (G) Plot of the changes in FRET efficiency as a function of acceptor concentration derived from the area of membrane highlighted with red dots in (F). (F) and (G) Used with permission of American Society for Microbiology, from Ref. (72); permission conveyed through Copyright Clearance Center, Inc.
FIGURE 4
FIGURE 4
Structures of ligand‐bound oligomers. (A) FLImP distribution (grey) of CF640R fluorophore conjugated EGF on CHO cells (<10 copies of wild‐type EGFR per cell) treated with 4 nM EGF. The peak positions (and error bars) marked above the plot reflect those expected for dimers (from crystal structures) and the tetramer from the MD simulation in B) after adding the size of the dye. The optimal number of peak components (colour lines) and the best‐fit (black line) were determined using a Bayesian information criterion and Bayesian parameter estimation. (B) The full‐length structural model of an EGFR tetramer as a dimer of active dimers assembled by the face‐to‐face interactions. The predicted separation between the N‐termini of the two EGF ligands and the average EGF‐membrane distance are marked. The oligomer can grow sideways via head‐to‐head interactions between dimers. (C) The distance of closest approach (DOCA) between EGFR‐bound EGF molecules and the membrane, derived from point‐to‐plain FRET measurements, for dimers and oligomers that form at different EGF concentrations (x axis). (D) (left) TIRF image of a Xenopus oocyte expressing EGFR, 2 min after addition of 15 nM EGF; (middle and right) representative photobleaching traces of the intensity in imaged spots. (E) A model for an EGFR tetramer, generated by connecting the model shown in (A) to the structure of the dimeric transmembrane helices (PDB code 2M20) and a chain of kinase domains (PDB codes: 2GS6 and 3GOP).
FIGURE 5
FIGURE 5
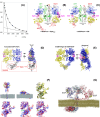
Heterogeneity of EGF binding to EGFR. (A) Quantitative binding experiments revealed a curvilinear dependence on the fraction of bound receptors versus the concentration of ligands yielding Scatchard plots like the one shown that can be fitted to two linear components. (B) The solubilised Drosophila EGFR extracellular domain (lacking DV) forms an asymmetric dimer when bound ligand (Spitz) [(SpitzEGF)2‐bound (s‐dEGFRΔV)2]. DI, DIII and DIV are blue, yellow and red respectively. DII is green in the left‐hand molecule (IIL) and dark grey in the right‐hand molecule (IIR). Bound Spitz is magenta. The dimerisation arm in DII is labelled. An asterisk marks the amino‐terminal part of DII where asymmetry is most evident. (C) Structure of the soluble truncated symmetric EGF‐induced dimer of the human EGFR extracellular region (s‐hEGFR) lacking DIV (PDB code 1IVO), coloured as in (B). (D) Orthogonal views of worm diagrams of the truncated human EGFR dimer bound to TGFα (tEGFR:TGFα). The side‐on view (right) shows the flush conformation adopted by this truncated dimer. The predicted position of DIV modelled on each subunit would predict a steric clash. (E) Orthogonal views of worm diagrams of dimers of soluble human ErbB4 extracellular domain bound to its ligand Nrg1β (s‐ErbB4:Nrg1β) and soluble human EGFR also including DIV (s‐EGFR:EGF), following superposition of DI, DII and DIII. One receptor subunit is coloured yellow, the other blue; Nrg1β is coloured magenta. Superposition of a single receptor subunit of the tEGFR:TGFα dimer with a single subunit of either the sErbB4:Nrg1β or sEGFR:EGF dimers reveals the opposite ErbB subunits to differ by a scissor‐like rotation about the dimerisation arms. (F) (top left) Constrained by point‐to‐plane FRET data, the extended human receptor (hEGFR) ectodomain dimer with two bound ligands was modelled on crystallographic structures 1IVO and 1NQL and placed above modelled transmembrane helices in a POPC membrane. Receptor monomers are shown in red and blue ribbon representation, and both ligands are in yellow. Green spheres indicate the N termini of the ligands to which donor dyes are attached. (top middle) Endpoint of a MD simulation of a doubly liganded, tilted ectodomain human EGFR dimer, relaxed on the membrane. Also shown are overlays of the left and right subunits of receptor dimers using DI as a reference for doubly liganded soluble human EGFR (1IVO). (top right) Simulation of unliganded hEGFR relaxed on the membrane. (bottom left) Simulation of singly liganded hEGFR relaxed on the membrane. (bottom middle) Simulation of doubly liganded human EGFR relaxed on the membrane. (bottom right) Unliganded soluble Drosophila EGFR (3I2T) shown in (B). Results suggested that by aligning on the plasma membrane the human EGFR dimer can recapitulate the asymmetry of the fly receptor. (G) The extracellular tetramer model in Figure 5B in a simulation of over 10 μs, in which the distance from one of the two bound EGF ligands to the membrane was particularly short, is consistent with FRET results used to constraint the simulations in (G). (A) From Ref. (120). Reprinted with permission from AAAS. (B), (C) Reprinted from Ref. (85), Copyright (2010), with permission from Elsevier. (D), (E) Reprinted from Ref. (86). (F) Used with permission of American Society for Microbiology, from Ref. (72).
FIGURE 6
FIGURE 6
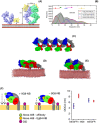
Autoinhibited conformations in dimers and oligomers. (A) Models of the YFP‐EGFR‐ectodomain on the cell surface membrane. The ectodomain (space filling model) is fused to YFP at its N‐terminus (FRET donor, yellow ribbon) in the tethered monomer (left) and untethered dimer (right) conformations. The membrane cartoon depicts the position of the rhodamine‐DHPE labels (red circles, FRET acceptor). Note the 3 nm separation between the YFP tag and the membrane in the tethered form that would be expected from high FRET efficiency) as compared to the untethered form (10 nm, low FRET efficiency). (B) FLImP distribution (grey) of DIII–DIII separations between CF640R‐Affibody molecules bound to EGFR on CHO cells, compiled from FLImP measurements (CI ≤ 7 nm), decomposed into a sum of five components (coloured traces). The inset shows positions and error estimates. (C) An open‐ended oligomer model of 9G8‐bound EGFR extracellular domains in the inactive conformation built using the crystal contacts in the monomer structure in PDB ID 4KRP. (D) A simulation‐generated dimer structure of free EGFR extracellular domains and their TM domains in the lipid bilayer. The simulation was started from the crystal dimer of 9G8‐bound EGFR extracellular domains in the tethered conformation in which the two copies of the 9G8‐NB were removed from the simulation system. The images are based on the snapshot of the simulation at 20 μs. One of the two transmembrane helices is visible. (E) A simulation‐generated dimer structure of 9G8‐bound EGFR extracellular domains starting from a crystal dimer of 9G8‐bound EGFR extracellular domains in the tethered conformation. These images are based on the snapshot of the simulation at 20 μs. Invisible from this image are the TM helices embedded in the membrane. (F) (left and middle) Cartoons showing a side view of DI and DIII separations from the membrane in head‐to‐head complexes in the presence and absence of bound 9G8‐NB; (right) FRET‐derived separations from the membrane‐DiI acceptor to DI (Alexa 488‐EgB4‐NB, blue) or DIII (Alexa 488‐Affibody, red) donors. The FRET results were consistent with the predictions of the head‐to‐head dimer model. (A) Used with permission of IOP Publishing, from Ref. (104).

Similar articles

Cited by

References

    1. Low‐Nam, S. T. , Lidke, K. A. , Cutler, P. J. , Roovers, R. C. , Van Bergen En Henegouwen, P. M. P. , Wilson, B. S. , & Lidke, D. S. (2011). ErbB1 dimerization is promoted by domain co‐confinement and stabilized by ligand binding. Nature Structural & Molecular Biology, 18, 1244–1249. 10.1038/nsmb.2135 - DOI - PMC - PubMed
    1. Kaplan, M. , Narasimhan, S. , De Heus, C. , Mance, D. , Van Doorn, S. , Houben, K. , Popov‐Čeleketić, D. , Damman, R. , Katrukha, E. A. , Jain, P. , Geerts, W. , Heck, A. , Folkers, G. E. , Kapitein, L. C. , Lemeer, S. , van Bergen En Henegouwen, P. , & Baldus, M. (2016). EGFR dynamics change during activation in native membranes as revealed by NMR. Cell, 167, 1241–51e11. 10.1016/j.cell.2016.10.038 - DOI - PubMed
    1. Kovacs, E. , Zorn, J. A. , Huang, Y. , Barros, T. , & Kuriyan, J. (2015). A structural perspective on the regulation of the epidermal growth factor receptor. Annual Review of Biochemistry, 84, 739–764. 10.1146/annurev-biochem-060614-034402 - DOI - PMC - PubMed
    1. Huang, Y. , Bharill, S. , Karandur, D. , Peterson, S. M. , Marita, M. , Shi, X. , Shi, X. , Kaliszewski, M. J. , Smith, A. W. , Isacoff, E. Y. , & Kuriyan, J. (2016). Molecular basis for multimerization in the activation of the epidermal growth factor receptor. Elife, 5, 10.7554/eLife.14107 - DOI - PMC - PubMed
    1. Needham, S. R. , Hirsch, M. , Rolfe, D. J. , Clarke, D. T. , Zanetti‐Domingues, L. C. , Wareham, R. , & Martin‐Fernandez, M. L. (2013). Measuring EGFR separations on cells with ∼10 nm resolution via fluorophore localization imaging with photobleaching. Plos One, 8, e62331. 10.1371/journal.pone.0062331 - DOI - PMC - PubMed

Publication types