Multicenter Study
. 2022 Oct 25:11:e80150.
doi: 10.7554/eLife.80150.

Comprehensive machine-learning survival framework develops a consensus model in large-scale multicenter cohorts for pancreatic cancer

Affiliations
Multicenter Study

Comprehensive machine-learning survival framework develops a consensus model in large-scale multicenter cohorts for pancreatic cancer

Libo Wang et al. Elife. .

Abstract

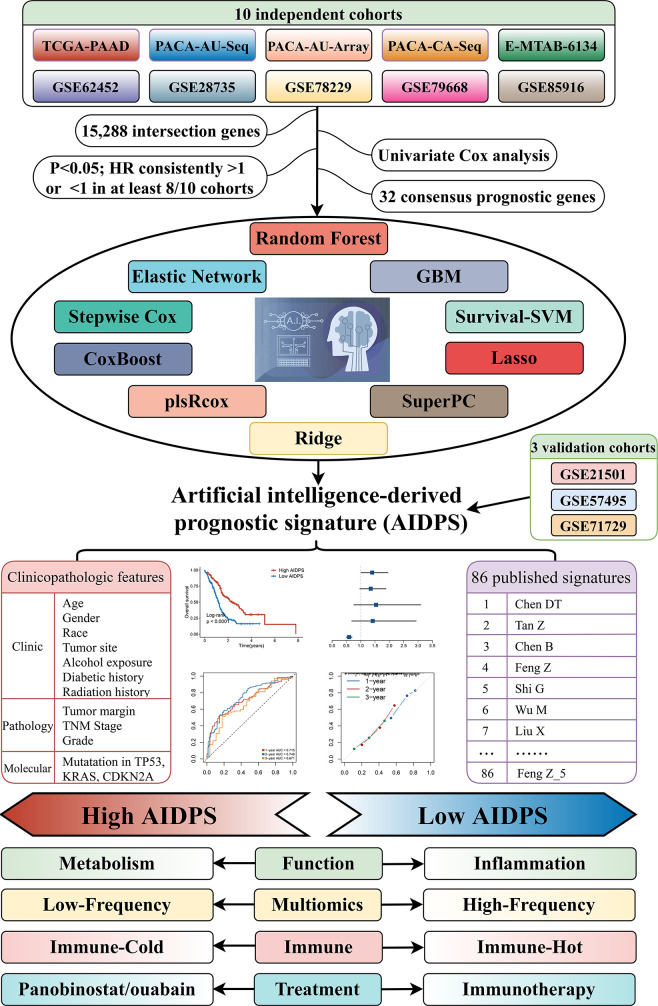
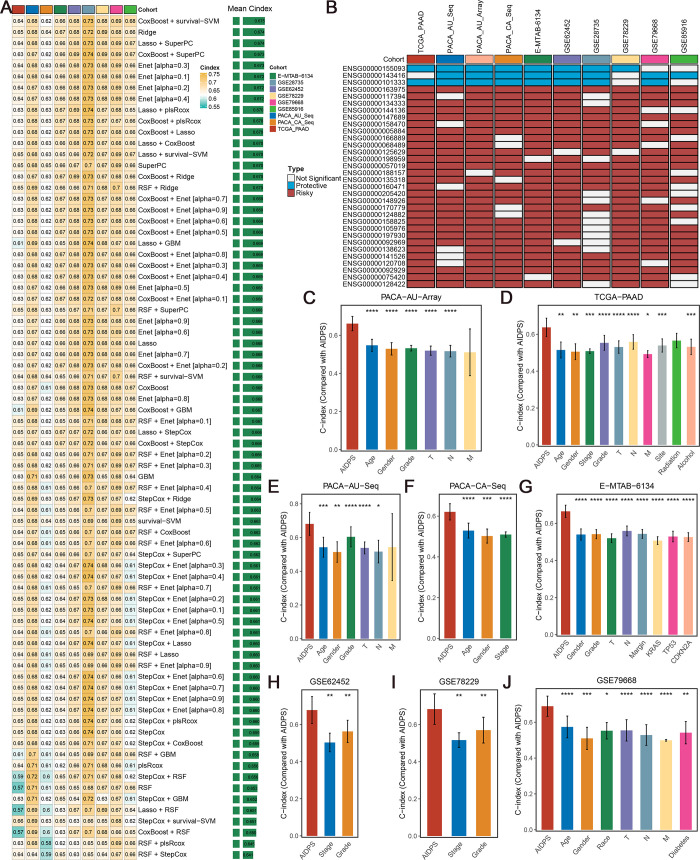
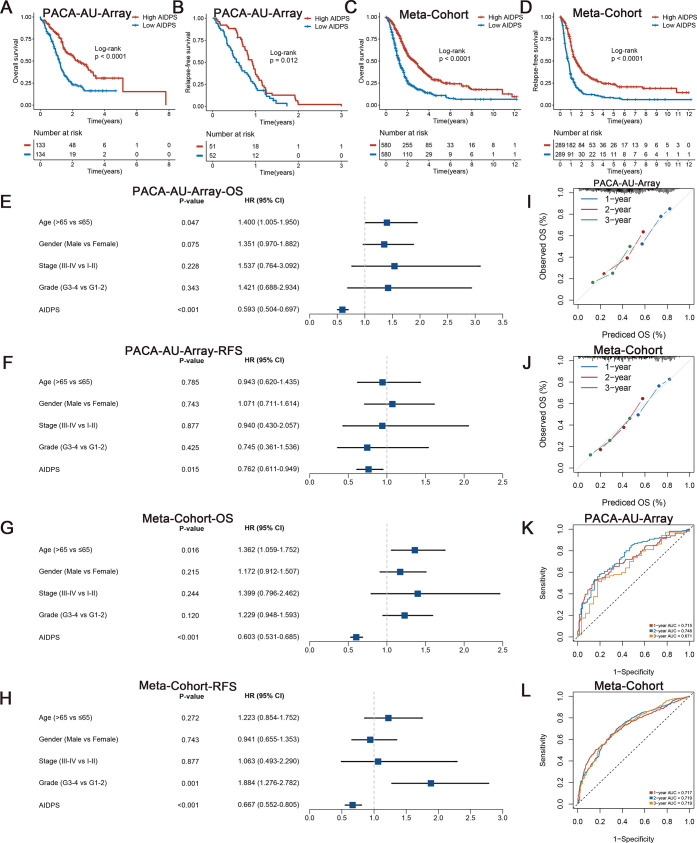
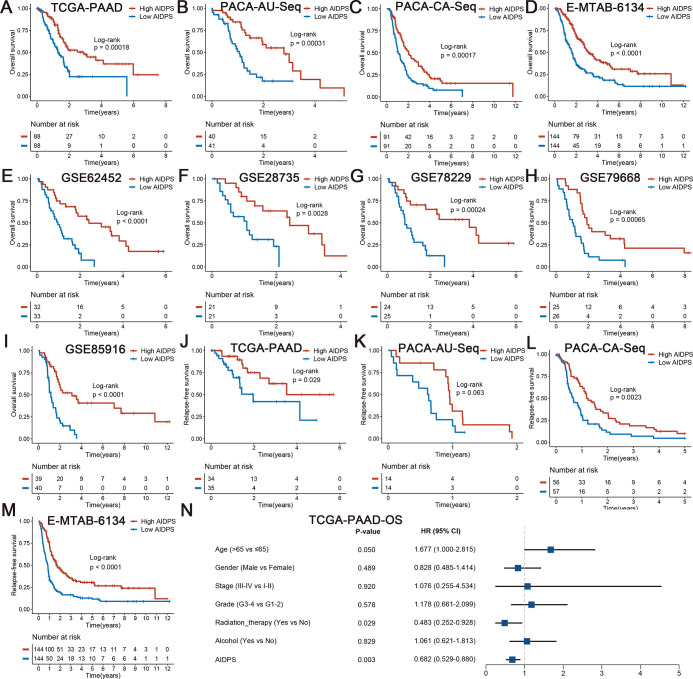
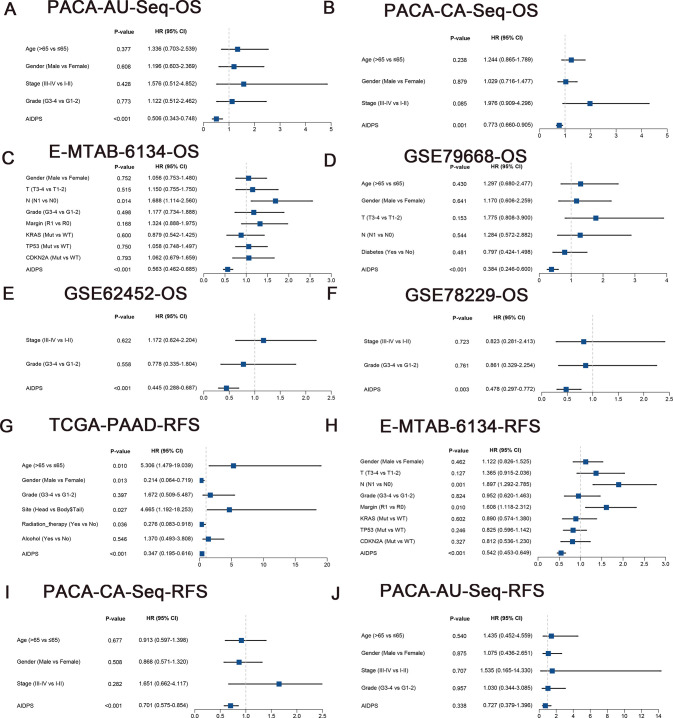
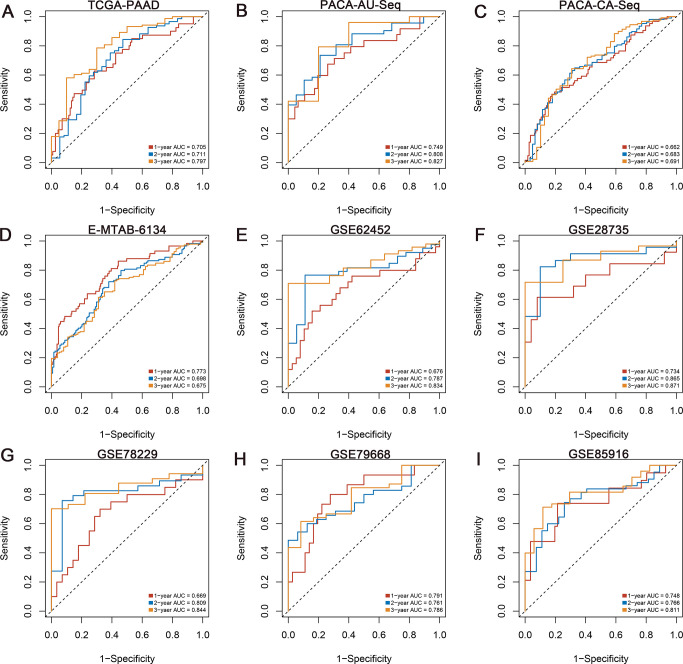
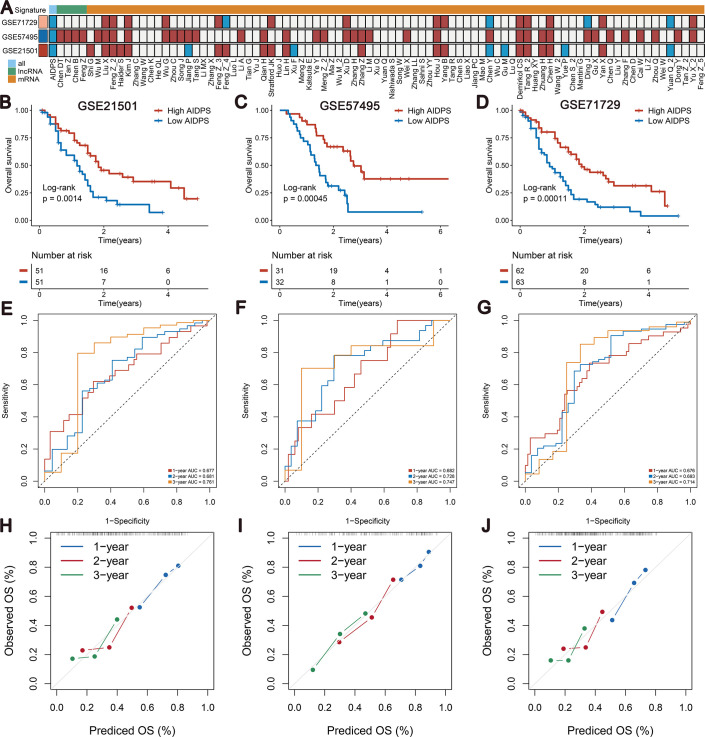
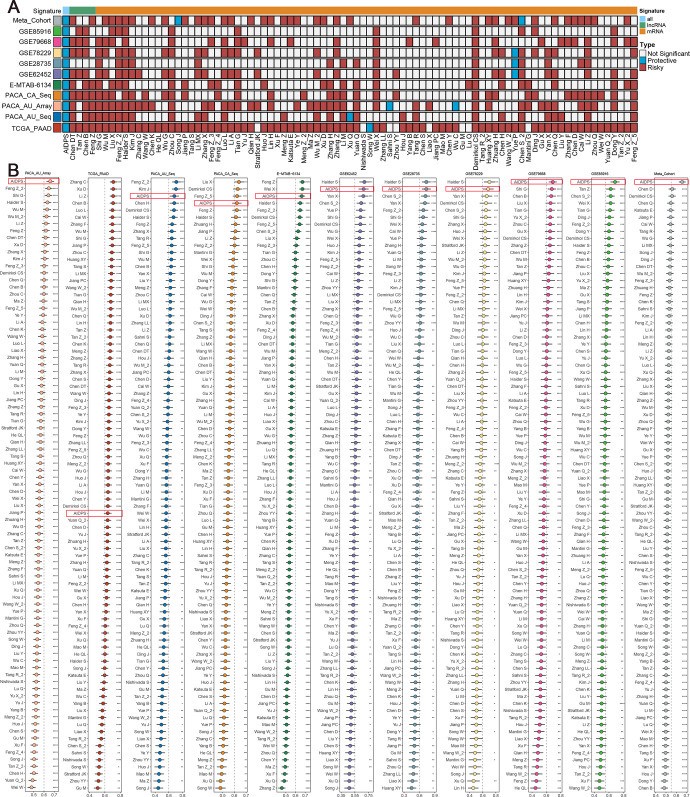
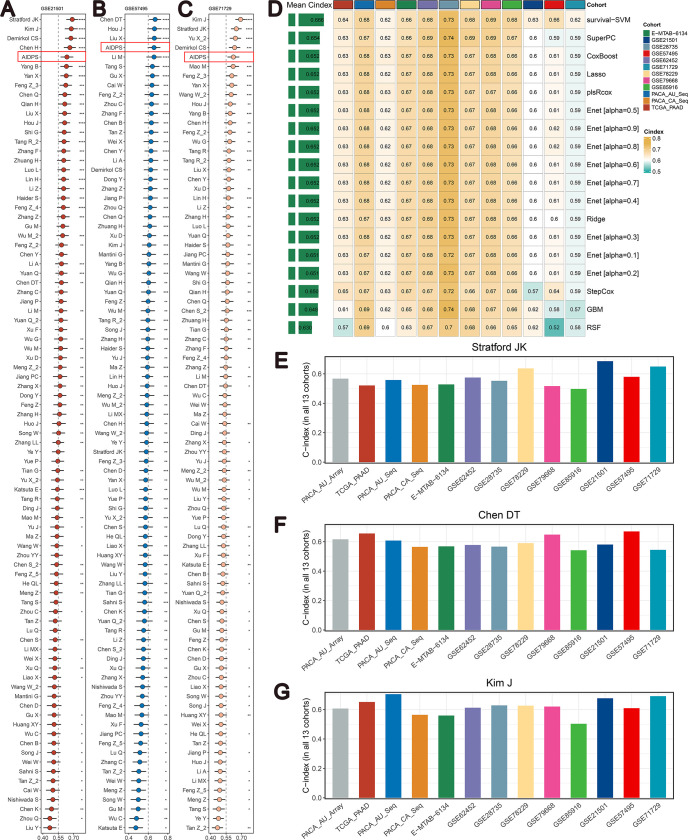
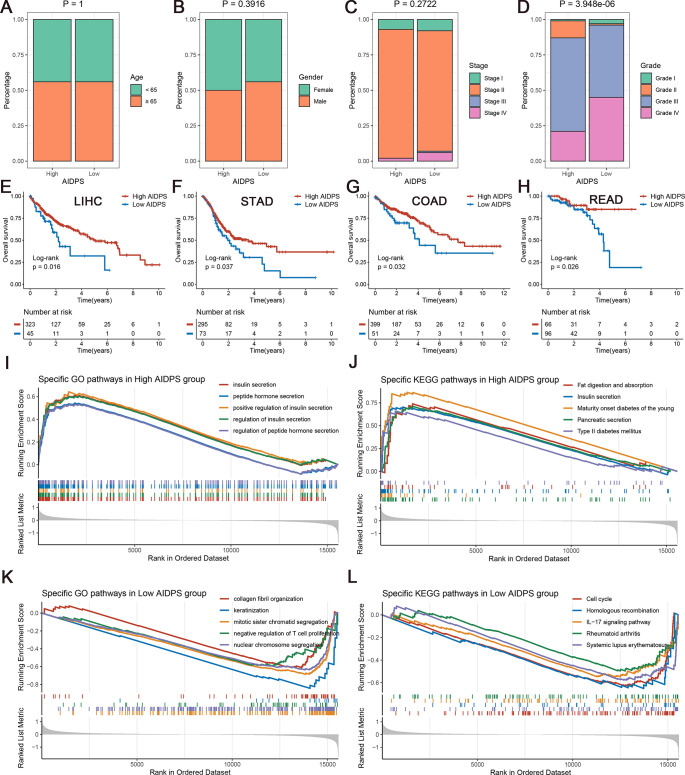
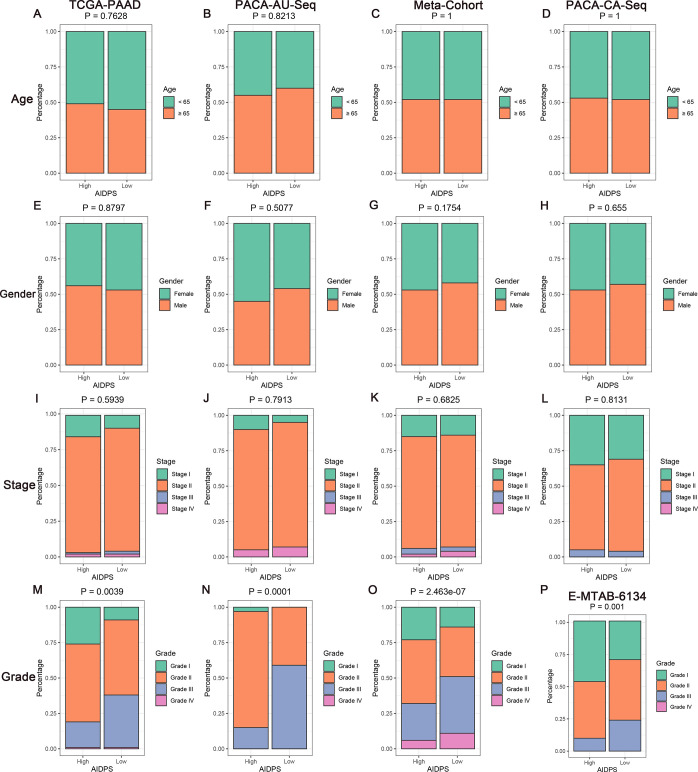
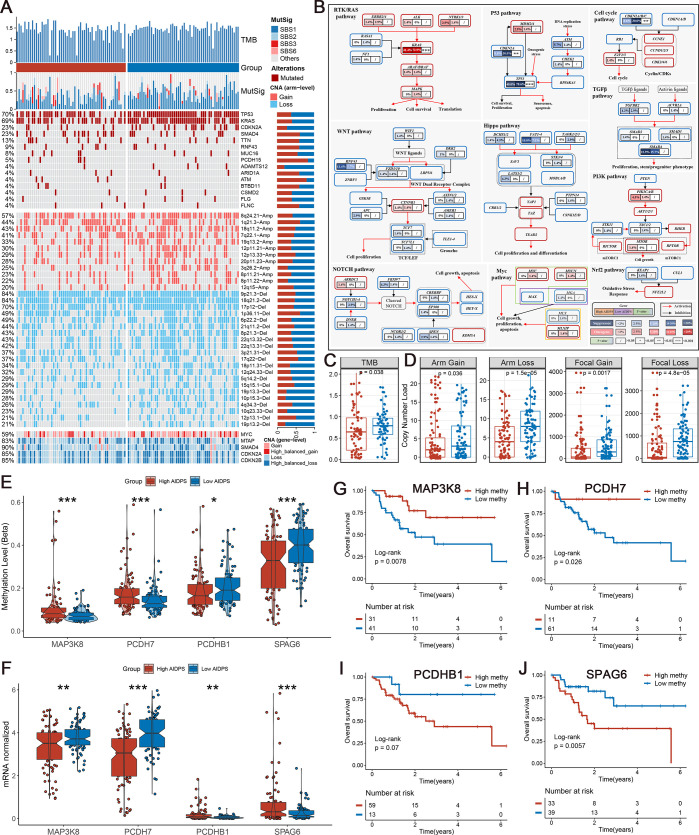
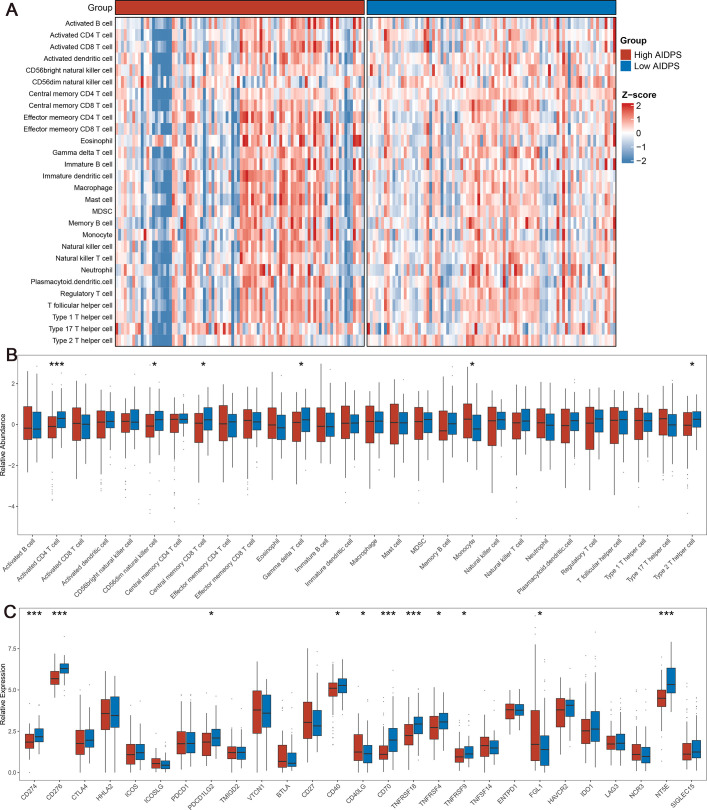
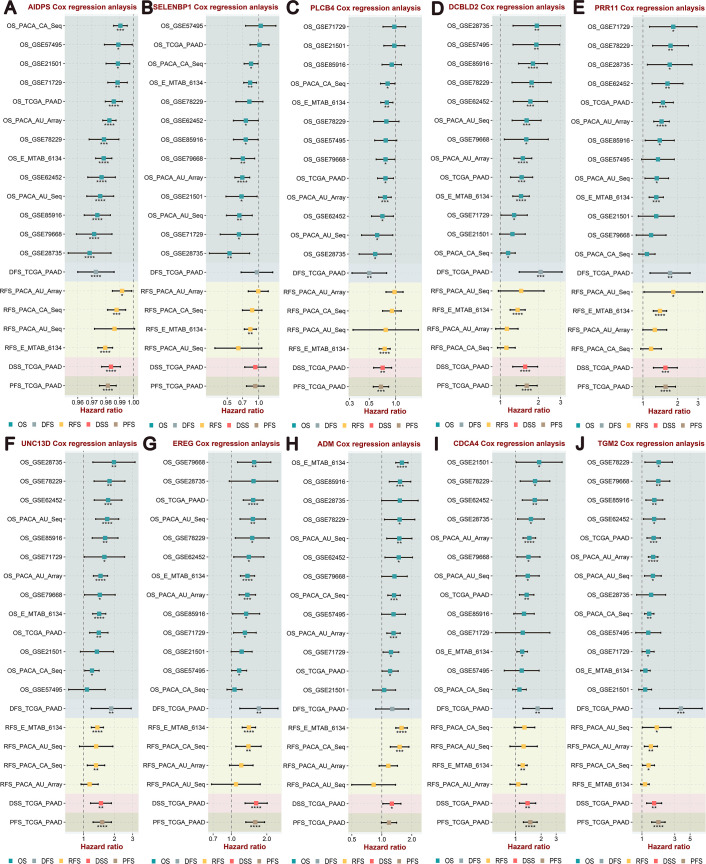
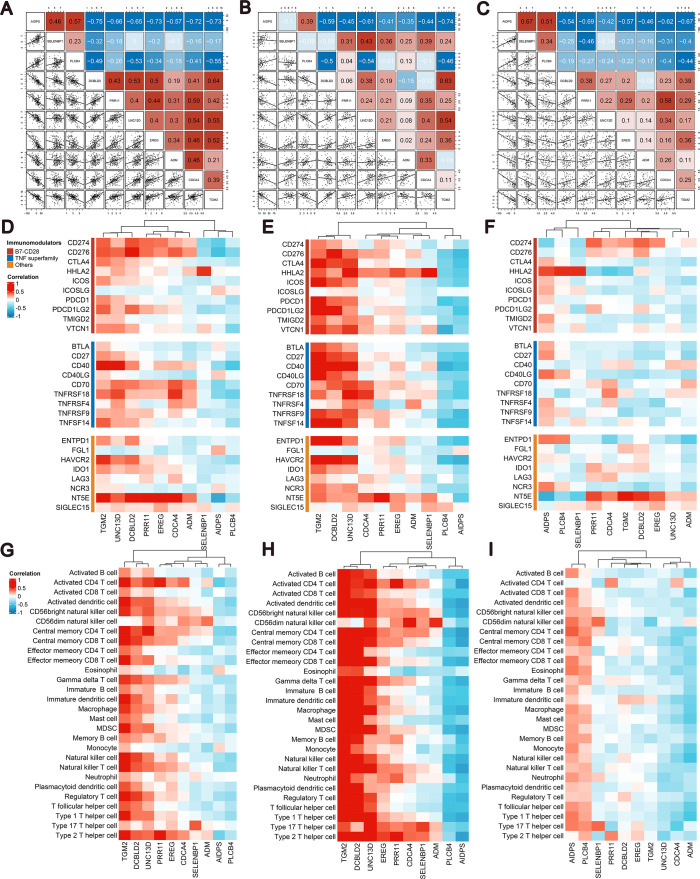
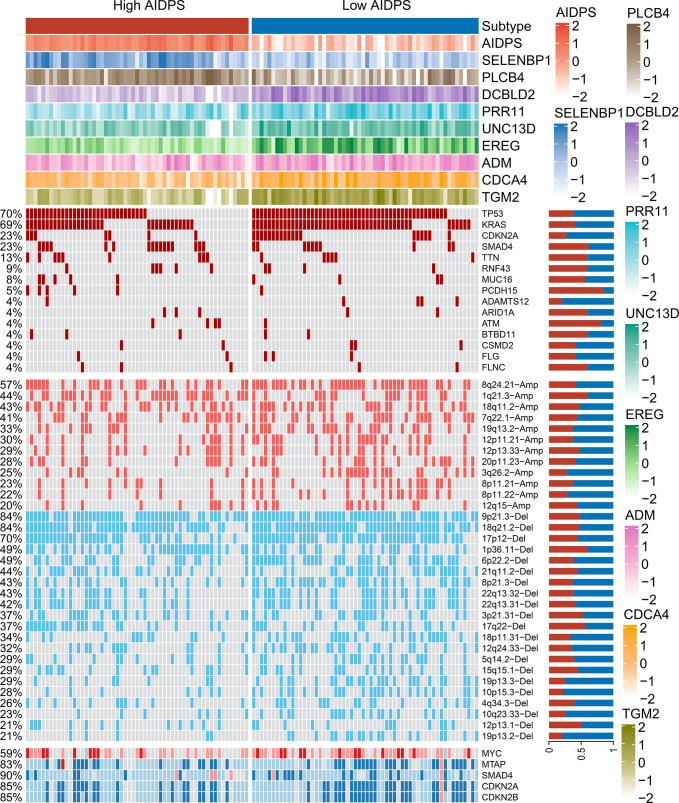
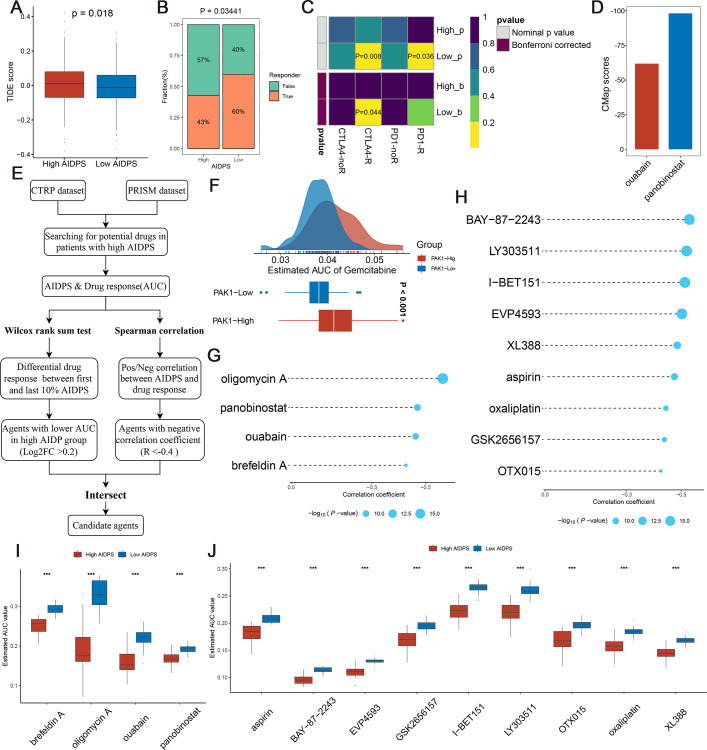
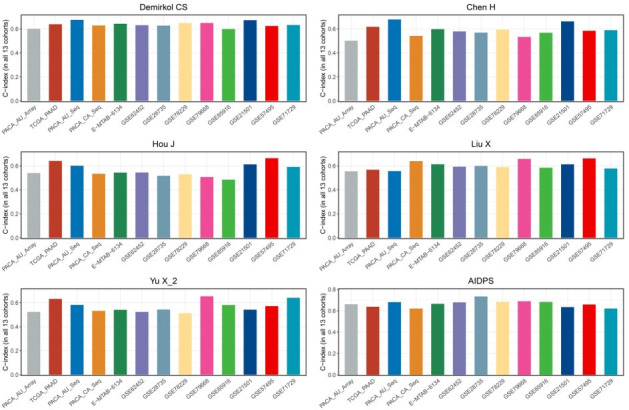
As the most aggressive tumor, the outcome of pancreatic cancer (PACA) has not improved observably over the last decade. Anatomy-based TNM staging does not exactly identify treatment-sensitive patients, and an ideal biomarker is urgently needed for precision medicine. Based on expression files of 1280 patients from 10 multicenter cohorts, we screened 32 consensus prognostic genes. Ten machine-learning algorithms were transformed into 76 combinations, of which we selected the optimal algorithm to construct an artificial intelligence-derived prognostic signature (AIDPS) according to the average C-index in the nine testing cohorts. The results of the training cohort, nine testing cohorts, Meta-Cohort, and three external validation cohorts (290 patients) consistently indicated that AIDPS could accurately predict the prognosis of PACA. After incorporating several vital clinicopathological features and 86 published signatures, AIDPS exhibited robust and dramatically superior predictive capability. Moreover, in other prevalent digestive system tumors, the nine-gene AIDPS could still accurately stratify the prognosis. Of note, our AIDPS had important clinical implications for PACA, and patients with low AIDPS owned a dismal prognosis, higher genomic alterations, and denser immune cell infiltrates as well as were more sensitive to immunotherapy. Meanwhile, the high AIDPS group possessed observably prolonged survival, and panobinostat may be a potential agent for patients with high AIDPS. Overall, our study provides an attractive tool to further guide the clinical management and individualized treatment of PACA.

Keywords: biomarker; cancer biology; computational biology; human; immunotherapy; machine learning; multi‐omic; pancreatic cancer; systems biology.


Conflict of interest statement

LW, ZL, RL, WW, RZ, JL, ZX, SW, XH, YS No competing interests declared

Figures

Figure 1.
Figure 1.. The workflow of our research.
Figure 2.
Figure 2.. Construction and testing of the artificial intelligence-derived prognostic signature (AIDPS).
(A) The C-indexes of 76 machine-learning algorithm combinations in the nine testing cohorts. (B) Discovery of 32 consensus prognosis genes from 10 independent multicenter cohorts. (C–J) The predictive performance of AIDPS was compared with common clinical and molecular variables in the PACA-AU-Array (C), TCGA-PAAD (D), PACA-AU-Seq (E), PACA-CA-Seq (F), E-MTAB-6134 (G), GSE62452 (H), GSE78229 (I), and GSE79668 (J). Z-score test: *p<0.05, **p<0.01, ***p<0.001, ****p<0.0001.
Figure 3.
Figure 3.. Survival analysis and predictive performance evaluation of artificial intelligence-derived prognostic signature (AIDPS).
(A, B) Kaplan–Meier survival analysis for overall survival (OS) (A) and relapse-free survival (RFS) (B) between the high and low AIDPS groups in the PACA-AU-Array. (C, D) Kaplan–Meier survival analysis for OS (C) and RFS (D) between the high and low AIDPS groups in the Meta-Cohort. (E, F) Multivariate Cox regression analysis of OS (E) and RFS (F) in the PACA-AU-Array. (G, H) Multivariate Cox regression analysis of OS (G) and RFS (H) in the Meta-Cohort. (I, J) Calibration curve for predicting 1-, 2-, and 3-year OS in the PACA-AU-Array (I), and Meta-Cohort (J). (K, L) Time-dependent receiver-operator characteristic (ROC) analysis for predicting 1-, 2-, and 3-year OS in the PACA-AU-Array (K), and Meta-Cohort (L).
Figure 3—figure supplement 1.
Figure 3—figure supplement 1.. Survival analysis of artificial intelligence-derived prognostic signature (AIDPS) in the nine testing cohorts.
(A–I) Kaplan–Meier survival analysis for overall survival (OS) between the high and low AIDPS groups in the TCGA-PAAD (A), PACA-AU-Seq (B), PACA-CA-Seq (C), E-MTAB-6134 (D), GSE62452 (E), GSE28735 (F), GSE78229 (G), GSE79668 (H), and GSE85916 (I). (J–M) Kaplan–Meier survival analysis for relapse-free survival (RFS) between the high and low AIDPS groups in the TCGA-PAAD (J), PACA-AU-Seq (K), PACA-CA-Seq (L), and E-MTAB-6134 (M). (N) Multivariate Cox regression analysis of OS in the TCGA-PAAD.
Figure 3—figure supplement 2.
Figure 3—figure supplement 2.. Survival analysis of artificial intelligence-derived prognostic signature (AIDPS) in the nine testing cohorts.
(A–F) Multivariate Cox regression analysis of overall survival (OS) in the PACA-AU-Seq (A), PACA-CA-Seq (B), E-MTAB-6134 (C), GSE79668 (D), GSE62452 (E), and GSE78229 (F). (G–J) Multivariate Cox regression analysis of relapse-free survival (RFS) in the TCGA-PAAD (G), E-MTAB-6134 (H), PACA-CA-Seq (I), and PACA-AU-Seq (J).
Figure 3—figure supplement 3.
Figure 3—figure supplement 3.. Predictive performance of artificial intelligence-derived prognostic signature (AIDPS) in the nine testing cohorts.
Time-dependent receiver-operator characteristic (ROC) analysis for predicting 1-, 2-, and 3-year overall survival (OS) in the TCGA-PAAD (A), PACA-AU-Seq (B), PACA-CA-Seq (C), E-MTAB-6134 (D), GSE62452 (E), GSE28735 (F), GSE78229 (G), GSE79668 (H), and GSE85916 (I).
Figure 3—figure supplement 4.
Figure 3—figure supplement 4.. Survival analysis and predictive performance of artificial intelligence-derived prognostic signature (AIDPS) in the three external validation cohorts.
(A) Univariate Cox regression analysis of AIDPS and 86 published signatures of pancreatic cancer (PACA) in three external validation cohorts. (B–D) Kaplan–Meier survival analysis for overall survival (OS) in the GSE21501 (B), GSE57495 (C), and GSE71729 (D) cohorts. (E–G) Time-dependent receiver-operator characteristic (ROC) analysis for predicting 1-, 2-, and 3-year OS in the GSE21501 (E), GSE57495 (F), and GSE71729 (G). (H–J) Calibration curve for predicting 1-, 2-, and 3-year OS in the GSE21501 (H), GSE57495 (I), and GSE71729 (J).
Figure 4.
Figure 4.. Comparisons between artificial intelligence-derived prognostic signature (AIDPS) and 86 expression-based signatures.
(A) Univariate Cox regression analysis of AIDPS and 86 published signatures of pancreatic cancer (PACA). (B) C-indexes of AIDPS and 86 published signatures in the PACA-AU-Array, TCGA-PAAD, PACA-AU-Seq, PACA-CA-Seq, E-MTAB-6134, GSE62452, GSE28735, GSE78229, GSE79668, GSE85916, and Meta-Cohort. Z-score test: *p<0.05, **p<0.01, ***p<0.001, ****p<0.0001.
Figure 4—figure supplement 1.
Figure 4—figure supplement 1.. Comparison of artificial intelligence-derived prognostic signature (AIDPS) with 86 published signatures in the three validation cohorts and with models constructed by other methods for nine AIDPS genes.
(A) C-indexes of AIDPS and 86 published signatures in the GSE21501. (B) C-indexes of AIDPS and 86 published signatures in the GSE57495. (C) C-indexes of AIDPS and 86 published signatures in the GSE71729. (D) The C-indexes of AIDPS and models constructed by other methods for nine AIDPS genes in the nine testing cohorts and three external validation cohorts. (E) The C-indexes for the six-gene signature of Stratford JK in all 13 cohorts. (F) The C-indexes for the 15-gene signature of Chen DT in all 13 cohorts. (G) The C-indexes for the five-gene signature of Kim J in all 13 cohorts. Z-score test: *p<0.05, **p<0.01, ***p<0.001, ****p<0.0001.
Figure 5.
Figure 5.. The clinical signature and functional characteristics of the high and low artificial intelligence-derived prognostic signature (AIDPS) groups.
(A–D) Composition percentage of the two groups in clinical characteristics such as age (A), gender (B), stage (C), and grade (D) in the PACA-AU-Array. (E–H) Kaplan–Meier survival analysis for overall survival (OS) in the TCGA-LIHC (E), TCGA-STAD (F), TCGA-COAD (G), and TCGA-READ (H). (I, J) The top five Gene Ontology (GO)-enriched pathways (I) and Kyoto Encyclopedia of Genes and Genomes (KEGG)-enriched pathways (J) in the high AIDPS groups. (K, L) The top five GO-enriched pathways (K) and KEGG-enriched pathways (L) in the low AIDPS groups.
Figure 5—figure supplement 1.
Figure 5—figure supplement 1.. The clinical characteristics of the high and low artificial intelligence-derived prognostic signature (AIDPS) groups.
(A, E, I, M) Composition percentage of the two groups in clinical characteristics such as age (A), gender (E), stage (I), and grade (M) in the TCGA-PAAD cohort. (B, F, J, N) Composition percentage of the two groups in clinical characteristics such as age (B), gender (F), stage (J), and grade (N) in the PACA-AU-Seq cohort. (C, G, K, O) Composition percentage of the two subtypes in clinical characteristics such as age (C), gender (G), stage (K), and grade (O) in the Meta-Cohort cohort. (D, H, L) Composition percentage of the two groups in clinical characteristics such as age (D), gender (H), and stage (L) in the PACA-CA-Seq cohort. (P) Composition percentage of the two groups on grade in the E-MTAB-6134 cohort.
Figure 6.
Figure 6.. Multi-omics analysis based on mutation, copy number alteration (CNA), and methylation.
(A) Genomic alteration landscape according to artificial intelligence-derived prognostic signature (AIDPS). Tumor mutation burden (TMB), relative contribution of four mutational signatures, top 15 mutated genes and broad-level CNA (>20%), and selected genes located within chromosomes 8q24.21, 9p21.3, and 18q21.2 are shown from the top to the bottom panels. The proportion of the high and low AIDPS groups in each alteration is presented in the right bar charts. (B) Comprehensive comparison of mutation landscapes in 10 oncogenic signaling pathways across the high and low AIDPS groups. Genes are mutated at different frequencies (color intensity indicates the mutation frequency within the entire dataset) by oncogenic mutations (red) and tumor suppressor mutations (blue). Each gene box includes two percentages representing the mutation frequency in the high and low AIDPS groups, and another box representing the statistical p-value. Genes are grouped by signaling pathways, with edges showing pairwise molecular interactions. (C) Comparison of the two groups in TMB. (D) Comparison of the two groups in arm and focal CNA burden. (E, F) Boxplot of DNA methylation level (E) and mRNA expression level (F) for methylation-driven genes in the high and low groups. (G–J) Kaplan–Meier survival analysis between the high and low methylation groups in the MAP3K8 (G), PCDH7 (H), PCDHB1 (I), and SPAG6 (J). *p<0.05, **p<0.01, ***p<0.001.
Figure 7.
Figure 7.. The immune landscape in the high and low artificial intelligence-derived prognostic signature (AIDPS) groups.
(A) The heatmap of 28 immune cell types in the high and low AIDPS groups. (B) Boxplot of relative infiltrate abundance of 28 immune cell types in patients with high and low AIDPS groups. (C) Boxplot of relative expression levels at 27 immune checkpoints profiles between the high and low AIDPS patients. *p<0.05, **p<0.01, ***p<0.001.
Figure 7—figure supplement 1.
Figure 7—figure supplement 1.. Integrated Cox regression analysis of survival variables for artificial intelligence-derived prognostic signature (AIDPS) and nine AIDPS genes in 13 cohorts.
(A–J) Univariate Cox regression analysis of overall survival (OS), disease-free survival (DFS), relapse-free survival (RFS), disease-specific survival (DSS), and progression-free survival (PFS) for AIDPS (A), SELENBP1 (B), PLCB4 (C), DCBLD2 (D), PRR11 (E), UNC13D (F), EREG (G), ADM (H), CDCA4 (I), and TGM2 (J) in the training cohort, nine testing cohorts, and three external validation cohorts. .
Figure 7—figure supplement 2.
Figure 7—figure supplement 2.. The correlation of artificial intelligence-derived prognostic signature (AIDPS) and its nine genes with immune molecules and immune cell types.
(A–C) The correlation between AIDPS and its nine genes at expression level in the whole (A), high AIDPS (B) and low AIDPS (C) TCGA-PAAD cohort. (D–F) The correlation of AIDPS and its nine genes with 27 immune checkpoint molecules in the whole (D), high AIDPS (E), and low AIDPS (F) TCGA-PAAD cohort. (G–I) The correlation of AIDPS and its nine genes with 28 immune cell types in the whole (G), high AIDPS (H), and low AIDPS (I) TCGA-PAAD cohort.
Figure 7—figure supplement 3.
Figure 7—figure supplement 3.. The relevance of artificial intelligence-derived prognostic signature (AIDPS) and its nine genes with mutation and copy number alteration.
From top to bottom panels, the AIDPS and expression of nine AIDPS genes SELENBP1, PLCB4, DCBLD2, PRR11, UNC13D, EREG, ADM, CDCA4, and TGM2 for each sample; top 15 mutated genes and broad-level copy number alterations (>20%), and selected genes located within chromosomes 8q24.21, 9p21.3, and 18q21.2 are shown in the high and low AIDPS TCGA-PAAD cohort. The proportion of the high and low AIDPS groups in each alteration is presented in the right bar charts.
Figure 8.
Figure 8.. Evaluating therapeutic drug benefits.
(A) Boxplot of Tumour Immune Dysfunction and Exclusion (TIDE) score between the high and low artificial intelligence-derived prognostic signature (AIDPS) groups. (B) Percentage of immunotherapy responses at high and low AIDPS groups. (C) Submap analysis of the two groups and 47 pretreated patients with comprehensive immunotherapy annotations. For Submap analysis, a smaller p-value implied a more similarity of paired expression profiles. (D) Barplot of ouabain and panobinostat CMap scores in patients with high AIDPS. (E) Schematic outlining the strategy to develop potential therapeutic agents with higher drug sensitivity in the high AIDPS group. (F) Comparison of estimated gemcitabine’s sensitivity between high and low PAK1 expression groups. (G, H) The results of Spearman’s correlation analysis of Cancer Therapeutics Response Portal (CTRP)-derived compounds (G) and profiling relative inhibition simultaneously in mixtures (PRISM)-derived compounds (H). (I, J) The results of differential drug response analysis of CTRP-derived compounds (I) and PRISM-derived compounds (J), the lower values on the y-axis of boxplots imply greater drug sensitivity. CMap, Connectivity Map *p<0.05, **p<0.01, ***p<0.001.
Author response image 1.

References

    1. Aggarwal G, Ramachandran V, Javeed N, Arumugam T, Dutta S, Klee GG, Klee EW, Smyrk TC, Bamlet W, Han JJ, Rumie Vittar NB, de Andrade M, Mukhopadhyay D, Petersen GM, Fernandez-Zapico ME, Logsdon CD, Chari ST. Adrenomedullin is up-regulated in patients with pancreatic cancer and causes insulin resistance in β cells and mice. Gastroenterology. 2012;143:1510–1517. doi: 10.1053/j.gastro.2012.08.044. - DOI - PMC - PubMed
    1. Alexandrov LB, Nik-Zainal S, Wedge DC, Aparicio SAJR, Behjati S, Biankin AV, Bignell GR, Bolli N, Borg A, Børresen-Dale A-L, Boyault S, Burkhardt B, Butler AP, Caldas C, Davies HR, Desmedt C, Eils R, Eyfjörd JE, Foekens JA, Greaves M, Hosoda F, Hutter B, Ilicic T, Imbeaud S, Imielinski M, Imielinsk M, Jäger N, Jones DTW, Jones D, Knappskog S, Kool M, Lakhani SR, López-Otín C, Martin S, Munshi NC, Nakamura H, Northcott PA, Pajic M, Papaemmanuil E, Paradiso A, Pearson JV, Puente XS, Raine K, Ramakrishna M, Richardson AL, Richter J, Rosenstiel P, Schlesner M, Schumacher TN, Span PN, Teague JW, Totoki Y, Tutt ANJ, Valdés-Mas R, van Buuren MM, van ’t Veer L, Vincent-Salomon A, Waddell N, Yates LR, Australian Pancreatic Cancer Genome Initiative. ICGC Breast Cancer Consortium. ICGC MMML-Seq Consortium. ICGC PedBrain. Zucman-Rossi J, Futreal PA, McDermott U, Lichter P, Meyerson M, Grimmond SM, Siebert R, Campo E, Shibata T, Pfister SM, Campbell PJ, Stratton MR. Signatures of mutational processes in human cancer. Nature. 2013;500:415–421. doi: 10.1038/nature12477. - DOI - PMC - PubMed
    1. Ali AI, Wang M, Scheidt B, Dominguez PM, Harrison AJ, Tantalo DGM, Kang J, Oliver AJ, Chan JD, Du X, Bai Y, Lee B, Johnstone RW, Darcy PK, Kershaw MH, Slaney CY. A histone deacetylase inhibitor, panobinostat, enhances chimeric antigen receptor T-cell antitumor effect against pancreatic cancer clinical cancer research. Clin Cancer Research. 2021;27:6222–6234. doi: 10.1158/1078-0432.CCR-21-1141. - DOI - PubMed
    1. Baker MJ, Goldstein AM, Gordon PL, Harbaugh KS, Mackley HB, Glantz MJ, Drabick JJ. An interstitial deletion within 9p21.3 and extending beyond CDKN2A predisposes to melanoma, neural system tumours and possible haematological malignancies. Journal of Medical Genetics. 2016;53:721–727. doi: 10.1136/jmedgenet-2015-103446. - DOI - PMC - PubMed
    1. Bear AS, Vonderheide RH, O’Hara MH. Challenges and opportunities for pancreatic cancer immunotherapy. Cancer Cell. 2020;38:788–802. doi: 10.1016/j.ccell.2020.08.004. - DOI - PMC - PubMed

Publication types