. 2023 Jan 17;133(2):e162581.
doi: 10.1172/JCI162581.

Trained immunity is induced in humans after immunization with an adenoviral vector COVID-19 vaccine

Affiliations

Trained immunity is induced in humans after immunization with an adenoviral vector COVID-19 vaccine

Dearbhla M Murphy et al. J Clin Invest. .

Abstract

BackgroundHeterologous effects of vaccines are mediated by "trained immunity," whereby myeloid cells are metabolically and epigenetically reprogrammed, resulting in heightened responses to subsequent insults. Adenovirus vaccine vector has been reported to induce trained immunity in mice. Therefore, we sought to determine whether the ChAdOx1 nCoV-19 vaccine (AZD1222), which uses an adenoviral vector, could induce trained immunity in vivo in humans.MethodsTen healthy volunteers donated blood on the day before receiving the ChAdOx1 nCoV-19 vaccine and on days 14, 56, and 83 after vaccination. Monocytes were purified from PBMCs, cell phenotype was determined by flow cytometry, expression of metabolic enzymes was quantified by RT-qPCR, and production of cytokines and chemokines in response to stimulation ex vivo was analyzed by multiplex ELISA.ResultsMonocyte frequency and count were increased in peripheral blood up to 3 months after vaccination compared with their own prevaccine controls. Expression of HLA-DR, CD40, and CD80 was enhanced on monocytes for up to 3 months following vaccination. Moreover, monocytes had increased expression of glycolysis-associated enzymes 2 months after vaccination. Upon stimulation ex vivo with unrelated antigens, monocytes produced increased IL-1β, IL-6, IL-10, CXCL1, and MIP-1α and decreased TNF, compared with prevaccine controls. Resting monocytes produced more IFN-γ, IL-18, and MCP-1 up to 3 months after vaccination compared with prevaccine controls.ConclusionThese data provide evidence for the induction of trained immunity following a single dose of the ChAdOx1 nCoV-19 vaccine.FundingThis work was funded by the Health Research Board (EIA-2019-010) and Science Foundation Ireland Strategic Partnership Programme (proposal ID 20/SPP/3685).

Keywords: COVID-19; Cytokines; Glucose metabolism; Monocytes; Vaccines.


Conflict of interest statement

Conflict of interest: The authors have declared that no conflict of interest exists.

Figures

Figure 1
Figure 1. Schematic representing the study design and donor information.
(A) Timeline used for sample acquisition. (B) Flow chart of donors recruited, the exclusion criteria, and the donors who were evaluable. (C) Graph showing the age, with mean and SD, of the total donor cohort (white), male donors (blue), and female donors (pink). (D) Number of donors recruited to the study stratified by sex.
Figure 2
Figure 2. Long-term effects of vaccination on monocyte subsets in the blood.
Monocytes were isolated from PBMCs from healthy donors on day –1 (prevaccine), day 14, day 56, and day 83 after vaccination (and prior to the second dose) using a hyperosmotic Percoll gradient. (A) Cells were Fc blocked and stained with fluorochrome-conjugated antibodies specific for CD14, CD68, and CD16. Total monocytes were identified as CD14+CD68, and CD14+CD16+ monocytes were also examined. Numbers in the dot plots indicate the frequencies of cells (%) present inside the gate or quadrant. (B) The median fluorescent intensity of CD14 in the total ex vivo CD14+ population was assessed over time. (C) The absolute number of CD14+ cells was calculated by multiplying the total cell yield from the hyperosmotic Percoll enrichment by the percentage of CD14+ cells. (D) Monocyte frequency was calculated by dividing the total number of CD14+ cells by the total number of PBMCs. (E) The absolute number of CD14+CD16+ cells was calculated by multiplying the total cell yield from the hyperosmotic Percoll enrichment by the percentage of CD14+ CD16+ cells. (F) CD14+CD16+ monocyte frequency was calculated by dividing the total number of CD14+CD16+ cells by the total number of PBMCs. Each dot represents an individual donor (n = 10), with blue dots denoting male donors and pink dots denoting female donors. Data are graphed as the mean value ± SD. Statistically significant differences between the groups were determined by repeated measures 1-way ANOVA using Dunnett’s multiple comparisons test; *P < 0.05, **P < 0.01.
Figure 3
Figure 3. Vaccination enhanced the expression of cell markers associated with antigen presentation and T cell activation.
Monocytes were enriched from healthy donor PBMCs on day –1 (prevaccine), day 14, day 56, and day 83 after vaccination using a hyperosmotic Percoll gradient. The cell surface expression of (A) the antigen presentation marker HLA-DR and (BD) the T cell costimulatory molecules (B) CD40, (C) CD80, and (D) CD86 on ex vivo monocytes was assessed by flow cytometry. Graphs show collated data, with each dot representing an individual donor (n = 10); blue dots denote male donors, and pink dots denote female donors. Representative histograms illustrate the difference in the median fluorescence intensity of each marker in stained (full outline) and unstained (dotted outline) samples on day –1 (blue) and day 83 (red). Data are graphed as the mean value ± SD. Statistically significant differences between the groups were determined by a repeated measures 1-way ANOVA using Tukey’s multiple comparisons test; *P < 0.05, **P < 0.01, ***P < 0.001, ****P < 0.0001.
Figure 4
Figure 4. Monocytes were metabolically reprogrammed after vaccination.
(A) A diagram showing the breakdown of glucose to pyruvate via the glycolytic pathway. Pathway intermediates are shown in black, enzymes are shown in green, and the enzymes analyzed in this study are shown in red. Monocytes were enriched from healthy donor PBMCs on the day before (day –1) and days 14, 56, and 83 after vaccination using a hyperosmotic Percoll gradient. (BE) Relative expression of transcript levels of (B) GPI, (C) PFKFB3, (D) GAPDH, and (E) PKM2 are shown. (F and G) Isolated monocytes were stimulated ex vivo with (F) medium or (G) irradiated M. tuberculosis (10 μg/mL iH37Rv), and the concentration of IL-1β in the supernatant was measured by multiplex ELISA. (H) Relative expression of transcript levels of ATP5B, a gene marker of oxidative phosphorylation, was also determined. Gene expression was determined using RT-qPCR. Each dot represents an individual donor (n = 6–8), with blue dots denoting male donors and pink dots denoting female donors. Statistically significant differences between the groups were determined by (BE and H) a mixed-effects model (REML) ANOVA, with Šídák’s multiple comparisons test and (G) a repeated measures 1-way ANOVA using Dunnett’s multiple comparisons test; *P < 0.05, **P < 0.01.
Figure 5
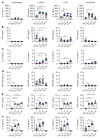
Figure 5. Vaccination altered cytokine production in response to unrelated stimuli.
Monocytes were isolated from healthy donor PBMCs on the day before (day –1) and days 14, 56, and 83 after vaccination using a hyperosmotic Percoll gradient. Monocytes were further purified using plastic adherence and were routinely over 90% pure. Monocytes were left to rest overnight and stimulated ex vivo with medium (unstimulated), irradiated M. tuberculosis (iH37Rv; 10 μg/mL), LPS (10 ng/mL), or Pam3Csk4 (10 μg/mL) for 24 hours. The concentrations of (A) IL-6, (B) TNF, (C) IL-10, (D) GM-CSF, (E) IFN-γ, and (F) IL-18 in the supernatants were assessed using a multiplex ELISA, with AE showing ng/mL and F showing pg/mL. Each dot represents an individual donor (n = 6), with blue dots denoting male donors and pink dots denoting female donors. Data are graphed as the mean value ± SD. Statistically significant differences between the groups were determined by a repeated measures 1-way ANOVA using Dunnett’s multiple comparisons test; *P < 0.05, **P < 0.01, ***P < 0.001, ****P < 0.0001.
Figure 6
Figure 6. Vaccination results in altered chemokine production in response to unrelated stimuli.
Monocytes were enriched from healthy donor PBMCs on the day before (day –1) and days 14, 56, and 83 after vaccination using a hyperosmotic Percoll gradient. Monocytes were further purified using plastic adherence and were routinely over 90% pure. Monocytes were left to rest overnight and stimulated ex vivo with medium (unstimulated), irradiated M. tuberculosis (iH37Rv; 10 μg/mL), LPS (10 ng/mL), or Pam3Csk4 (10 μg/mL) for 24 hours. The concentrations of (A) MCP-1, (B) CXCL1, (C) CXCL2, and (D) MIP-1α in ng/mL in the supernatants were assessed using a multiplex ELISA. Graphs show collated data, with each dot representing an individual donor (n = 6) and blue dots denoting male donors and pink dots denoting female donors. Data are graphed as the mean value ± SD. Statistically significant differences between the groups were determined by a repeated measures 1-way ANOVA using Dunnett’s multiple comparisons test; *P < 0.05, **P < 0.01, ***P < 0.001, ****P < 0.0001.

Comment in

  • Beyond adaptive immunity: induction of trained immunity by COVID-19 adenoviral vaccines

References

    1. Netea MG, et al. Defining trained immunity and its role in health and disease. Nat Rev Immunol. 2020;20(6):375–388. doi: 10.1038/s41577-020-0285-6. - DOI - PMC - PubMed
    1. Kleinnijenhuis J, et al. Bacille Calmette-Guerin induces NOD2-dependent nonspecific protection from reinfection via epigenetic reprogramming of monocytes. Proc Natl Acad Sci U S A. 2012;109(43):17537–17542. doi: 10.1073/pnas.1202870109. - DOI - PMC - PubMed
    1. Kleinnijenhuis J, et al. Long-lasting effects of BCG vaccination on both heterologous Th1/Th17 responses and innate trained immunity. J Innate Immun. 2014;6(2):152–158. doi: 10.1159/000355628. - DOI - PMC - PubMed
    1. Arts RJW, et al. BCG Vaccination protects against experimental viral infection in humans through the induction of cytokines associated with trained immunity. Cell Host Microbe. 2018;23(1):89–100. doi: 10.1016/j.chom.2017.12.010. - DOI - PubMed
    1. Kaufmann E, et al. BCG educates hematopoietic stem cells to generate protective innate immunity against tuberculosis. Cell. 2018;172(1–2):176–190. - PubMed

Publication types