. 2022 Dec 15;132(24):e160767.
doi: 10.1172/JCI160767.

A FOXO1-dependent transcription network is a targetable vulnerability of mantle cell lymphomas

Affiliations

A FOXO1-dependent transcription network is a targetable vulnerability of mantle cell lymphomas

Ja-Young Jang et al. J Clin Invest. .

Abstract

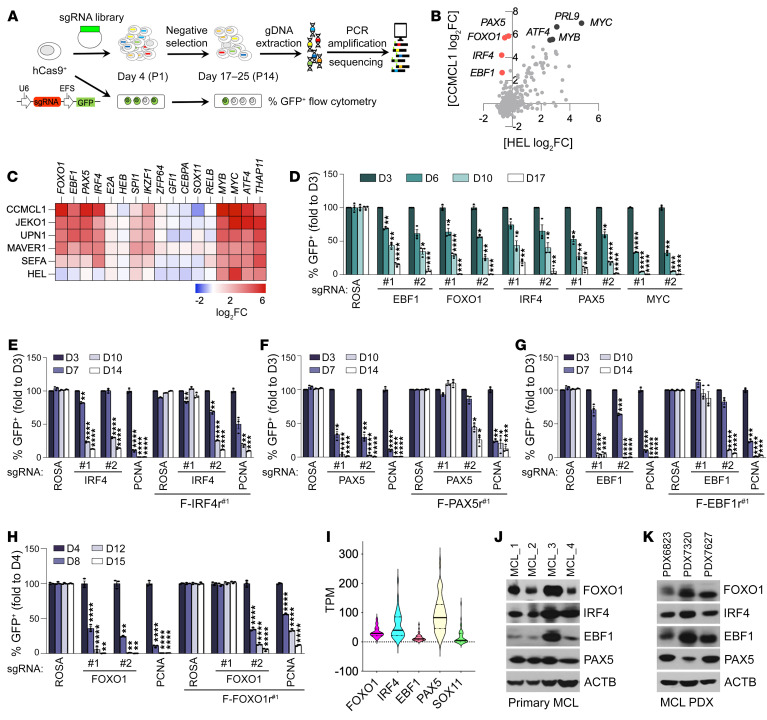
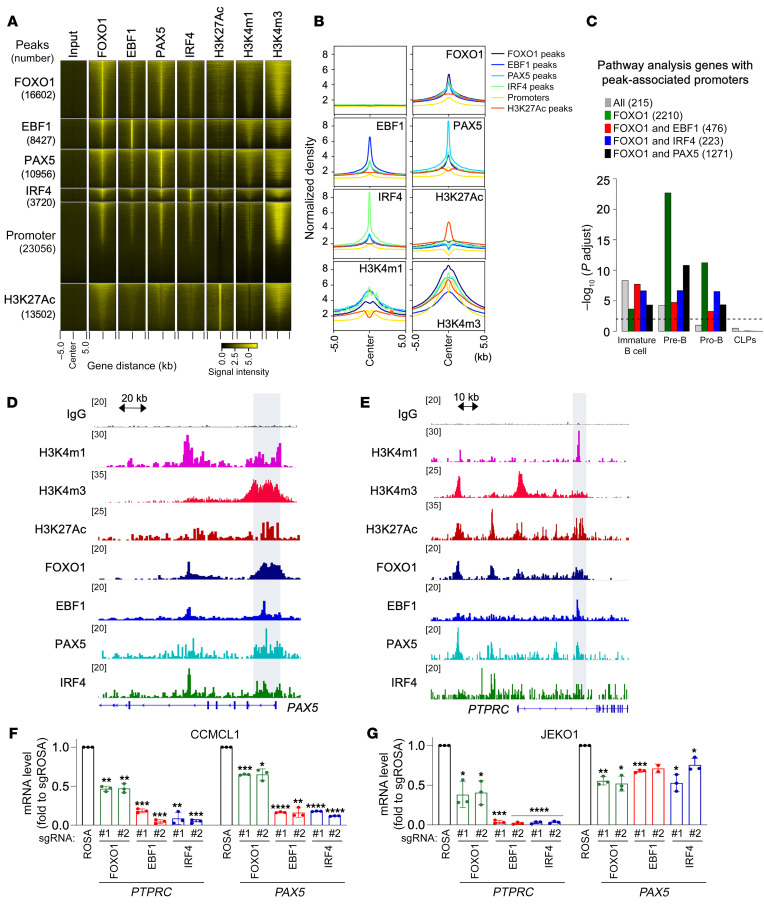
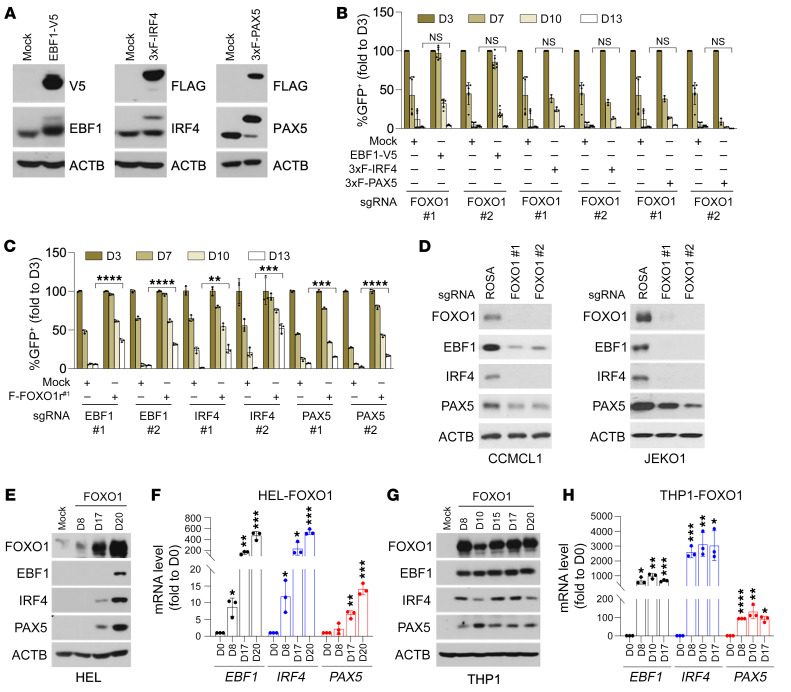
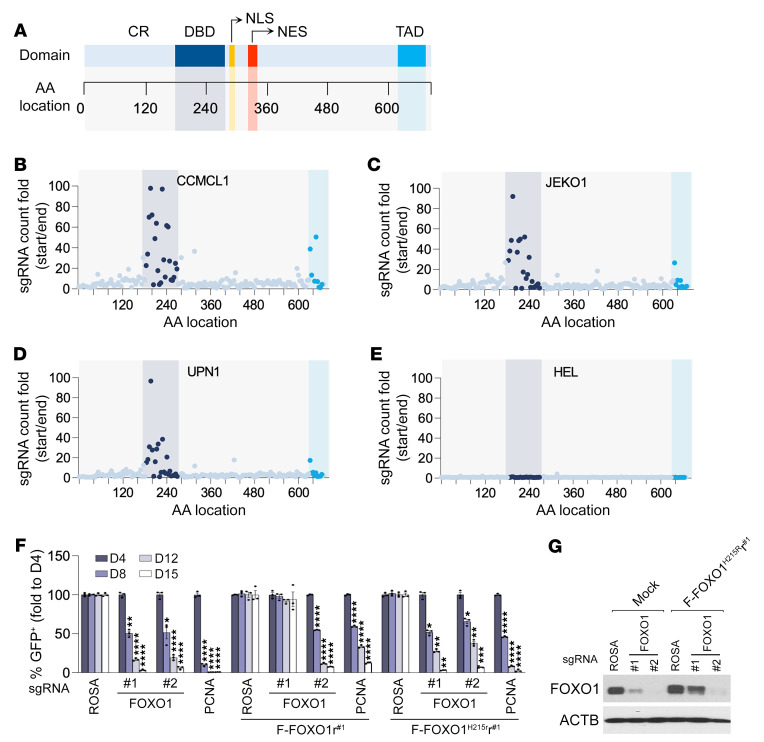
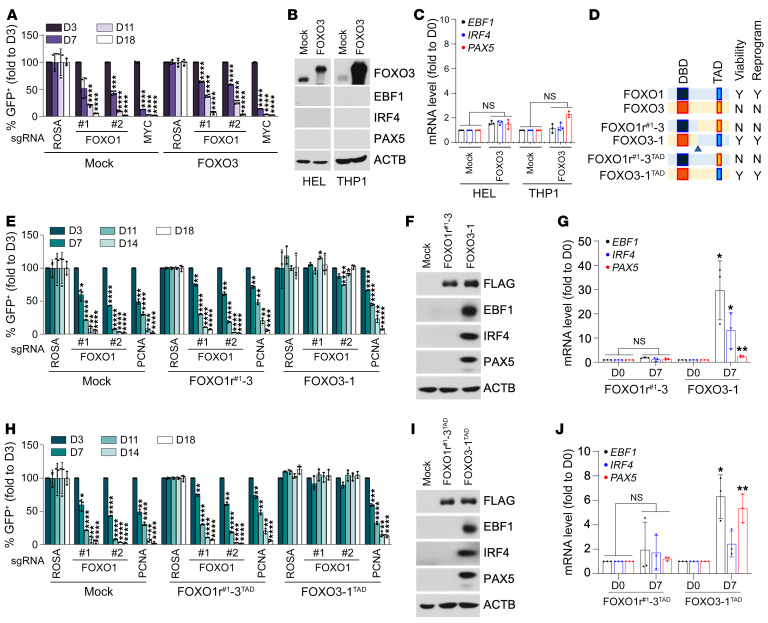
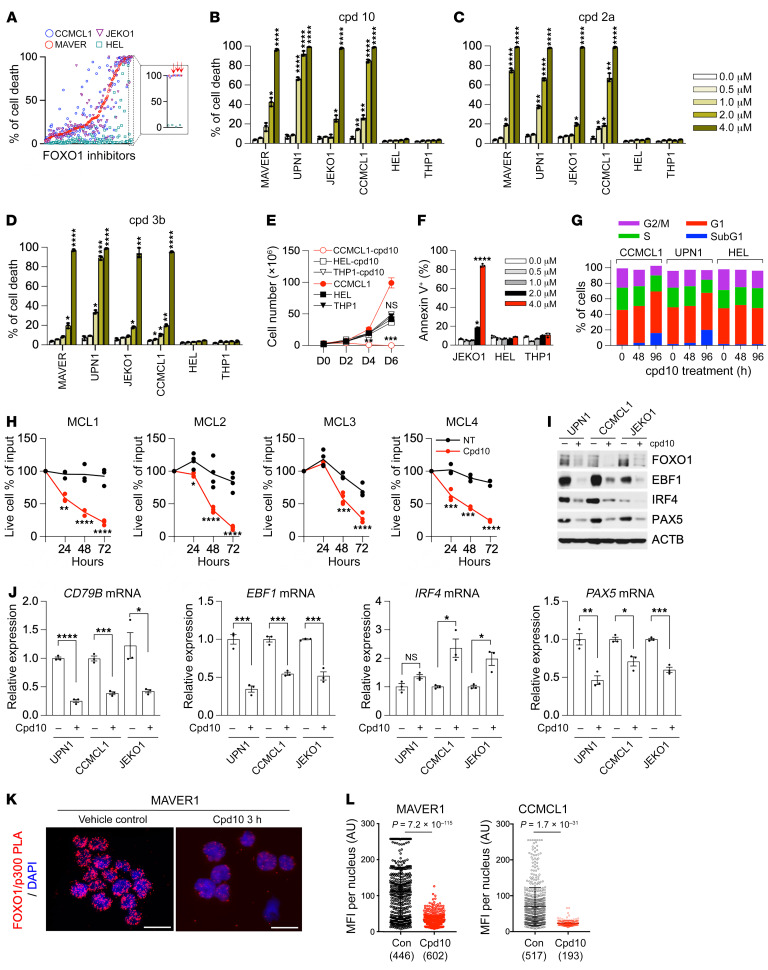
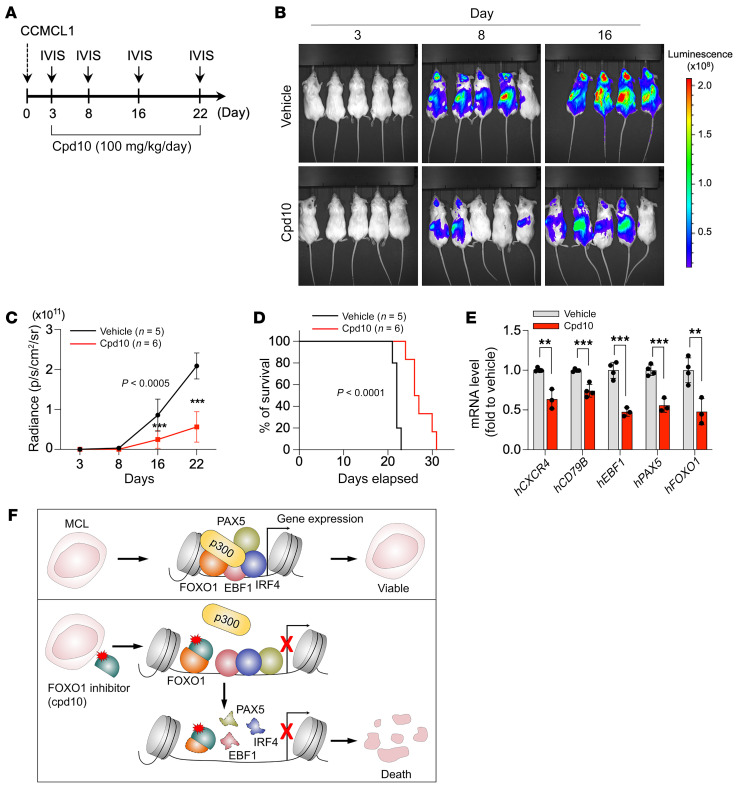
Targeting lineage-defined transcriptional dependencies has emerged as an effective therapeutic strategy in cancer treatment. Through screening for molecular vulnerabilities of mantle cell lymphoma (MCL), we identified a set of transcription factors (TFs) including FOXO1, EBF1, PAX5, and IRF4 that are essential for MCL propagation. Integrated chromatin immunoprecipitation and sequencing (ChIP-Seq) with transcriptional network reconstruction analysis revealed FOXO1 as a master regulator that acts upstream in the regulatory TF hierarchy. FOXO1 is both necessary and sufficient to drive MCL lineage commitment through supporting the lineage-specific transcription programs. We further show that FOXO1, but not its close paralog FOXO3, can reprogram myeloid leukemia cells and induce B-lineage gene expression. Finally, we demonstrate that cpd10, a small molecule identified from an enriched FOXO1 inhibitor library, induces a robust cytotoxic response in MCL cells in vitro and suppresses MCL progression in vivo. Our findings establish FOXO1 inhibition as a therapeutic strategy targeting lineage-driven transcriptional addiction in MCL.

Keywords: Lymphomas; Oncology.


Figures

Figure 1
Figure 1. Domain-focused CRISPR/Cas9 screening identifies core TFs essential for MCL proliferation and survival.
(A) Experimental schematic for the CRISPR/Cas9 screen and the competition-based GFP dropout proliferation assay. (B) Scatterplot analysis of TF dependencies in CCMCL1 cells (y axis) versus HEL cells (x axis) ranked by the average sgRNA log2 fold change (log2FC) of each gene in the pooled CRISPR screen. (C) Heatmap depicts log2FC of sgRNA abundance of selected genes (averaging each independent sgRNA targeting a gene). (D) Competition-based proliferation assays to validate the results from the pooled screen. Experiments were conducted by transduction of Cas9-expressing JEKO1 cells with indicated lentivirus sgRNAs that coexpress a GFP reporter. Plotted is the percentage of GFP-positive cells (normalized to the day 3 measurement) at the indicated time points during culturing. sgRNAs targeting ROSA and MYC are included as a nontargeting negative control and a positive control, respectively. (EH) Verification of on-target effects of sgRNAs against IRF4 (E), PAX5 (F), EBF1 (G), and FOXO1 (H). Competition-based proliferation assays in CCMCL1 cells expressing control or 3× FLAG–tagged and CRISPR-resistant synonymous IRF4 (F-IRF4r#1), PAX5 (F-PAX5r#1), EBF1 (F-EBF1r#1), and FOXO1 (F-FOXO1r#1) mutants. The indicated CRISPR-resistant synonymous mutants were designed specifically for sgIRF4#1, sgPAX5#1, sgEBF1#1, and sgFOXO1#1. (I) Violin plots of RNA expression levels in transcripts per million (TPM) of indicated TFs in patient MCL cells (n = 37). RNA-Seq data were reanalyzed from GSE141336 of Zhao et al. (38). (J and K) Immunoblot analysis of patient MCL cells (J) and patient-derived xenografts (PDX) (K). (DH) Data represent mean ± SEM (n = 3). Results are representative of 2 independent experiments. Statistical analysis was performed using 1-way ANOVA with Tukey’s multiple-comparison test. *P < 0.05, **P < 0.001, ***P < 0.0005, ****P < 0.0001.
Figure 2
Figure 2. Colocalization of MCL survival TFs facilitates collaborative regulation of B cell fate genes.
(A) Heatmap of signals from input, FOXO1, EBF1, PAX5, IRF4, H3K27ac, H3K4m1, and H3K4m3 ChIP-Seq from CCMCL1 cells at ChIP-Seq peaks (number) as well as promoters of UCSC genes. The window extends 5 kb in each direction from the center of ChIP-Seq peaks or transcription start sites. (B) Histogram view of A. (C) Enrichment analysis of genes (number) with ChIP-Seq peak–associated promoters within gene sets highly expressed at each of the 4 developmental stages in the healthy B cells. Adjusted P values were calculated by a hypergeometric test followed by a Benjamini-Hochberg procedure. The black dashed line represents FDR cutoff 0.01. CLP, common lymphoid progenitor. (D and E) Visualization of representative ChIP-Seq tracks for indicated B cell genes. (F and G) Verification of TF regulation in MCL. At 72 hours after transduction of indicated sgRNAs, CCMCL1 or JEKO1 cells were analyzed for PTPRC and PAX5 mRNA levels by RT-qPCR). Data represent mean ± SEM (n = 3). Results are representative of 3 or 4 independent experiments. Statistical analysis in F and G was performed using 2-tailed unpaired Student’s t test. *P < 0.05, **P < 0.005, ***P = 0.0005, ****P < 0.0001.
Figure 3
Figure 3. FOXO1 acts upstream of the MCL lineage regulatory TF hierarchy.
(A) Immunoblot analysis of CCMCL1 cells transduced with EBF1-V5 (left), 3× FLAG–tagged IRF4 (middle), or 3× FLAG–tagged PAX5 (right). (B) Competition-based proliferation assays of sgRNAs against FOXO1 in Cas9-transduced CCMCL1 cells expressing mock control, EBF1-V5, or 3× FLAG–tagged IRF4 or PAX5. (C) Competition-based proliferation assays of sgRNAs against EBF1, IRF4, or PAX5 in control and FOXO1r#1-transduced (resistant for sgRNA#1 of FOXO1) CCMCL1 cells. In B and C, data represent mean ± SEM (n = 3). Results are representative of 3 independent experiments. Statistical analysis was performed using 2-tailed unpaired Student’s t test. The day 13 values of each cell line responding to the same sgRNA were respectively compared. **P < 0.001 ***P < 0.0005, ****P < 0.0001. (D) Immunoblot analysis of CCMCL1 (left) or JEKO1 (right) cells depleted of FOXO1. Lysates were prepared at day 3 after infection of indicated sgRNAs targeting FOXO1. (EH) Immunoblot and RT-qPCR analysis of EBF1, IRF4, or PAX5 induction in FOXO1-transduced HEL (E and F) or THP1 cells (G and H). Cell lysates and total RNA were prepared at indicated time points after infection of FOXO1-encoding lentivirus. In F and H, data represent mean ± SEM (n = 3). Results are representative of 3 independent experiments. Statistical analysis was performed using 1-way ANOVA with Tukey’s multiple-comparison test. *P < 0.05, **P < 0.005, ***P < 0.0005, ****P < 0.0001.
Figure 4
Figure 4. DBD and TAD of FOXO1 are required for its MCL lineage-survival function.
(A) A schematic graph of structural domains of FOXO1 protein. CR, conserved region; DBD, DNA binding domain; TAD, transactivation domain; NLS, nuclear localization sequence; NES, nuclear export sequence. (BE) Systematic evaluation of 167 FOXO1 sgRNAs in negative selection experiments. The location of each sgRNA relative to the FOXO1 protein is indicated along the x axis. The y axis is the fold change of the abundance of individual sgRNAs (ratio of start to end point) in Cas9-expressing CCMCL1 (B), JEKO1 (C), UPN1 (D), and HEL (E) cells after 14 population doublings. (F) Competition-based proliferation assays of sgRNAs against FOXO1 in Cas9-transduced CCMCL1 cells expressing wild-type FOXO1 (FOXO1r#1) or DNA binding–defective mutant (FOXO1H215Rr#1). The FOXO1r#1 and FOXO1H215Rr#1 mutants are CRISPR-resistant to the action of sgFOXO1#1 but sensitive to sgFOXO1#2. Data represent mean ± SEM (n = 3). Results are representative of 3 independent experiments. Statistical analysis was performed using 1-way ANOVA with Tukey’s multiple-comparison test. *P < 0.05, **P < 0.005, ***P < 0.0005, ****P < 0.0001. (G) Immunoblot analysis of control or FOXO1H215Rr#1-expressing CCMCL1 cells at day 3 after transduction of indicated sgRNAs.
Figure 5
Figure 5. TAD of FOXO1 specifies its MCL lineage–supporting activity.
(A) Competition-based proliferation assays for indicated FOXO1-targeted sgRNAs in mock control or FOXO3-transduced CCMCL1 cells. Data represent mean ± SEM (n = 4). (B and C) Immunoblot (B) and RT-qPCR analysis (C) of EBF1, IRF4, or PAX5 expression in FOXO3-transduced HEL or THP1 cells. Cell lysates and total RNA were prepared at day 20 after infection of FOXO3-encoding lentivirus. Data represent mean ± SEM (n = 3). (D) A schematic of domain-swapped FOXO1 and FOXO3 mutants. N, no; Y, yes. (E) Competition-based proliferation assays for indicated FOXO1-targeted sgRNAs in FOXO1r-3–transduced (left) or FOXO3-1–transduced (right) CCMCL1 cells. Data represent mean ± SEM (n = 3). (F and G) Immunoblot (F) and RT-qPCR (G) analysis of EBF1, IRF4, and PAX5 induction in FOXO1r#1-3–transduced (left) or FOXO3-1–transduced (right) THP1 cells. Cell lysates and total RNA were prepared at day 7 after infection of lentivirus encoding indicated variants. Data represent mean ± SEM (n = 3). (H) Competition-based proliferation assays in FOXO1r#1-3TAD–transduced (left) or FOXO3-1TAD–transduced (right) CCMCL1 cells. Data represent mean ± SEM (n = 3). (I and J) Immunoblot (I) and RT-qPCR (J) analysis of EBF1, IRF4, and PAX5 induction in FOXO1r#1-3TAD–transduced (left) or FOXO3-1TAD–transduced (right) THP1 cells. The FOXO1r#1-3TAD variant is CRISPR-resistant to the action of sgFOXO1#1 but remains sensitive to sgFOXO1#2. Data represent mean ± SEM (n = 3). (A, C, E, G, H, and J) Results are representative of 3 independent experiments. Statistical analysis was performed using 1-way ANOVA with Tukey’s multiple-comparison test in A, E, and H and using 2-tailed unpaired Student’s t test in C, G, and J. *P < 0.05, **P < 0.001, ***P < 0.0005, ****P < 0.0001.
Figure 6
Figure 6. Cpd10 is a FOXO1-specific inhibitor that suppresses MCL growth in vitro.
(A) Ranking of cell death induction activity of 144 FOXO1 small-molecule inhibitors. Cell death was measured by TO-PRO-3 cell death assay (Thermo Fisher Scientific) after 6-day treatment of compounds (4 μM) in 4 indicated cell lines. Red arrows point to the selected inhibitors for follow-up studies. (BD) Dose-dependent effect of FOXO1 inhibitors on MCL and AML cell lines. Relative cell death (percent) was determined by TO-PRO-3 staining at day 6 under treatment of the indicated compounds. (E) Growth curve of CCMCL1, HEL, and THP1 cells under cpd10 (2 μM). (F) Percentage of annexin V–positive JEKO1, HEL, and THP1 cells at day 6 following treatment with cpd10 (2 μM). (G) Cell cycle distribution of cells treated with cpd10 (2 μM). (H) Primary MCL cells were cultured with cpd10 (2 μM) or vehicle. Data represent mean ± SEM (n = 4, MCL1, MCL4; n = 3, MCL2, MCL3). Results are representative of 2 independent experiments. (I and J) Immunoblot (I) and RT-qPCR assay (J) of CD79B, EBF1, IRF4, or PAX5 mRNA expression in 3 indicated control and cpd10-treated cell lines. Total RNAs were prepared after 48 hours of treatment. (K) Representative proximity ligation assay (PLA) image of MAVER1 cells demonstrating the inhibition of interaction between FOXO1 and p300 in response to 2 μM cpd10. Scale bars: 20 μm. (L) Quantitation of mean fluorescence intensity (MFI) of PLA signal per nuclei from MAVER1 or CCMCL1 cells. The number of nuclei scored is indicated. (BF, J, and L) Data represent mean ± SEM (n = 3). Results are representative of 3 independent experiments. Statistical analysis was performed using 1-way ANOVA with Tukey’s multiple-comparison test in BD and using 2-tailed unpaired Student’s t test in E, F, H, J, and L. *P < 0.05, **P < 0.001, ***P < 0.0005, ****P < 0.0001.
Figure 7
Figure 7. Pharmacological inhibition of FOXO1 suppresses MCL progression in vivo.
(A) Experimental design of the in vivo treatment. (B) Bioluminescent imaging of CCMCL1 MCL recipient mice at the indicated day after initiation of treatment with cpd10 (100 mg/kg/d) or vehicle control. (C) Quantification of bioluminescent imaging responses to cpd10 treatment. Mean values of vehicle-treated (n = 5) and cpd10-treated (n = 6) mice are shown. Data represent mean ± SEM (n = 5 or 6). Results are representative of 2 independent experiments. Statistical analysis was performed using 2-tailed unpaired Student’s t test. ***P < 0.0005. (D) Kaplan-Meier survival curves of control and cpd10-treated mice. Statistical significance was determined using a log-rank test. (E) RT-qPCR analysis of indicated human genes in vehicle- and cpd10-treated spleens of CCMCL1 MCL recipient mice. Data represent mean ± SEM (n = 3 or 4). Results are representative of 2 independent experiments. Statistical analysis was performed using 2-tailed unpaired Student’s t test. **P < 0.005, ***P < 0.0005. (F) Predicted model of MCL lineage-survival transcriptional program and its dissolution following targeted inhibition of FOXO1.

References

    1. Hill HA, et al. Genetic mutations and features of mantle cell lymphoma: a systematic review and meta-analysis. Blood Adv. 2020;4(13):2927–2938. doi: 10.1182/bloodadvances.2019001350. - DOI - PMC - PubMed
    1. Khouri IF, et al. Hyper-CVAD and high-dose methotrexate/cytarabine followed by stem-cell transplantation: an active regimen for aggressive mantle-cell lymphoma. J Clin Oncol. 1998;16(12):3803–3809. doi: 10.1200/JCO.1998.16.12.3803. - DOI - PubMed
    1. Ghielmini M, Zucca E. How I treat mantle cell lymphoma. Blood. 2009;114(8):1469–1476. doi: 10.1182/blood-2009-02-179739. - DOI - PubMed
    1. Wang ML, et al. Targeting BTK with ibrutinib in relapsed or refractory mantle-cell lymphoma. N Engl J Med. 2013;369(6):507–516. doi: 10.1056/NEJMoa1306220. - DOI - PMC - PubMed
    1. Maddocks K, Blum KA. Treatment strategies in mantle cell lymphoma. Cancer Treat Res. 2015;165:251–270. doi: 10.1007/978-3-319-13150-4_10. - DOI - PubMed

Publication types

Substances