. 2023 Jan 3;133(1):e163235.
doi: 10.1172/JCI163235.

The Notch1/CD22 signaling axis disrupts Treg function in SARS-CoV-2-associated multisystem inflammatory syndrome in children

Collaborators, Affiliations

The Notch1/CD22 signaling axis disrupts Treg function in SARS-CoV-2-associated multisystem inflammatory syndrome in children

Mehdi Benamar et al. J Clin Invest. .

Abstract

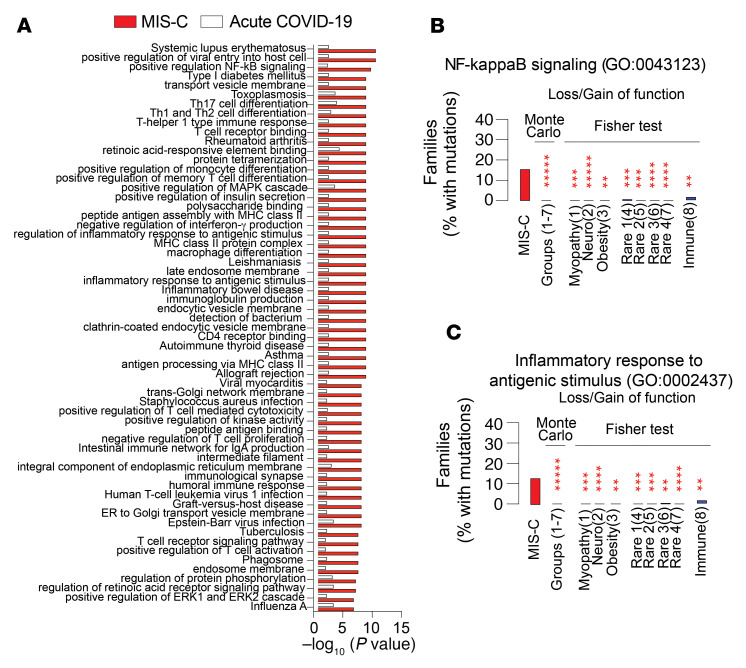
Multisystem inflammatory syndrome in children (MIS-C) evolves in some pediatric patients following acute infection with SARS-CoV-2 by hitherto unknown mechanisms. Whereas acute-COVID-19 severity and outcomes were previously correlated with Notch4 expression on Tregs, here, we show that Tregs in MIS-C were destabilized through a Notch1-dependent mechanism. Genetic analysis revealed that patients with MIS-C had enrichment of rare deleterious variants affecting inflammation and autoimmunity pathways, including dominant-negative mutations in the Notch1 regulators NUMB and NUMBL leading to Notch1 upregulation. Notch1 signaling in Tregs induced CD22, leading to their destabilization in a mTORC1-dependent manner and to the promotion of systemic inflammation. These results identify a Notch1/CD22 signaling axis that disrupts Treg function in MIS-C and point to distinct immune checkpoints controlled by individual Treg Notch receptors that shape the inflammatory outcome in SARS-CoV-2 infection.

Keywords: Adaptive immunity; COVID-19; Immunology; T cells; Tolerance.


Figures

Figure 1
Figure 1. Increased CD4+ T cell activation and Treg destabilization in MIS-C.
Circulating CD4+ T cells from control and pre- and post-treatment MIS-C individuals were studied with 10x Genomics. (A) Uniform manifold approximation and projection (UMAP) of normalized and harmonized data set, split by disease group and color coded by cell type. Cell identities were defined by mapping the data to a reference human PBMC data set with Azimuth. (B) Frequencies (percentage) of each cell type among total CD4+ T cells for each patient, as determined with scRNA-Seq. (C and D) Data on log2 fold change (LFC) in gene expression derived from independent pseudobulk DEA of pretreatment MIS-C patients versus healthy controls (x axis) and of pretreatment MIS-C versus post-treatment MIS-C patients (y axis) in Tregs (C) and activated Tconv cells (D). For each cell type, genes differentially expressed (P < 0.2) in pretreatment MIS-C versus both control and post-treatment individuals are highlighted (blue: LFC <0, red: LFC >0). (E and F) Heatmaps of all genes found to be significantly (P < 0.05) differentially expressed in Tregs (E) and Tconv cells (F) according to pseudobulk DEA comparing results for pretreatment MIS-C versus control and pretreatment MIC-C versus post-treatment individuals. (G and H) LFC distributions of genes belonging to each of the corresponding enriched hallmarks. GSEA was run against the MSigDB hallmark database using ranked LFCs derived from pseudobulk DEAs of Tregs from pretreatment MIS-C patients versus controls. adj, adjusted; tx, treatment.
Figure 2
Figure 2. Increased Notch1 expression on circulating CD4+ Tregs and Tconv cells in MIS-C.
(AF) Flow cytometric analysis, cell frequencies, and MFI of Notch1 (AC) and Notch4 (DF) expression in CD4+ Tregs and Tconv cells from healthy controls, patients with KD, adult patients with severe COVID-19, pediatric patients with mild or severe COVID-19, and patients with MIS-C. (G) Flow cytometric analysis and MFI of N1c in CD4+ Tregs from healthy controls (HC) and pediatric patients with severe COVID-19 or MIS-C. (H) serum concentrations of IL-1β, IL-6, TNF, IFN-α, IFN-λ2/3, IFN-γ IL-10, and IP-10 in control and the respective patient group individuals. (I) Flow cytometric analysis and frequencies of Notch1 expression on anti-CD3– and anti-CD28–activated CD4+ human Tregs treated with the indicated cytokines. Each symbol represents 1 individual. Numbers in flow plots indicate percentages. Error bars indicate the SEM. *P < 0.05, **P < 0.01, ***P < 0.001, and ****P < 0.0001, by 1-way ANOVA with Dunnett’s post hoc analysis (AE, H, and I).
Figure 3
Figure 3. Identification of the genetic pathway operative in MIS-C.
(A) KEGG and GO pathways differentially enriched in rare mutations in patients with MIS-C versus pediatric patients with acute COVID-19 (severe and mild) by Monte Carlo simulation and Fisher’s exact test as described in Methods. (B and C) Frequency of mutations in 2 representative pathways: “positive regulation of NF-κB signaling”(B) and “inflammatory response to antigenic stimulus” (C), identified in A versus other disease groups, either collectively by Monte Carlo simulation or individually by Fisher’s exact test. **P < 0.01, ***P < 0.001, ****P < 0.0001, and *****P < 0.00001, by Monte Carlo simulation and Fisher’s exact test.
Figure 4
Figure 4. Identification of NUMB/NUMBL genetic variants in MIS-C.
(A) Schematic representation of NUMB and NUMBL mutations identified in patients with MIS-C. (B and C) Expression of recombinant WT NUMB (NUMBWT) and NUMBLeu94Phe (B), and NUMBLWT, NUMBLSer79Ile, and NUMBLVal88Met (C) proteins in NUMB/NUMBL-deficient HEK293 cells. (D and E) Flow cytometric analysis and fold change in expression of Notch1 and N1c in NUMB/NUMBL-deficient HEK293 cell transfected with NUMBLeu94Phe protein (D) or NUMBLSer79Ile or NUMBLVal88Met protein (E), either alone or together with the respective WT protein. Error bars indicate the SEM. *P < 0.05, **P < 0.01, and ****P < 0.0001, by 1-way ANOVA with Dunnett’s post hoc analysis (BE). FSC-W, forward scatter width.
Figure 5
Figure 5. Poly I:C–induced multiorgan inflammatory disease in Foxp3EGFPCre R26N1c/+ mice.
(A) Experimental scheme. Mice were injected i.p. with poly I:C daily for 12 days. (B and C) Weight indices of Foxp3EGFPCre and Foxp3EGFPCre R26N1c/+ mice subjected to poly I:C treatment. (D) H&E-stained sections and inflammation score for liver, gut, and lung tissues isolated from mice in the indicated groups (original magnification, ×200). (E) Flow cytometric analysis and graphical representation of naive (CD4+CD44CD62L+) and activated (CD4+CD44+CD62L) Tconv cells. (F and G) Flow cytometric analysis and graphical representation of IFN-γ and IL-17 expression in Tconv cells (F) and Tregs (G) in the respective poly I:C–treated mouse groups. (H) Flow cytometric analysis and graphical representation of α4β7 expression in Tregs and Tconv cells from mice in the indicated groups. (I) Flow cytometric analysis and graphical representation of α4β7 expression in Tregs and Tconv cells from individuals in the indicated groups. (J) Relative expression of ITGB7 in the different clusters inferred from scRNA-Seq data. Max, maximum; Min, minimum. (K) Flow cytometric analysis and cell frequencies of α4β7 (ITGB7) expression on circulating CD4+FOXP3+ Tregs in healthy controls and patients with MIS-C before and after treatment. (L and M) Frequencies of cells expressing Notch1 (L) and CD22 (M) on circulating CD4+FOXP3+ Tregs from healthy controls and patients with MIS-C before and after treatment. Each symbol represents 1 mouse (BI), 1 cell (J), or 1 human (I and KM). Numbers in the flow plots indicate percentages. Error bars indicate the SEM. *P < 0.05, **P < 0.01, ***P < 0.001, and ****P < 0.0001, by 2-way ANOVA with Šidák’s post hoc analysis (B), Student’s t test (C and D), and 1-way ANOVA with Dunnett’s post hoc analysis (EI, and KM).
Figure 6
Figure 6. Notch1 destabilizes Treg-suppressive function by a CD22-dependent mechanism.
(A) Flow cytometric analysis and graphical representation of CD22 expression on splenic Tregs and Tconv cells of poly I:C–treated Foxp3EGFPCre and Foxp3EGFPCre R26N1c/+ mice. (B) Flow cytometric analysis and cell frequencies of CD22 expression on circulating CD4+FOXP3+ Treg and CD4+FOXP3 Tconv cells from healthy controls and patients with either mild pediatric COVID or MIS-C. (C) Correlation analysis of CD22 expression on Tregs and Tconv cells of patients with MIS-C and controls as a function of Notch1 expression on these cells. (D) In vitro suppression of Tconv cell proliferation by Foxp3EGFPCre and CD22+ Foxp3EGFPCre R26N1c/+ Tregs in the presence of increasing concentrations of anti-CD22 mAb. (E) In vitro suppression of human Tconv cell proliferation by Tregs isolated from healthy controls or patients with MIS-C in the absence of presence of anti-CD22 mAb. CTV, Cell Trace Violet. Each symbol represents 1 mouse (A) or 1 human (B and C). Numbers in flow plots indicate percentages. Error bars indicate the SEM. *P < 0.05, **P < 0.01, ***P < 0.001, and ****P < 0.0001, by Student’s t test (A), 1-way ANOVA with Dunnett’s post hoc analysis (B), 2-way ANOVA with Sidak’s post hoc analysis (D and E), and Pearson’s correlation analysis (C).
Figure 7
Figure 7. A Treg Notch1/CD22 axis promotes multiorgan inflammation.
(A) Experimental scheme. Mice were injected i.p. with poly I:C daily for 12 days. (B) Weight indices of Foxp3EGFPCre and Foxp3EGFPCre R26N1c/+ mice subjected to poly I:C treatment. (C) H&E-stained sections and inflammation score of liver, gut, and lung tissues isolated from the indicated mouse groups (original magnification, ×200). (D) Flow cytometric analysis and graphical representation of naive (CD4+CD44CD62L+) and activated (CD4+CD44+CD62L) Tconv cells. (E) Flow cytometric analysis and graphical representation of IFN-γ and IL-17 expression in Tconv cells (E) and Tregs (F) from mice in the respective poly I:C treatment groups. (F) Flow cytometric analysis and graphical representation of α4β7 expression in Tregs and Tconv cells from mice in the indicated groups. (G) Frequencies and number of splenic Tregs in the respective groups. Each symbol represents 1 mouse (BH). Numbers in the flow plots indicate percentages. Error bars indicate the SEM. *P < 0.05, **P < 0.01, ***P < 0.001, and ****P < 0.0001, by 2-way ANOVA with Šidák’s post hoc analysis (B) and 1-way ANOVA with Dunnett’s post hoc analysis (BG).
Figure 8
Figure 8. CD22 augments TCR signaling in Tregs.
(A) Flow cytometric analysis and MFI of colonic markers of Tregs from poly I:C–treated Foxp3EGFPCre and Foxp3EGFPCreR26N1c/+ mice cotreated with isotype a control mAb or an anti-CD22 mAb. (B) Flow cytometric analysis and MFI of p-Erk and p–PLC-γ expression induced by anti-CD3 mAb treatment of Foxp3EGFPCre and CD22+ Foxp3EGFPCreR26N1c/+ Tregs. (C) Flow cytometric analysis and MFI of p-S6 and p-AKT (T308) expression induced by anti-CD3 mAb treatment of Foxp3EGFPCre and CD22+ Foxp3EGFPCreR26N1c/+ Tregs. Numbers in the flow plots indicate percentages or MFI. Each symbol represents 1 mouse (AC). Error bars indicate the SEM. *P < 0.05, **P < 0.01, ***P < 0.001, and ****P < 0.0001, by 1-way ANOVA with Dunnett’s post hoc analysis (A) and 2-way ANOVA with Šidák’s post hoc analysis (B and C).
Figure 9
Figure 9. CD22 destabilizes Tregs by an mTOR-dependent mechanism.
(A and B) Flow cytometric analysis (A) and MFI (B) of p-S6 expression induced by anti-CD3 mAb treatment of Foxp3EGFPCre and CD22+ Foxp3EGFPCreR26N1c/+ Tregs that were treated or not with anti-CD22 mAb. (C and D) Foxp3 MFI in Tregs from in vitro suppression of Tconv cell proliferation by Foxp3EGFPCre and CD22+ Foxp3EGFPCreR26N1c/+ Tregs in the presence of increasing concentrations of anti-CD22 mAb. (E and F) In vitro suppression of Tconv cell proliferation by Foxp3EGFPCre and CD22+ Foxp3EGFPCreR26N1c/+ Tregs in the presence of increasing concentrations of rapamycin. (G) Foxp3+ MFI in Tregs from in vitro suppression of Tconv cell proliferation by Foxp3EGFPCre and CD22+ Foxp3EGFPCreR26N1c/+ Tregs in the presence of increasing concentrations of rapamycin. Numbers in flow plots indicate percentages or MFI. Each symbol represents 1 mouse (AG). Error bars indicate the SEM. *P < 0.05, **P < 0.01, ***P < 0.001, and ****P < 0.0001, by 2-way ANOVA with Šidák’s post hoc analysis (B, D, F, and G).

Comment in

References

    1. Cucinotta D, Vanelli M. WHO declares COVID-19 a pandemic. Acta Biomed. 2020;91(1):157–160. - PMC - PubMed
    1. Hu B, et al. Characteristics of SARS-CoV-2 and COVID-19. Nat Rev Microbiol. 2021;19(3):141–154. doi: 10.1038/s41579-020-00459-7. - DOI - PMC - PubMed
    1. Berlin DA, et al. Severe covid-19. N Engl J Med. 2020;383(25):2451–2460. doi: 10.1056/NEJMcp2009575. - DOI - PubMed
    1. Zhou F, et al. Clinical course and risk factors for mortality of adult inpatients with COVID-19 in Wuhan, China: a retrospective cohort study. Lancet. 2020;395(10229):1054–1062. doi: 10.1016/S0140-6736(20)30566-3. - DOI - PMC - PubMed
    1. Richardson S, et al. Presenting characteristics, comorbidities, and outcomes among 5700 patients hospitalized with COVID-19 in the New York City area. JAMA. 2020;323(20):2052–2059. doi: 10.1001/jama.2020.6775. - DOI - PMC - PubMed

Publication types

Supplementary concepts