. 2022 Oct 25;20(10):e3001854.
doi: 10.1371/journal.pbio.3001854. eCollection 2022 Oct.

cNap1 bridges centriole contact sites to maintain centrosome cohesion

Affiliations

cNap1 bridges centriole contact sites to maintain centrosome cohesion

Robert Mahen. PLoS Biol. .

Abstract

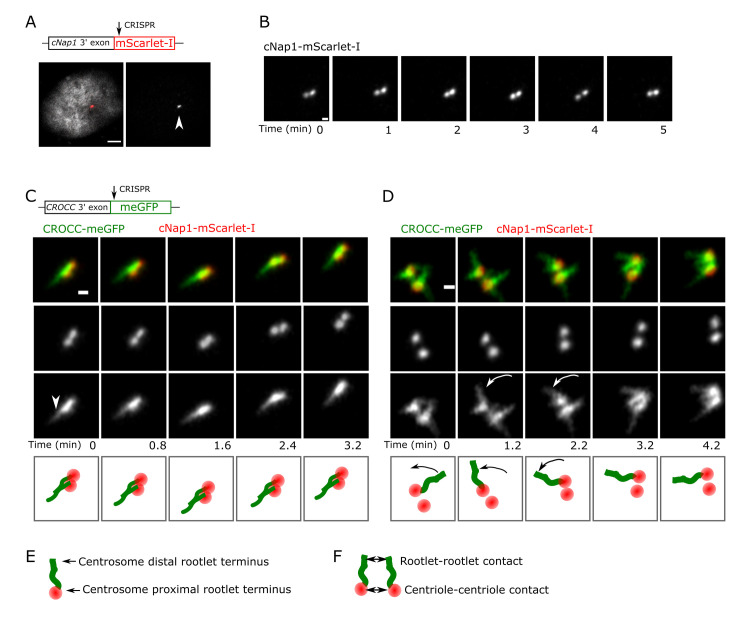
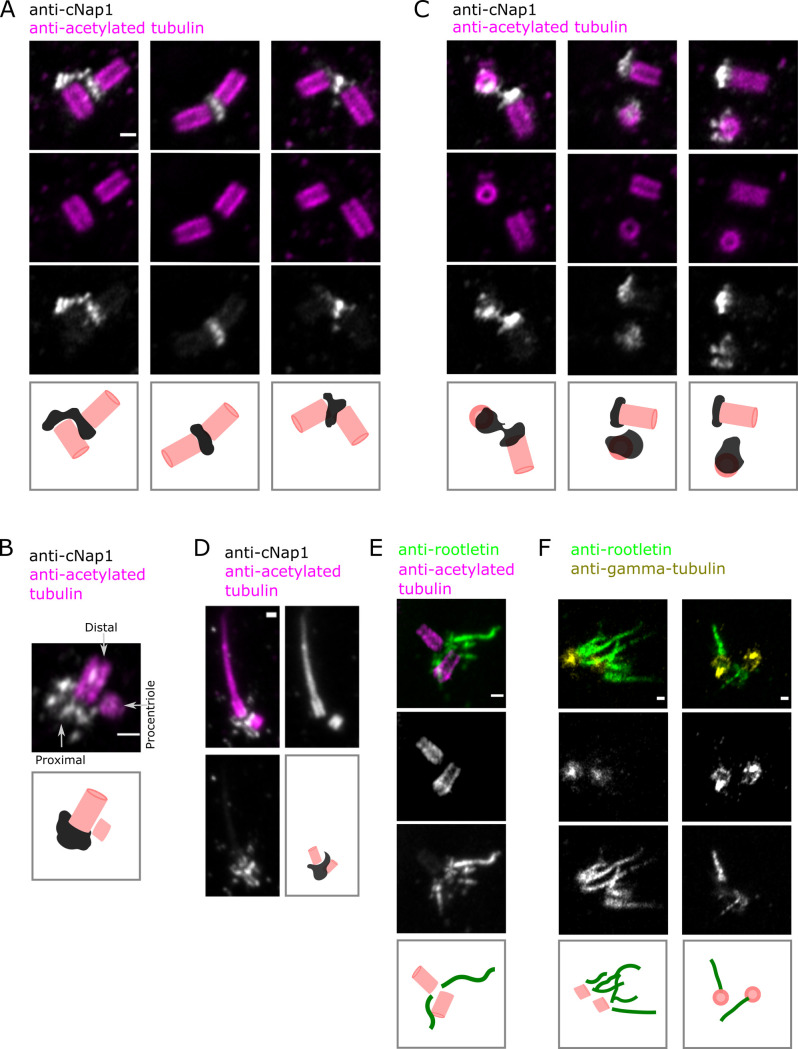
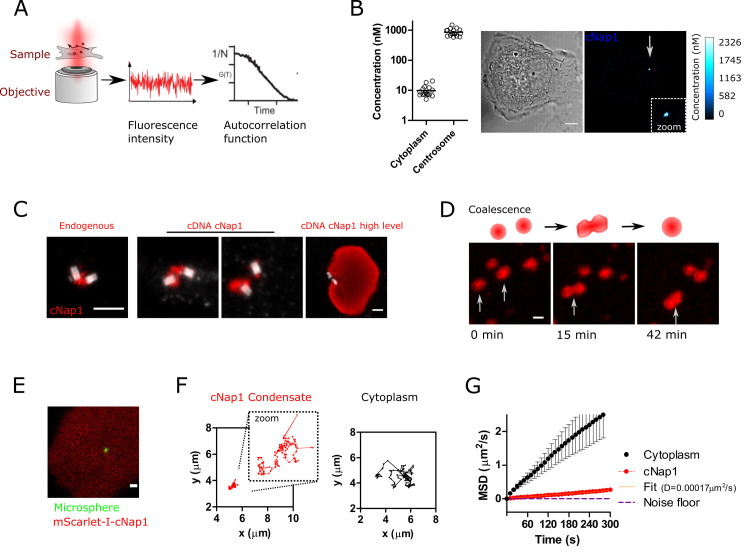
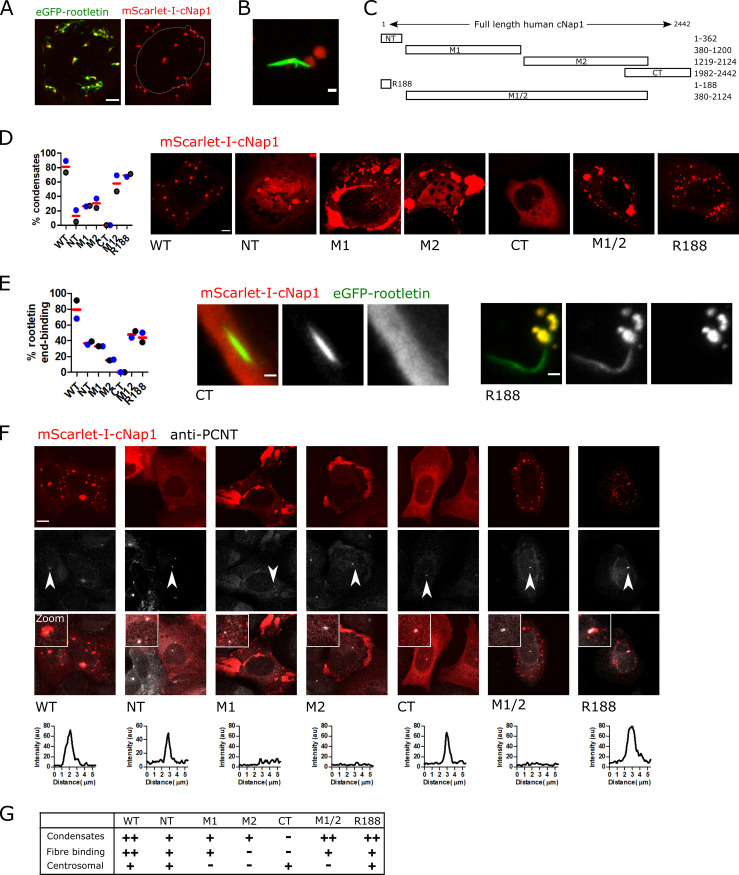
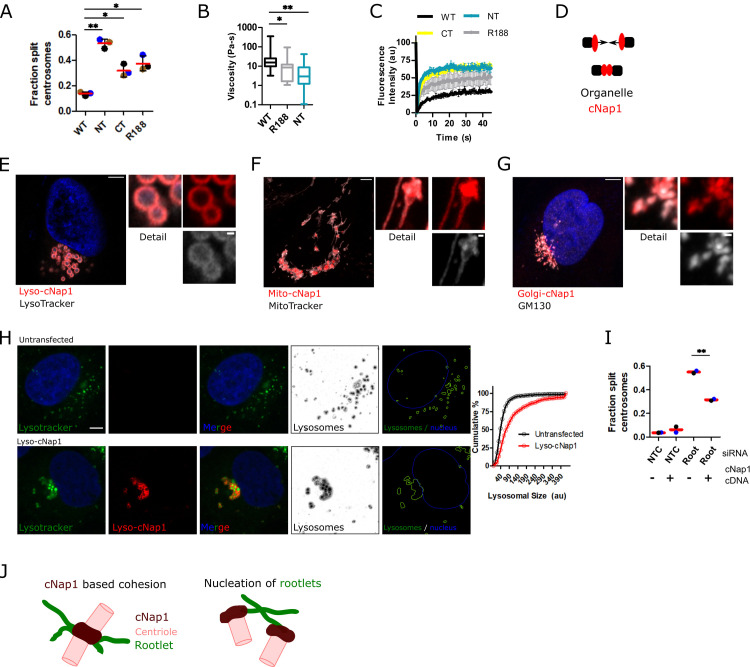
Centrioles are non-membrane-bound organelles that participate in fundamental cellular processes through their ability to form physical contacts with other structures. During interphase, two mature centrioles can associate to form a single centrosome-a phenomenon known as centrosome cohesion. Centrosome cohesion is important for processes such as cell migration, and yet how it is maintained is unclear. Current models indicate that pericentriolar fibres termed rootlets, also known as the centrosome linker, entangle to maintain centriole proximity. Here, I uncover a centriole-centriole contact site and mechanism of centrosome cohesion based on coalescence of the proximal centriole component cNap1. Using live-cell imaging of endogenously tagged cNap1, I show that proximal centrioles form dynamic contacts in response to physical force from the cytoskeleton. Expansion microscopy reveals that cNap1 bridges between these contact sites, physically linking proximal centrioles on the nanoscale. Fluorescence correlation spectroscopy (FCS)-calibrated imaging shows that cNap1 accumulates at nearly micromolar concentrations on proximal centrioles, corresponding to a few hundred protein copy numbers. When ectopically tethered to organelles such as lysosomes, cNap1 forms viscous and cohesive assemblies that promote organelle spatial proximity. These results suggest a mechanism of centrosome cohesion by cNap1 at the proximal centriole and illustrate how a non-membrane-bound organelle forms organelle contact sites.


Conflict of interest statement

The author has declared that no competing interests exist.

Figures

Fig 1
Fig 1. Proximal centriole pairs and rootlets form dynamic contacts during centrosome cohesion.
(A) Endogenously tagged cNap1-mScarlet-I localises to regions of high concentration at proximal centrioles (denoted by the arrow). A merged image showing both cNap1-mScarlet-I and the nucleus is shown on the left panel, the right panel shows only cNap1-mScarlet-I. The nucleus is labelled with Hoechst 33342. Scale: 3 μm. (B) Time-lapse imaging of endogenously tagged cNap1-mScarlet-I at 1-min intervals shows dynamic contacts. The images show a single z-slice from 3D data. Scale: 0.5 μm. (C and D) Time-lapse 2-colour Airyscan imaging of endogenously tagged cNap1-mScarlet-I and rootletin-meGFP. Scale: 0.5 μm. The arrowhead in (C) denotes a potential point of contact between rootlets from different centrioles. The arrows in (D) denote independent movement of a rootlet distal terminus relative to other rootlets. (E) Cartoon depiction of the arrangement of cNap1 and rootletin at centrosomes; centrosome proximal cNap1-mScarlet-I is attached to rootlet termini. (F) Cartoon depiction of either rootlet–rootlet or centriole–centriole contact sites. Data underlying this figure can be found in S1–S3 Movies.
Fig 2
Fig 2. Endogenous cNap1 bridges proximal centrioles at the nanoscale.
(A–C) U-ExM of centrioles labelled with anti-acetylated tubulin antibody (pink) and cNap1 labelled with anti-cNap1 antibody (grey). The images show single Airyscan z-slices. Cartoons depict simplified centriole and cNap1 orientations. (D) ExM of centrioles labelled with anti-acetylated tubulin antibody (pink) and cNap1 labelled with anti-cNap1 antibody (grey) in a ciliated HPNE cell. The image shows a maximum intensity projection from 3D data. The cartoon depicts only the ciliary base region for simplicity. (E) U-ExM of rootlets stained with anti-rootletin antibody (green) and centrioles stained with anti-acetylated tubulin antibody (pink). (F) U-ExM of rootlets stained with anti-rootletin antibody (green) and centrioles stained with gamma-tubulin antibody (yellow). Single z-slices are shown. Panels (A), (C), (E), (F) show wild-type U2OS, (B) is endogenously tagged cNap1-mScarlet-I U2OS and (D) shows hTERT-HPNE cells. Across all panels, the scale is 200 nm, and each column represents a different cell. Data underlying this figure can be found in S2 Fig. U-ExM, ultra-expansion microscopy.
Fig 3
Fig 3. cNap1 forms viscous condensates.
(A) Schematic of FCS measurements. Fluorescence fluctuations within a confocal volume are converted into absolute concentrations using the FCS autocorrelation function and measurements of the confocal volume size. Image intensities are converted from arbitrary fluorescence intensities into concentration maps. (B) FCS-calibrated imaging of homozygously tagged endogenous cNap1-mScarlet-I, either in the cytoplasm or the centrosome of U2OS cells. The representative image shows a single cell, coloured relative to cNap1 concentration. Scale: 5μm. The dot plot horizontal lines show the mean from a population of cells and each dot represents a single cell. (C) Comparative U-ExM of endogenous cNap1 and cDNA-expressed cNap1. Each panel shows a different cell and cNap1 is shown in red. Centrioles are marked by anti-acetylated tubulin staining (white). Scale: 1 μm throughout. The panels show different sized areas. (D) Live-cell time-lapse imaging of mScarlet-I-cNap1, showing coalescence. Maximum intensity projections are shown. Scale: 1 μm. (E) Green fluorescent microsphere (green) embedded within mScarlet-I-cNap1 (red). A single z-slice is shown. Scale: 1 μm. (F) Two example trajectories of bead movement when either embedded in cNap1 (left, red) or in the cytoplasm (right, black). (G) MSD of microspheres embedded in cNap1 (red) or in the cytoplasm (black). The lines show weighted means (±SEM) from N = 51 (transfected, condensate) and N = 43 (untransfected, cytoplasm) tracks taken in 3 independent experiments. The orange line shows the fit from which the diffusion coefficient of 0.00017 μm2/s was calculated (R2 = 0.996). The noise floor is plotted as a dashed purple line, obtained through measurement of immobilised beads with the same imaging conditions. The data underlying the plots can be found in S1 Raw Data. FCS, fluorescence correlation spectroscopy; MSD, mean squared displacement; U-ExM, ultra-expansion microscopy.
Fig 4
Fig 4. cNap1 condensate formation promotes rootlet end-binding but not centrosomal localisation.
(A) Co-overexpression of mScarlet-I-cNap1 (red) and eGFP-rootletin (green) in a single cell. Scale: 5 μm. The white line indicates the location of the nucleus for reference. (B) Detailed view of cytoplasmic mScarlet-I-cNap1 associated with eGFP-rootletin fibre. Scale bar: 1 μm. (C) Schematic representation of cNap1 protein truncations. Numbers denote amino acids from the N-terminus. (D) Cytoplasmic condensate formation by cNap1 truncations. Approximately 300 cells were measured in each condition from 2 biological replicates. Each dot depicts the mean percentage of cells containing >1 condensate, colour coded according to replicate. The red horizontal bars show the mean of the experimental repeats. The images show a representative example cell with condensates (except CT, which has none). Scale: 5 μm. (E) Rootletin fibre binding by cNap1 truncations. The graph plots the percentage of rootletin fibres associated with cNap1 condensates, where each dot represents the mean from an independent experiment, and the red horizontal line indicates the mean of the experimental repeats. Approximately 300 cells were measured in each condition. Cells without condensates were excluded from the analysis. The images show a representative rootletin fibre (green) with cNap1 CT or R188 (red). Scale: 10 μm. (F) Centrosomal localisation of cNap1 truncations. The representative confocal images show mScarlet-I-cNap1 truncations (red) and co-staining of centrosomes with anti-PCNT antibody (white). Centrosomes are indicated by the arrows. Maximum intensity projections are shown. The “smooth” function was used in Fiji and image brightness and contrast are changed for display purposes. The graphs plot a line profile of the intensity of cNap1 across the centrosome in the image. Scale: 10 μm. (G) Summary of ectopic mScarlet-I-cNap1 truncation properties, from the experiments in (D–F). ++, +, and–denote decreasing amounts, respectively. The data underlying the plots can be found in S1 Raw Data.
Fig 5
Fig 5. cNap1 is sufficient for organelle cohesion.
(A) cNap1 truncations NT, CT, and R188 disrupt centrosome cohesion. The bar graph plots the percentage of cells with centrioles separated >1.6 μm, determined from anti-PCNT staining and confocal imaging, in 3 experiments, measuring in a minimum of 83 cells in total per condition. The mean and the standard deviation are shown. Dots represent biological repeats, colour coded in sets. The asterisks denote significant differences by paired t test (WT vs. NT P = 0.0014, WT vs. CT P = 0.0379, WT vs. R188 P = 0.0209). (B) Viscosity of cNap1 wild type, NT and R188 truncations calculated from the MSD of microsphere movement within them. The box and whiskers plot shows the min to max values and the middle horizontal bars the medians, from 51, 40, and 20 tracks, respectively. (C) cNap1 truncations NT, CT, and R188 have an increased rate of FRAP recovery at centrosomes relative to wild type. The graph plots the mean and standard deviation of 3 separate experiments. Approximately 30 cells were measured in each condition. (D) Theory that organelle-associated cNap1 promotes organelle spatial proximity. (E) Lyso-cNap1 (red) forms spherical structures coating LysoTracker positive vesicles (grey). The image shows an Airyscan confocal z-slice. Scale in large image: 5 μm, scale in detail image: 0.5 μm. (F) Mito-cNap1 (red) localises adjacent to mitochondria as marked by MitoTracker (grey). Scale in large image: 5 μm, scale in detail image: 0.5 μm. (G) Golgi-cNap1 (red) forms elongated structures adjacent to the Golgi, as shown by co-staining with GM130 (grey). Scale in large image: 5 μm, scale in detail image: 0.5 μm. (H) LysoTracker positive vesicle localisation in the presence or absence of lyso-cNap1 (bottom and top panels, respectively). The images show Airyscan z-slices of lyso-cNap1 (red), LysoTracker (green), and DNA Hoechst 33342 (blue). The inverted images (marked “lysosomes”) show automated LysoTracker probability segmentation produced in Ilastik. The images marked “lysosomes and nuclei” show binary segmentation produced in CellProfiler. The cumulative histogram quantitates LysoTracker positive vesicle size either with or without lyso-cNap1 expression in approximately 500 cells. (I) Loss of centrosome cohesion caused by rootletin siRNA is partially rescued by mScarlet-I-cNap1. The bar graph plots the percentage of cells with centrioles separated >1.6 μm, determined from anti-PCNT staining and confocal imaging. Each dot is colour coded according to biological replicate and the horizontal bars show the mean (±SD) of the replicates. The asterisk denotes a significant difference by paired t test (P = 0.0084). (J) Model of cNap1-based centrosome cohesion. Centrosomes are formed from 2 mature centrioles that dynamically split and rejoin during interphase. cNap1 accumulates at the proximal end of each centriole, at a concentration of approximately 1 μm and bridges across centriole contact sites, acting as a molecular glue that balances force from the cytoskeleton with cohesion. In parallel, cNap1 promotes rootlet formation or anchoring through binding to rootletin fibre termini. Both rootlets and cNap1 contribute to centrosome cohesion. The data underlying the plots can be found in S1 Raw Data. FRAP, fluorescence recovery after photobleaching; MSD, mean squared displacement; siRNA, small interfering RNA.

Update of

References

    1. Eisenberg-Bord M, Shai N, Schuldiner M, Bohnert M. A Tether Is a Tether Is a Tether: Tethering at Membrane Contact Sites. Dev Cell. 2016;39:395–409. doi: 10.1016/j.devcel.2016.10.022 - DOI - PubMed
    1. Nigg EA, Stearns T. The centrosome cycle: Centriole biogenesis, duplication and inherent asymmetries. Nat Cell Biol. 2011;13:1154–1160. doi: 10.1038/ncb2345 - DOI - PMC - PubMed
    1. Bahe S, Stierhof Y-D, Wilkinson CJ, Leiss F, Nigg EA. Rootletin forms centriole-associated filaments and functions in centrosome cohesion. J Cell Biol. 2005;171:27–33. doi: 10.1083/jcb.200504107 - DOI - PMC - PubMed
    1. Bornens M, Paintrand M, Berges J, Marty MC, Karsenti E. Structural and chemical characterization of isolated centrosomes. Cell Motil Cytoskeleton. 1987;8:238–249. doi: 10.1002/cm.970080305 - DOI - PubMed
    1. Chen JV, Kao L-R, Jana SC, Sivan-Loukianova E, Mendonça S, Cabrera OA, et al.. Rootletin organizes the ciliary rootlet to achieve neuron sensory function in Drosophila. J Cell Biol. 2015;211:435–453. doi: 10.1083/jcb.201502032 - DOI - PMC - PubMed

Publication types