. 2023 Jan 4;83(1):34-48.
doi: 10.1158/0008-5472.CAN-22-2682.

Spatial Transcriptomic Analysis of a Diverse Patient Cohort Reveals a Conserved Architecture in Triple-Negative Breast Cancer

Affiliations

Spatial Transcriptomic Analysis of a Diverse Patient Cohort Reveals a Conserved Architecture in Triple-Negative Breast Cancer

Rania Bassiouni et al. Cancer Res. .

Abstract

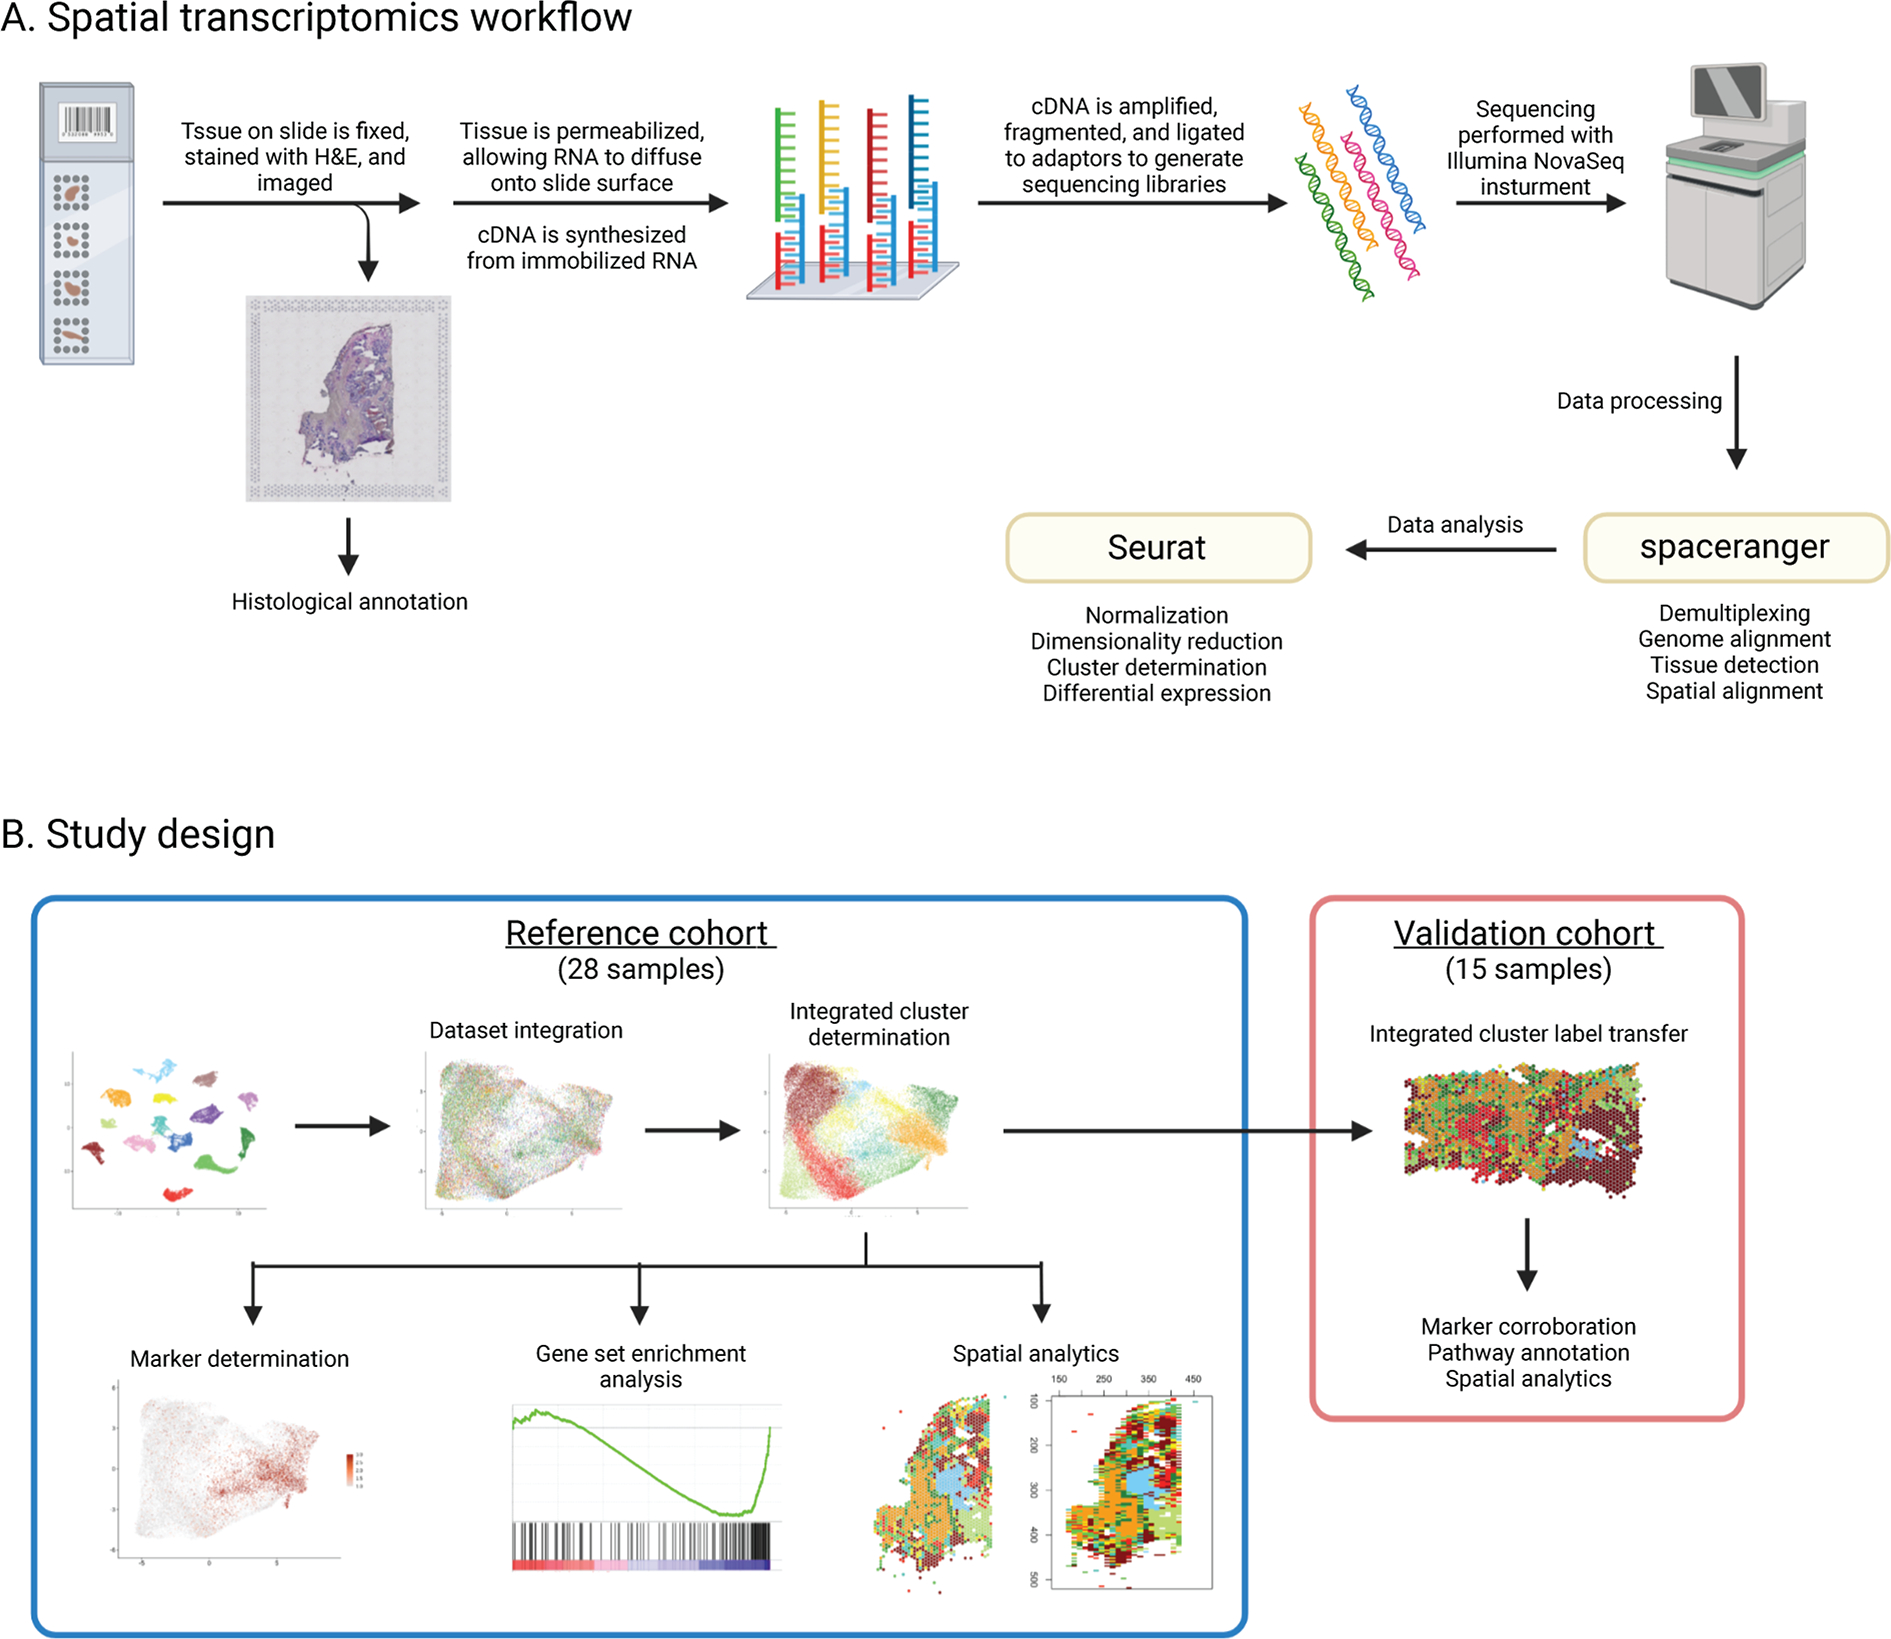
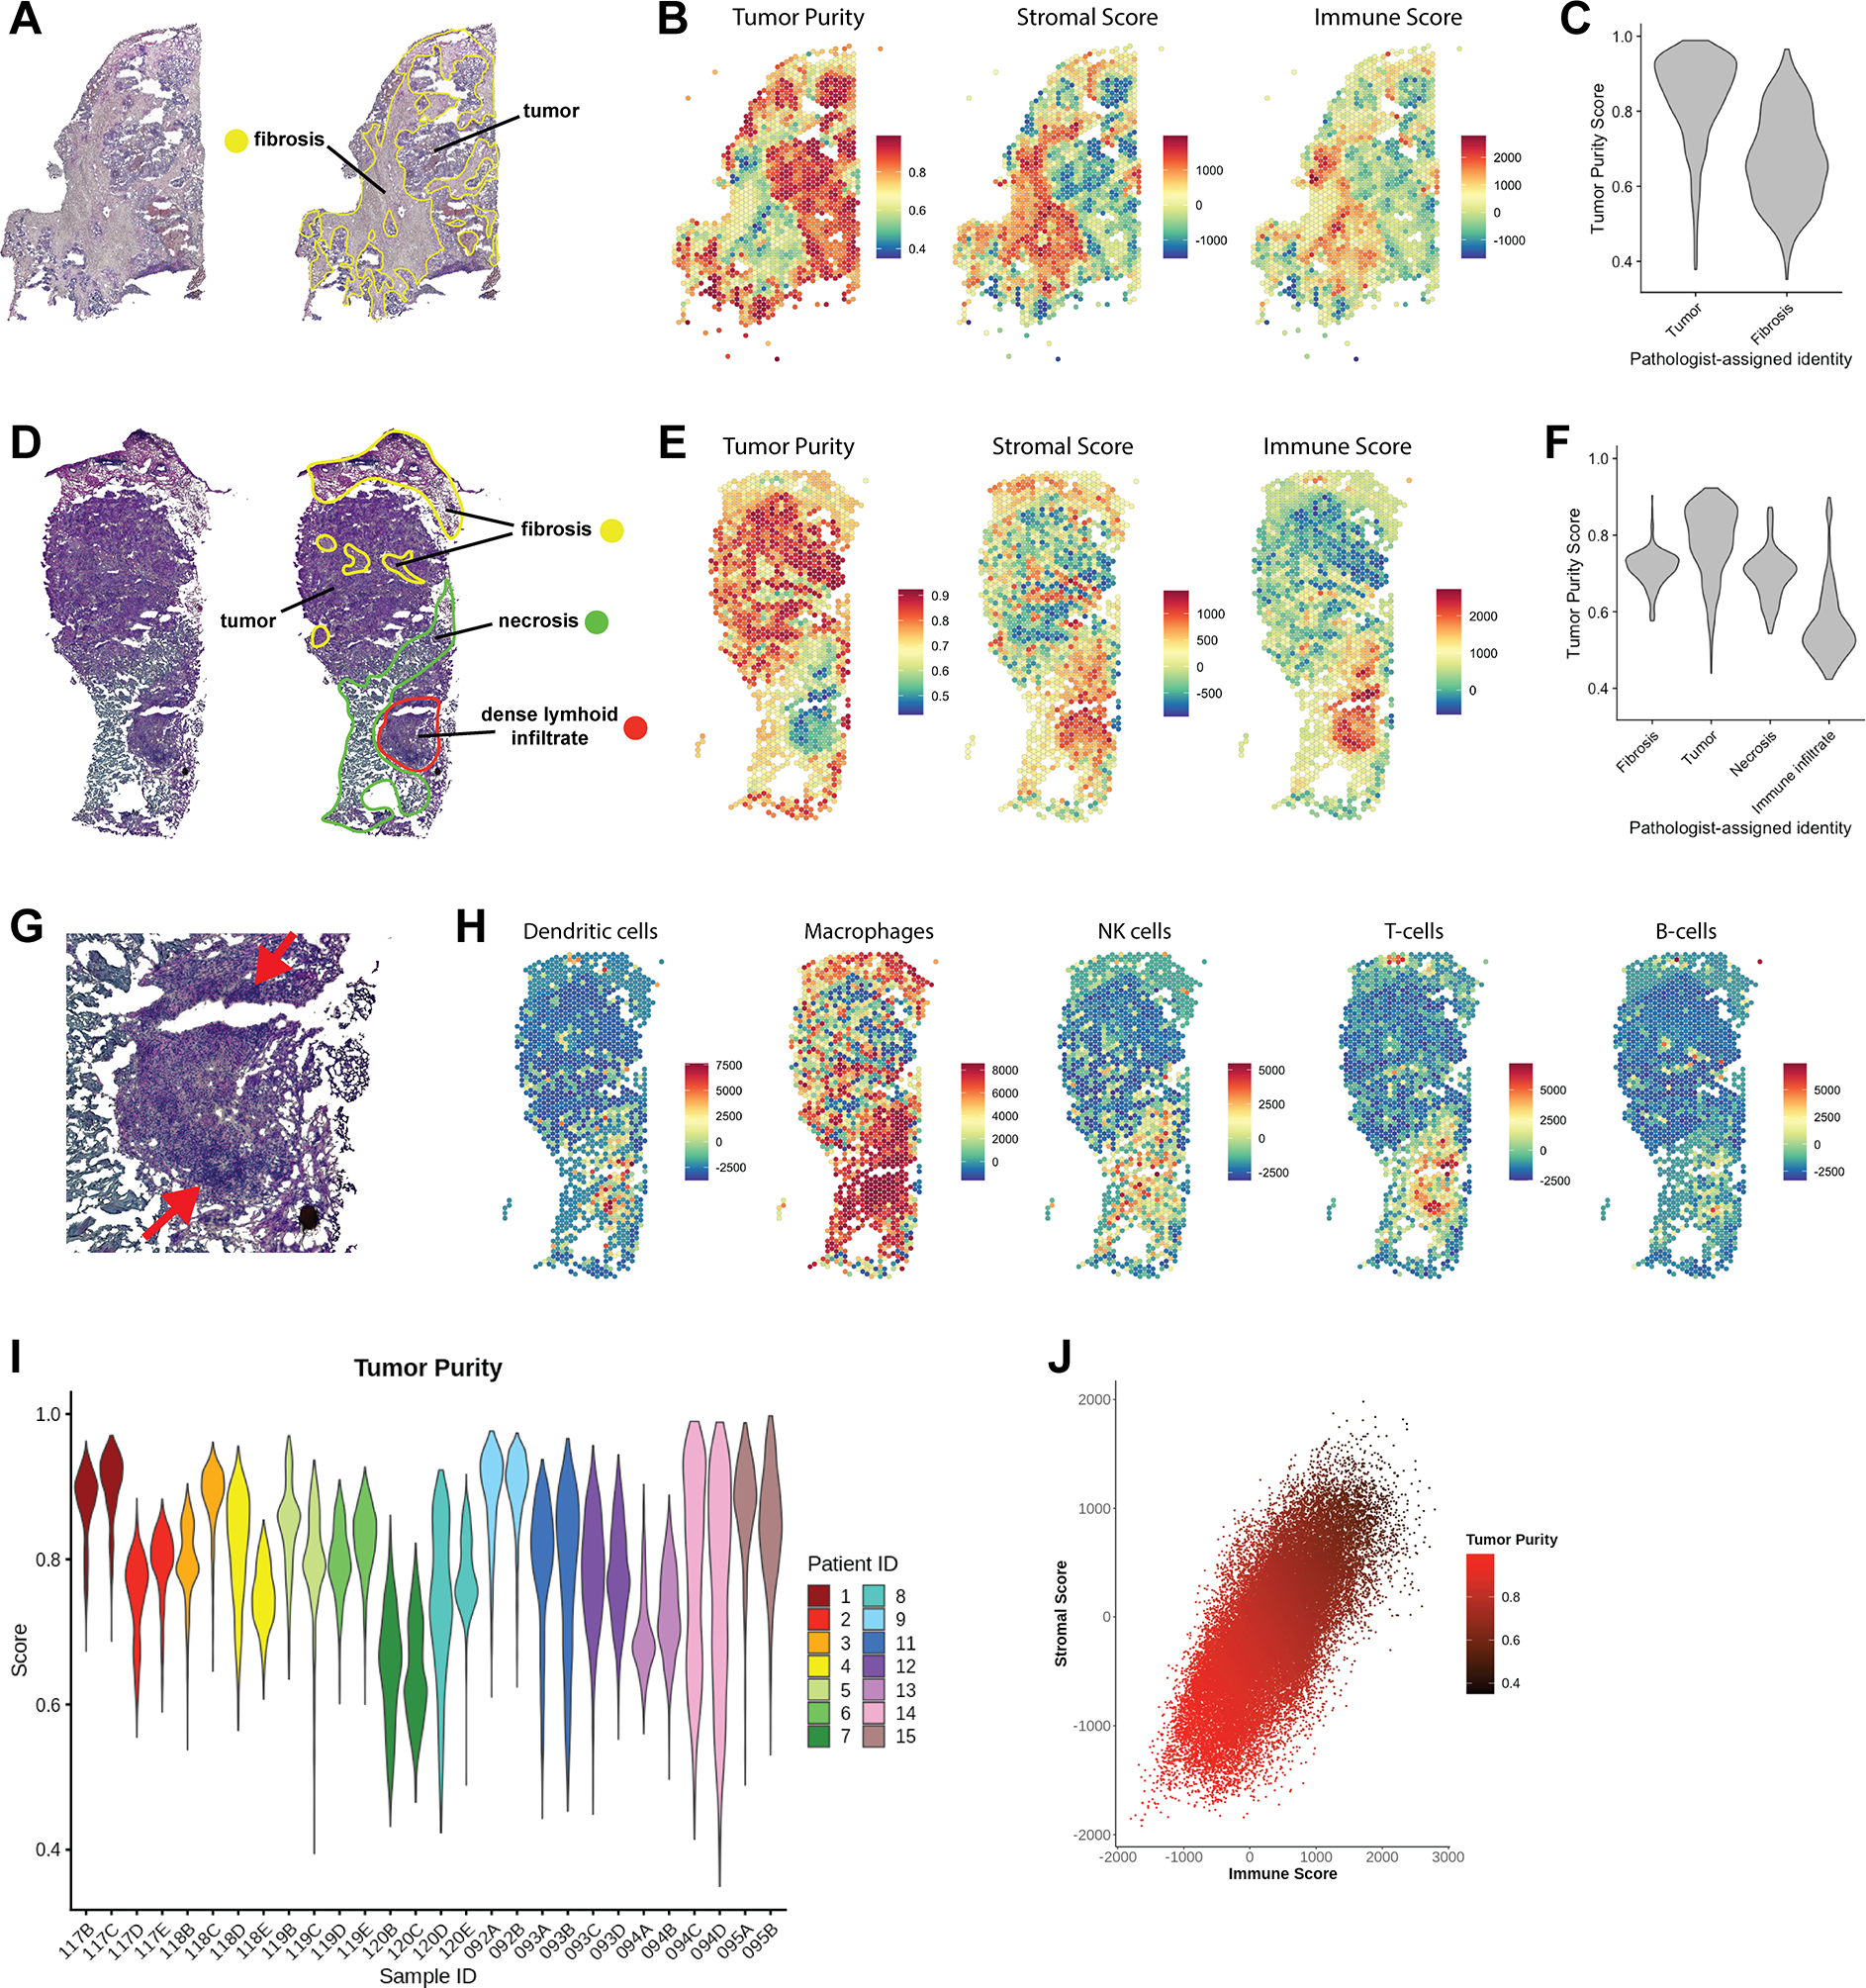
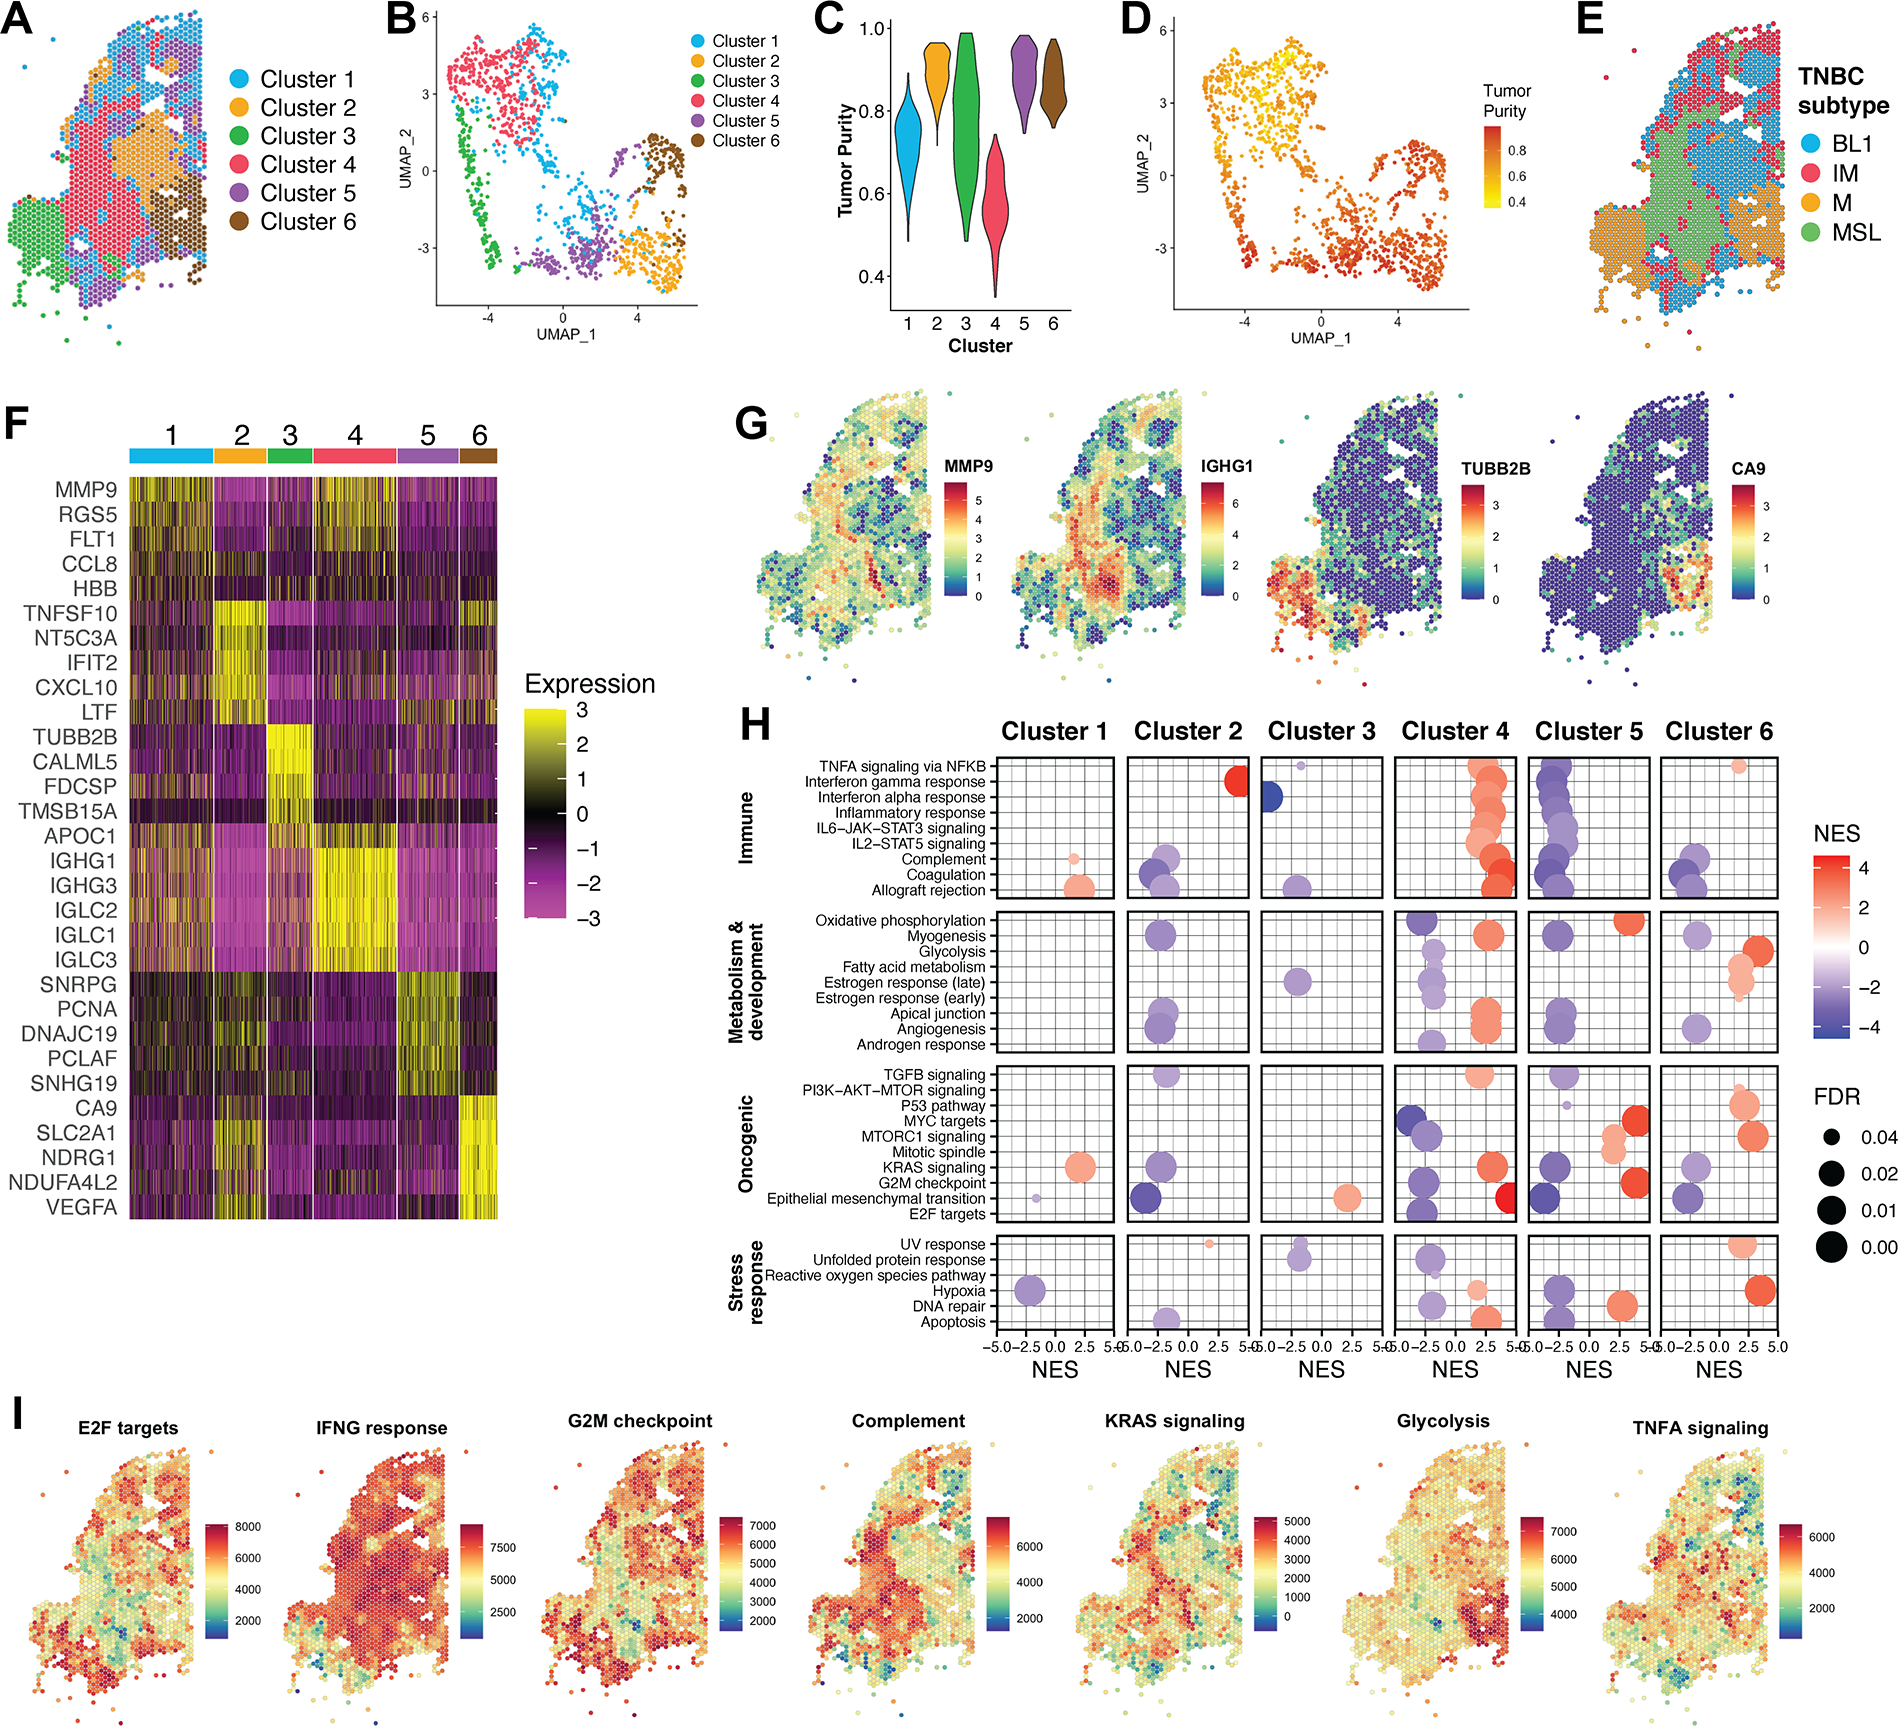
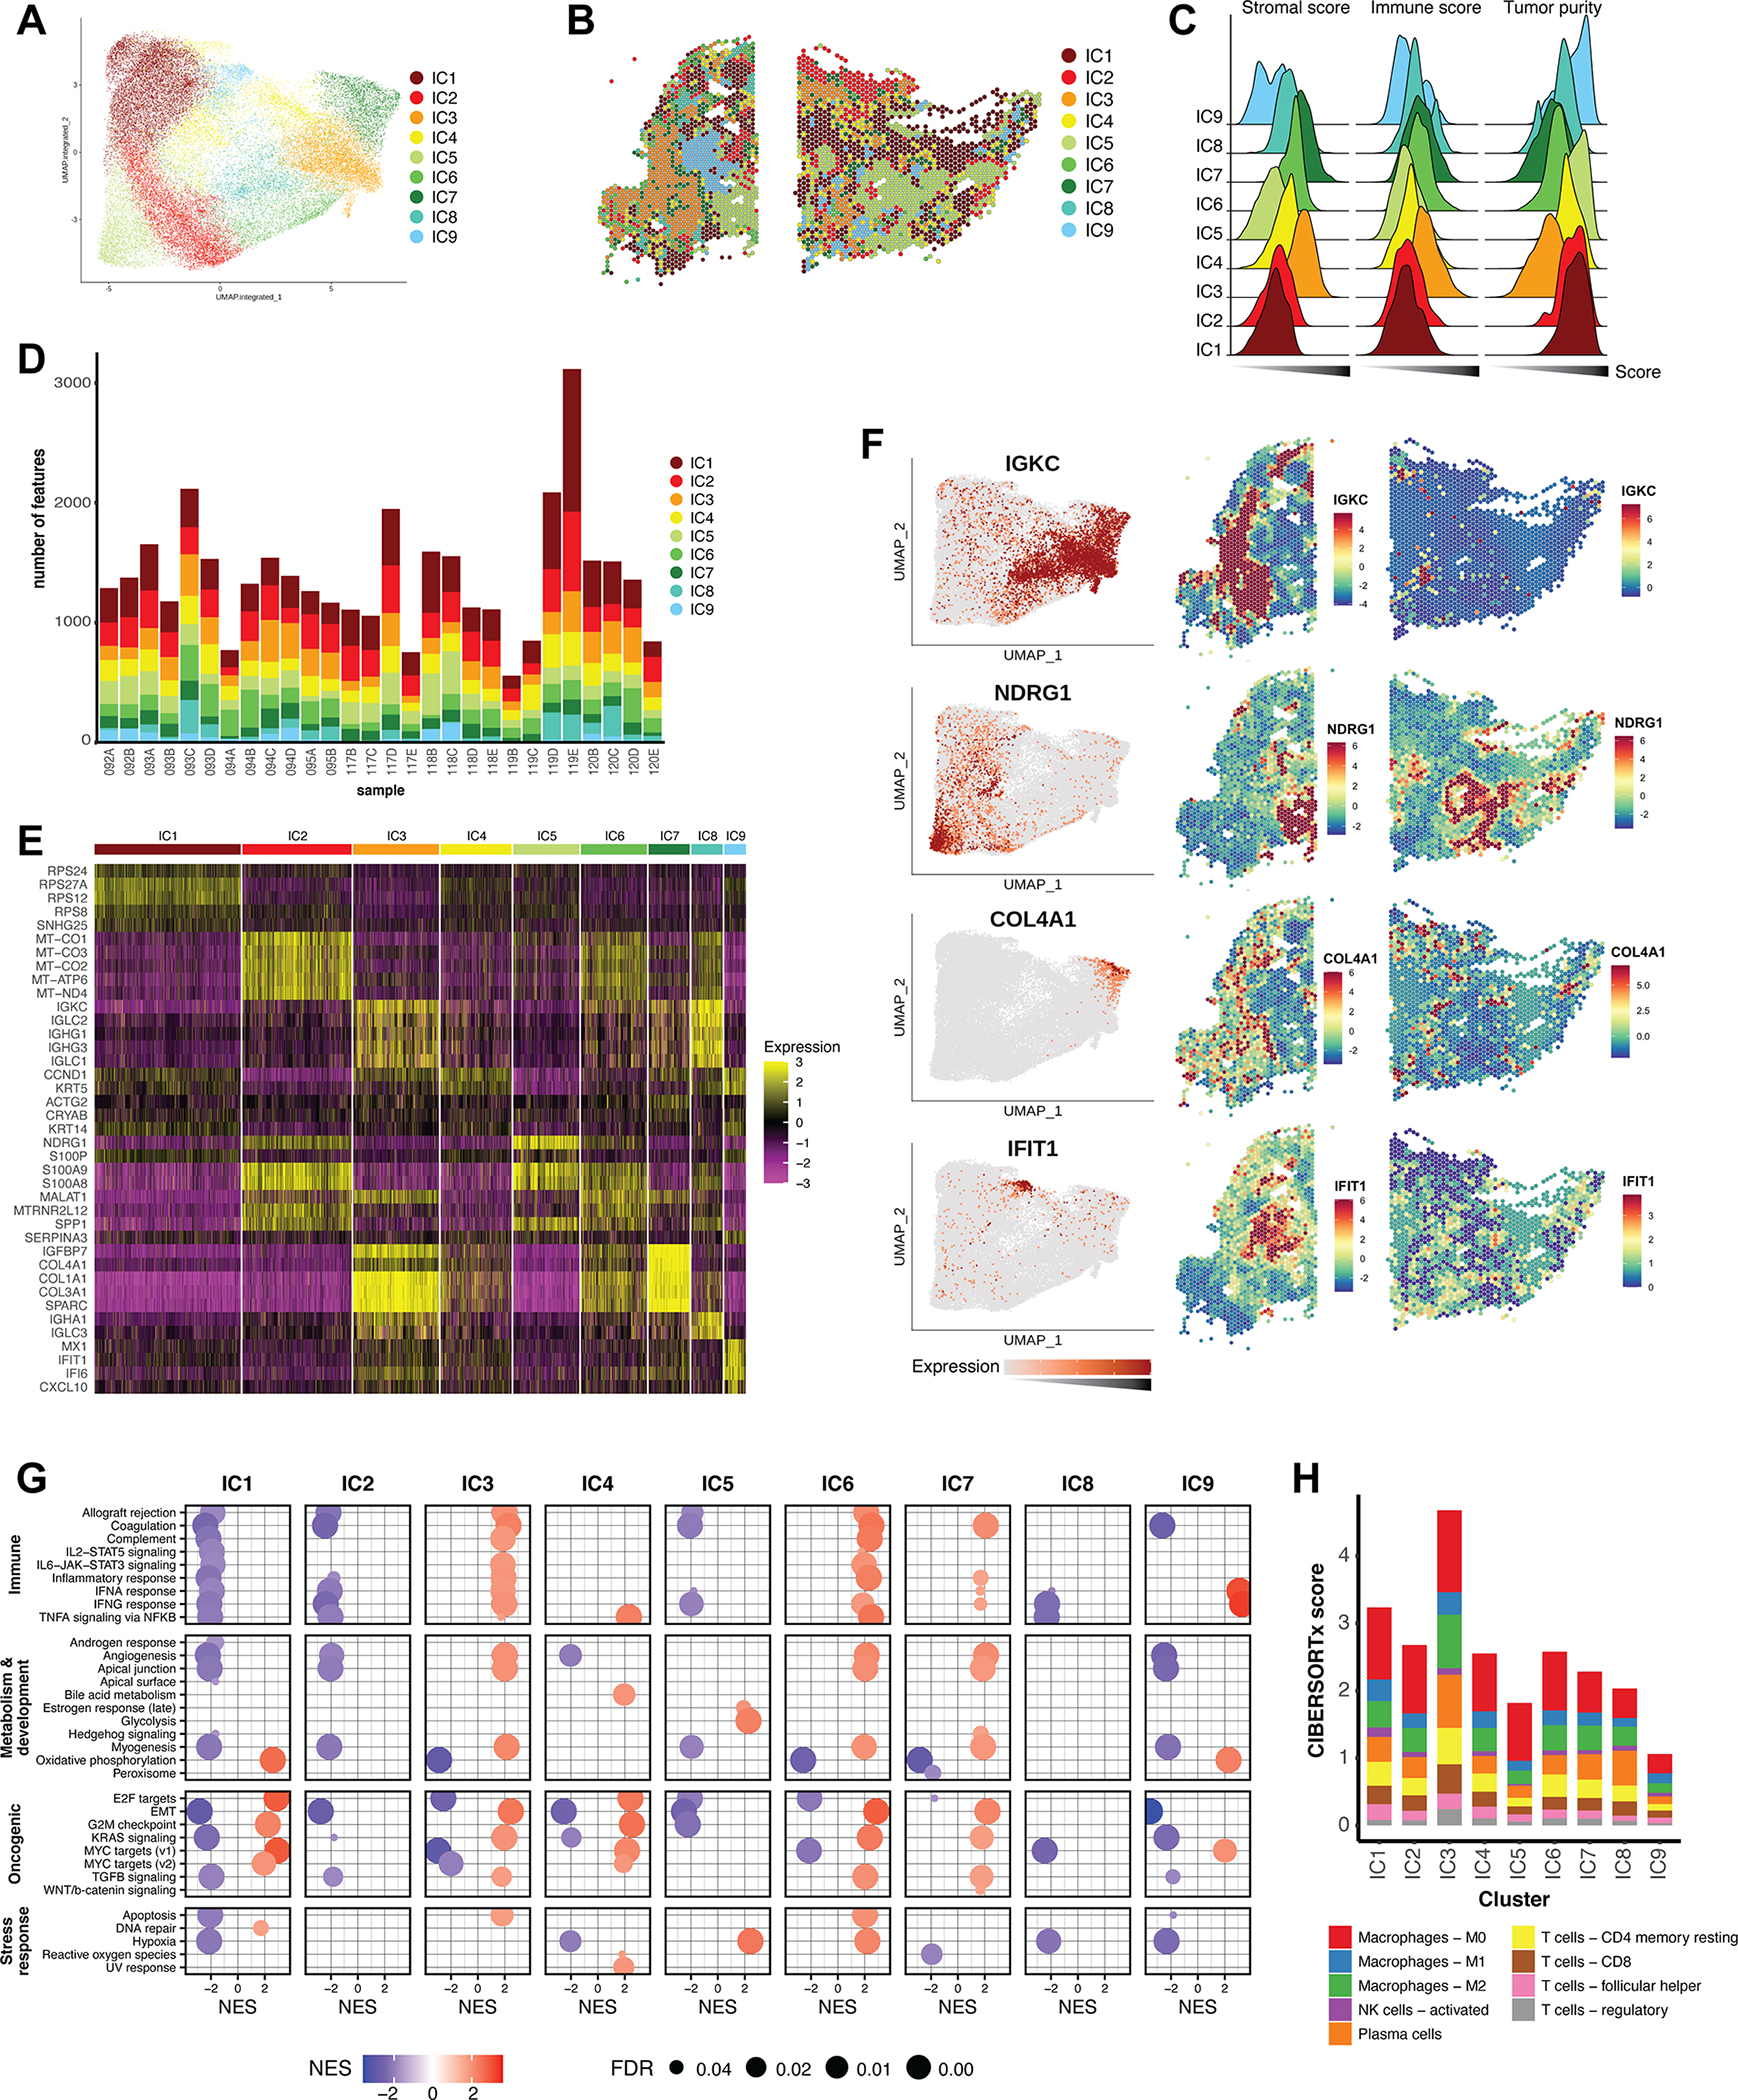
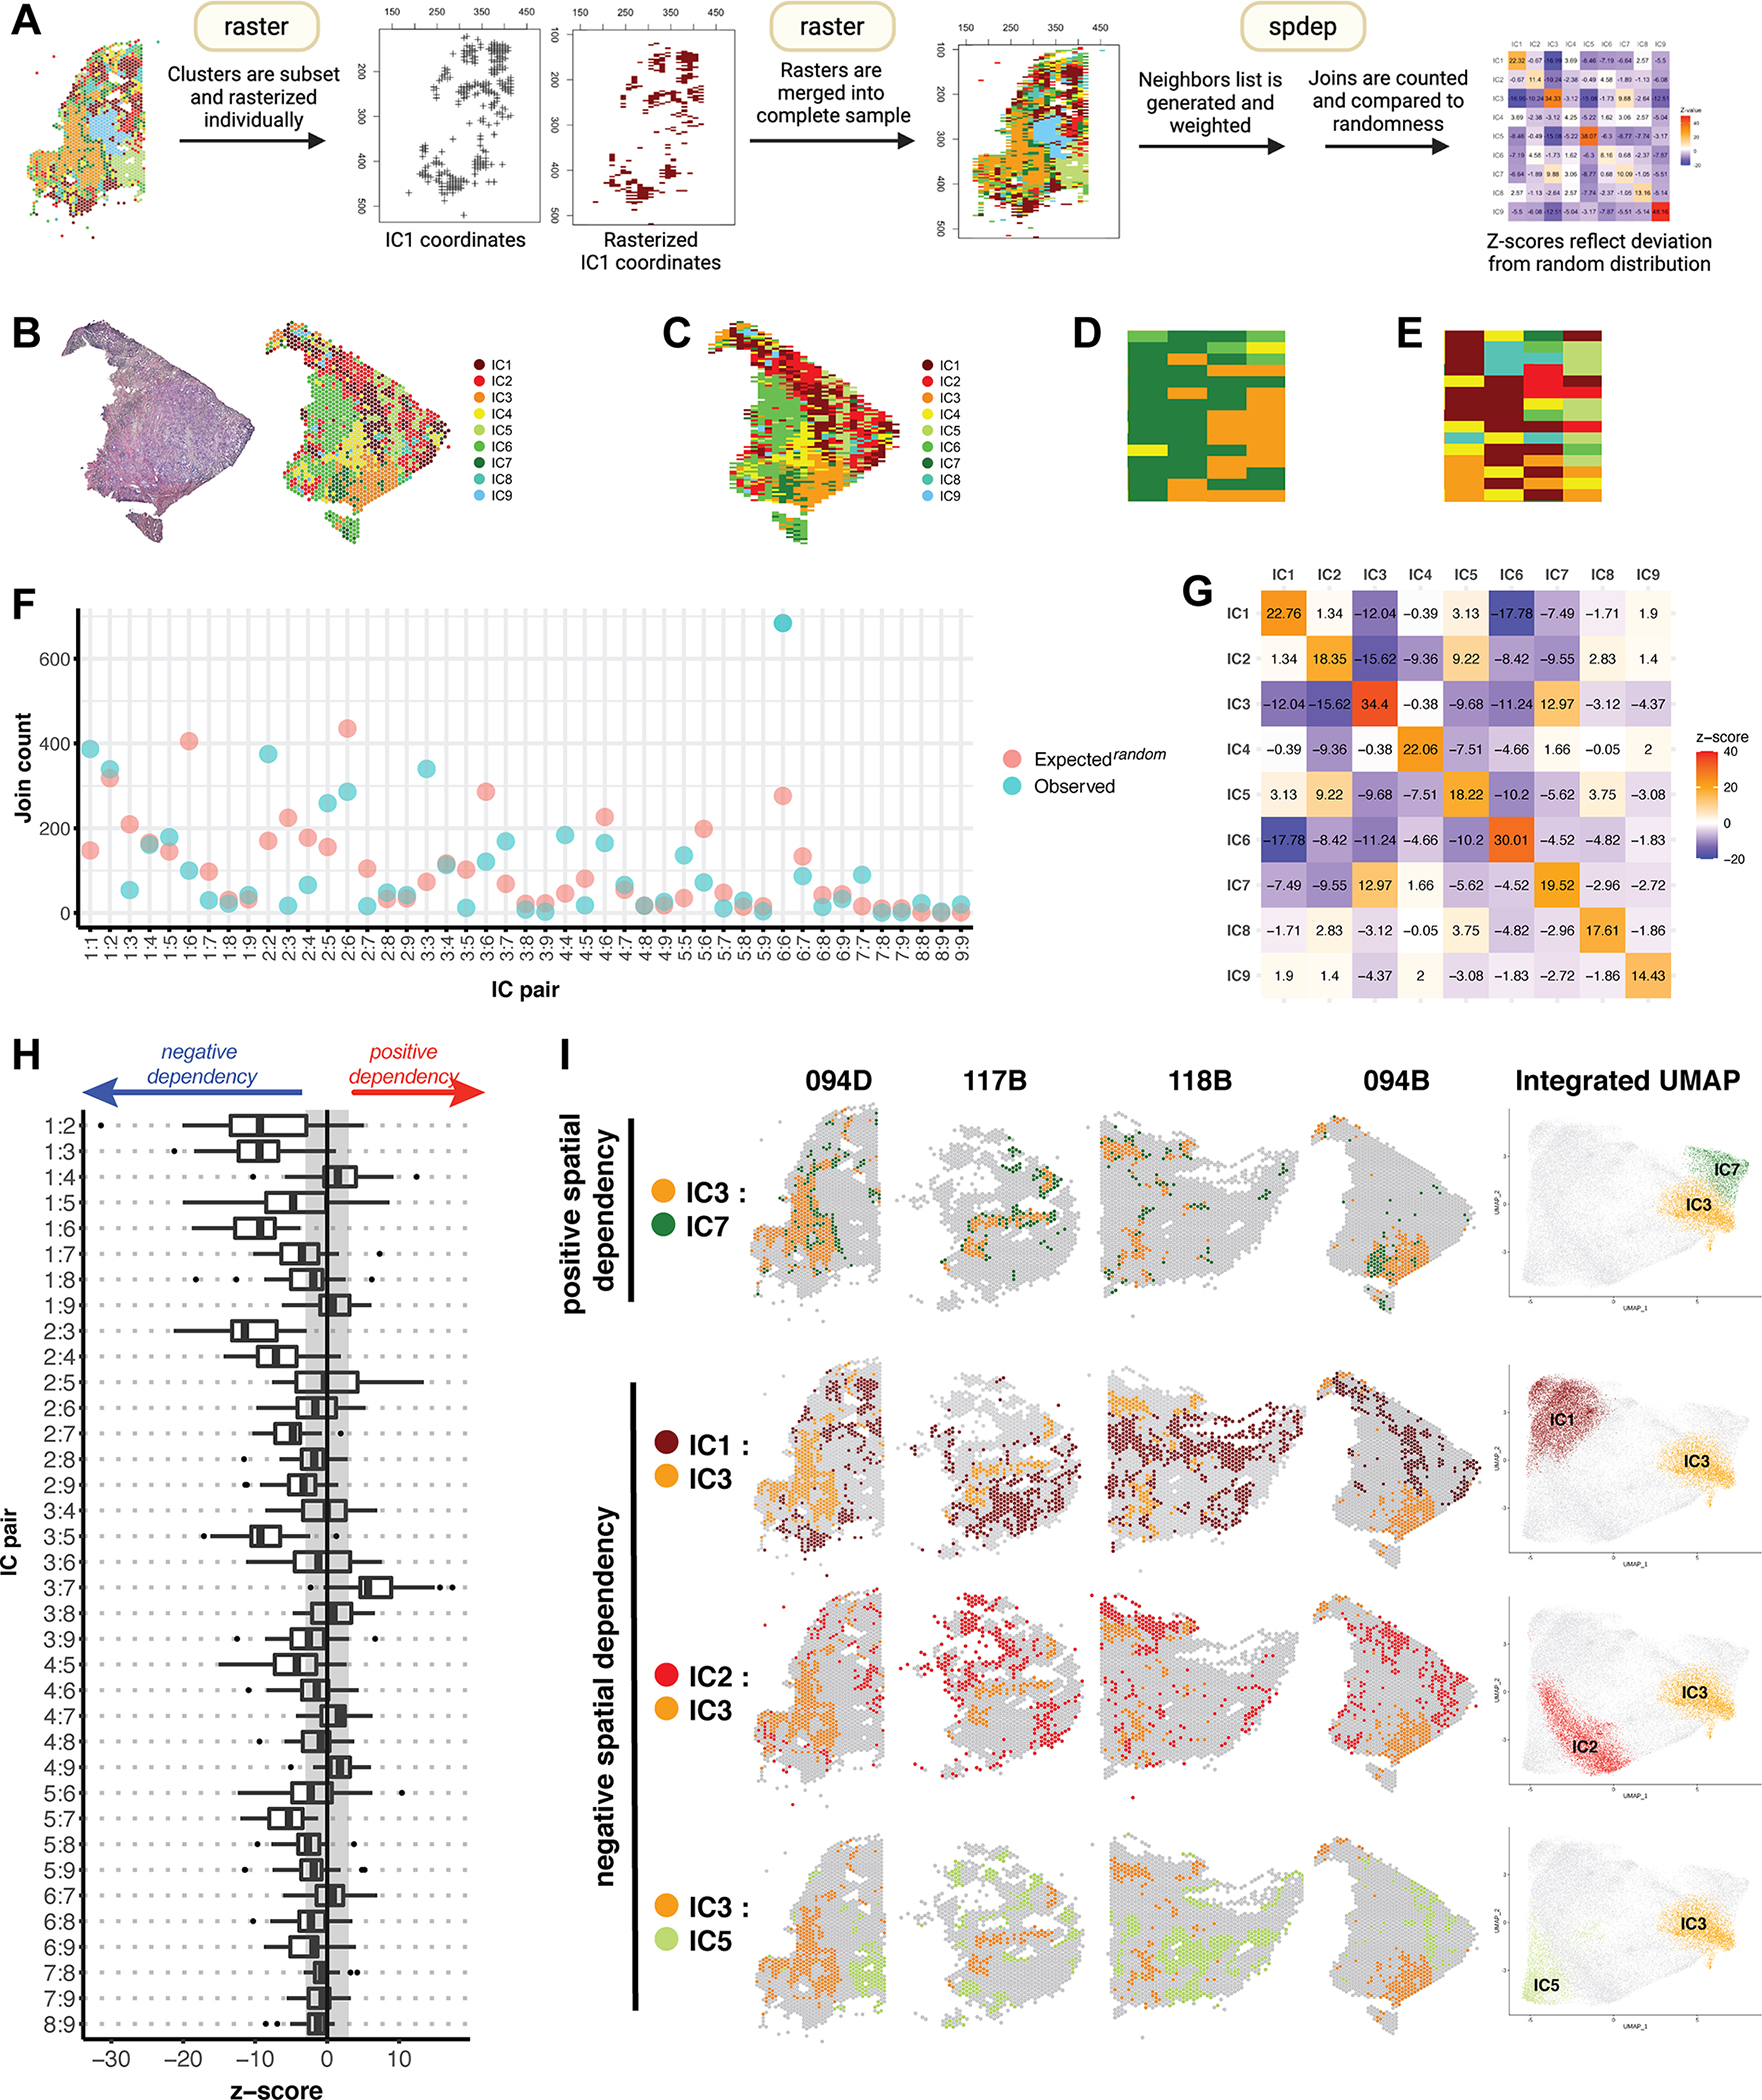
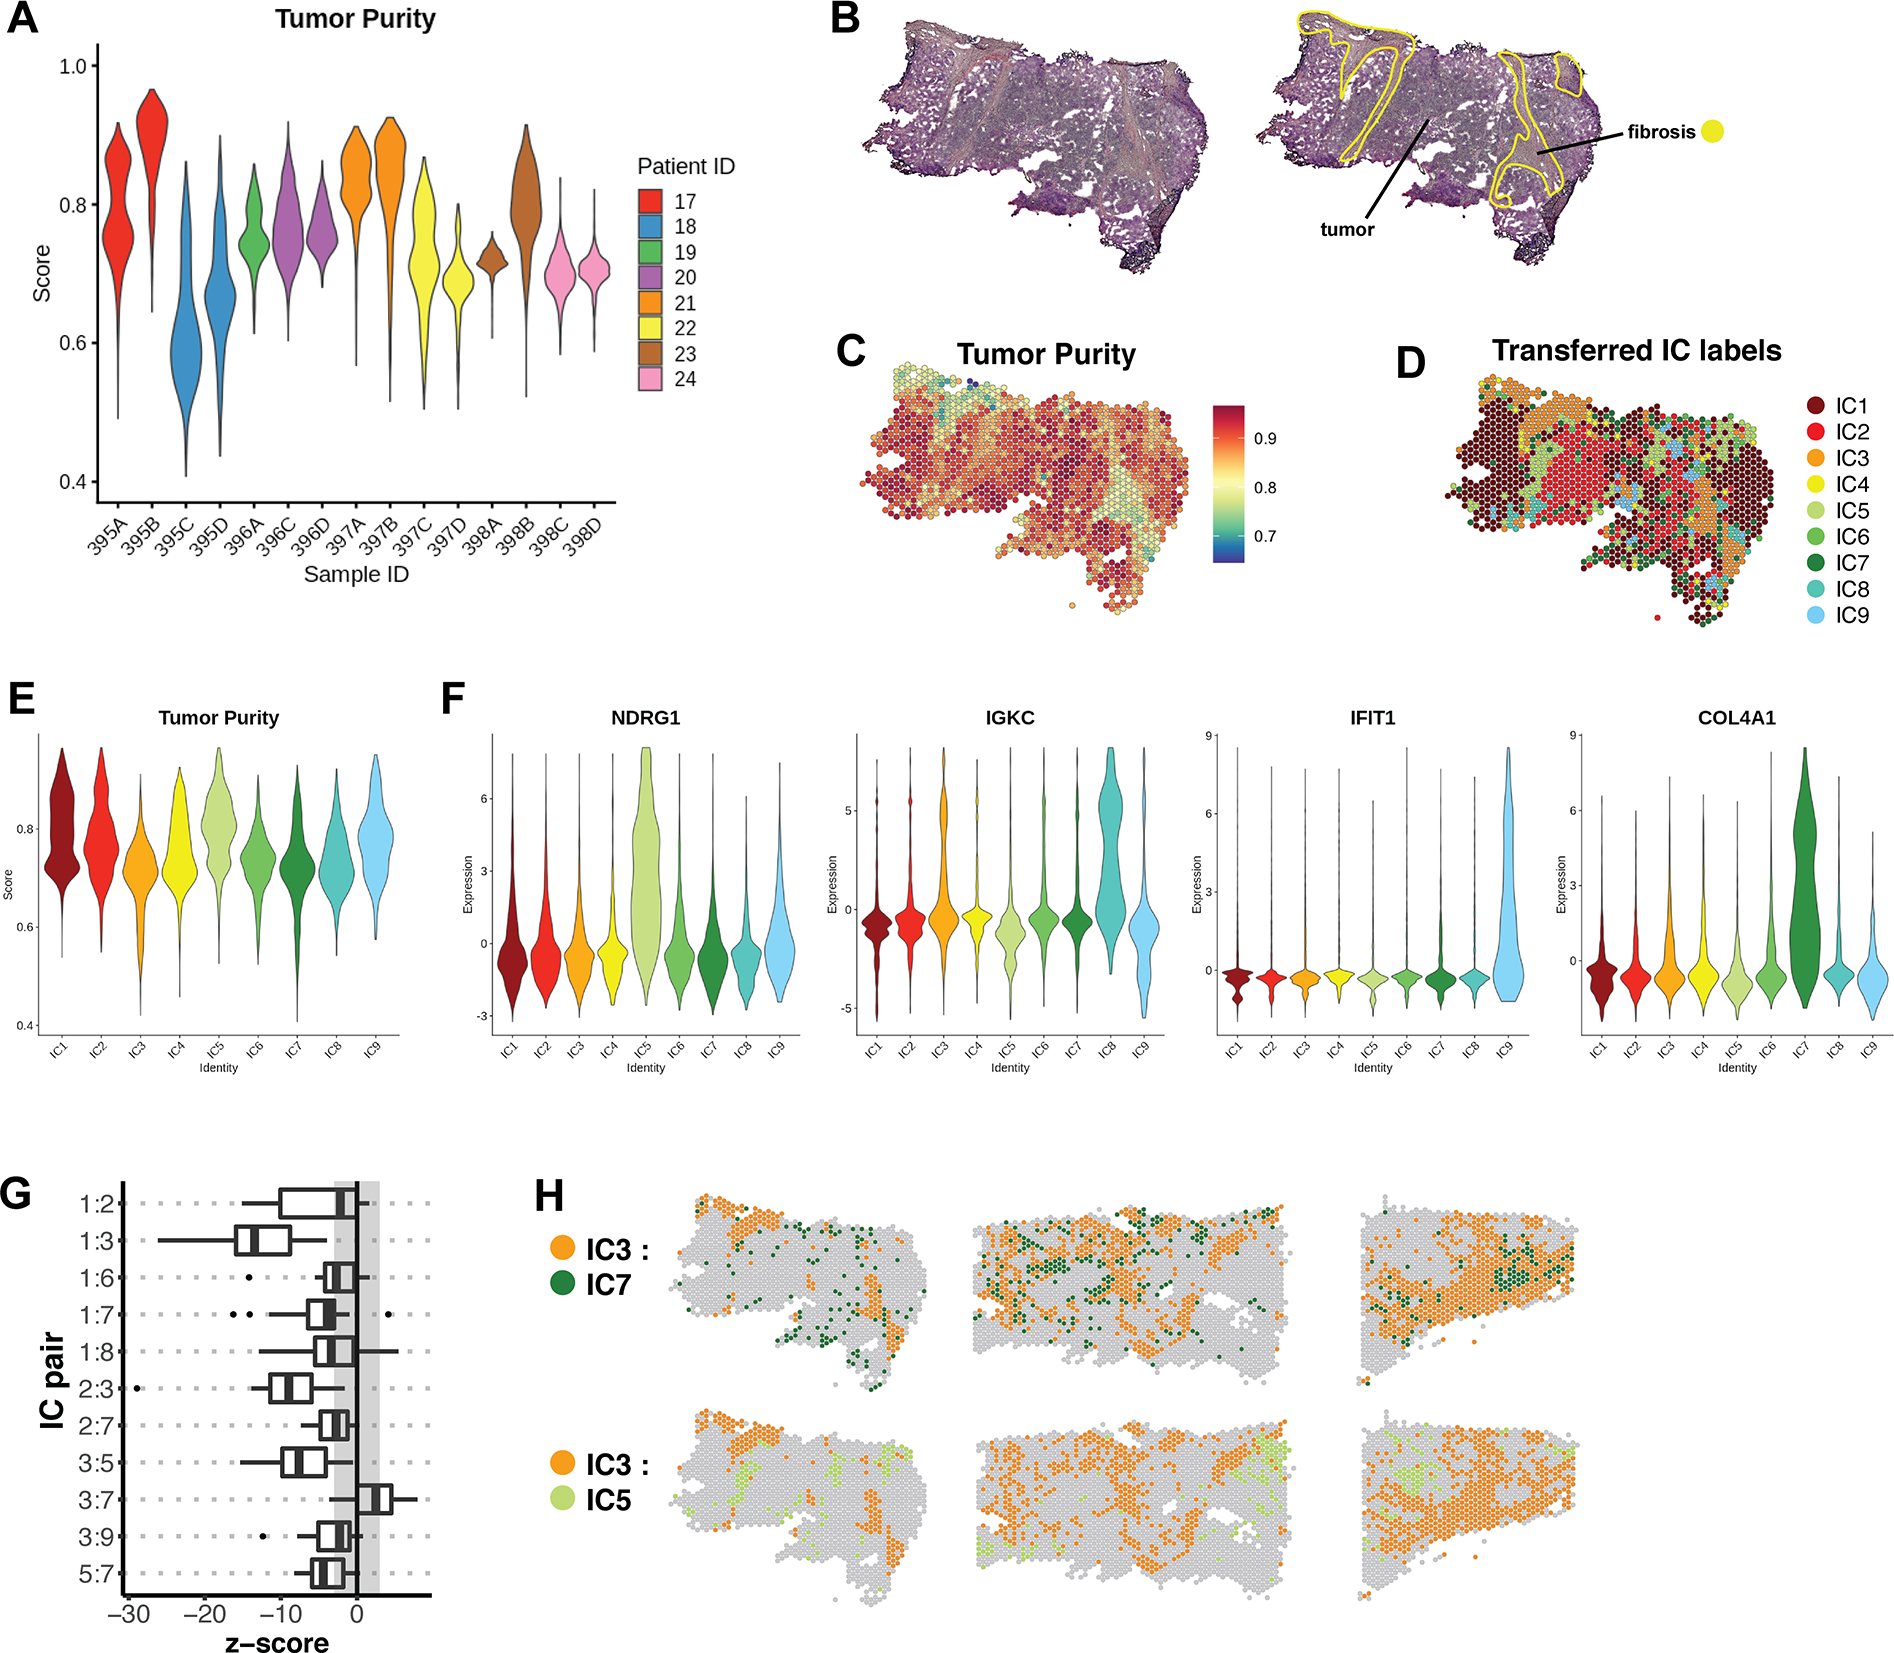
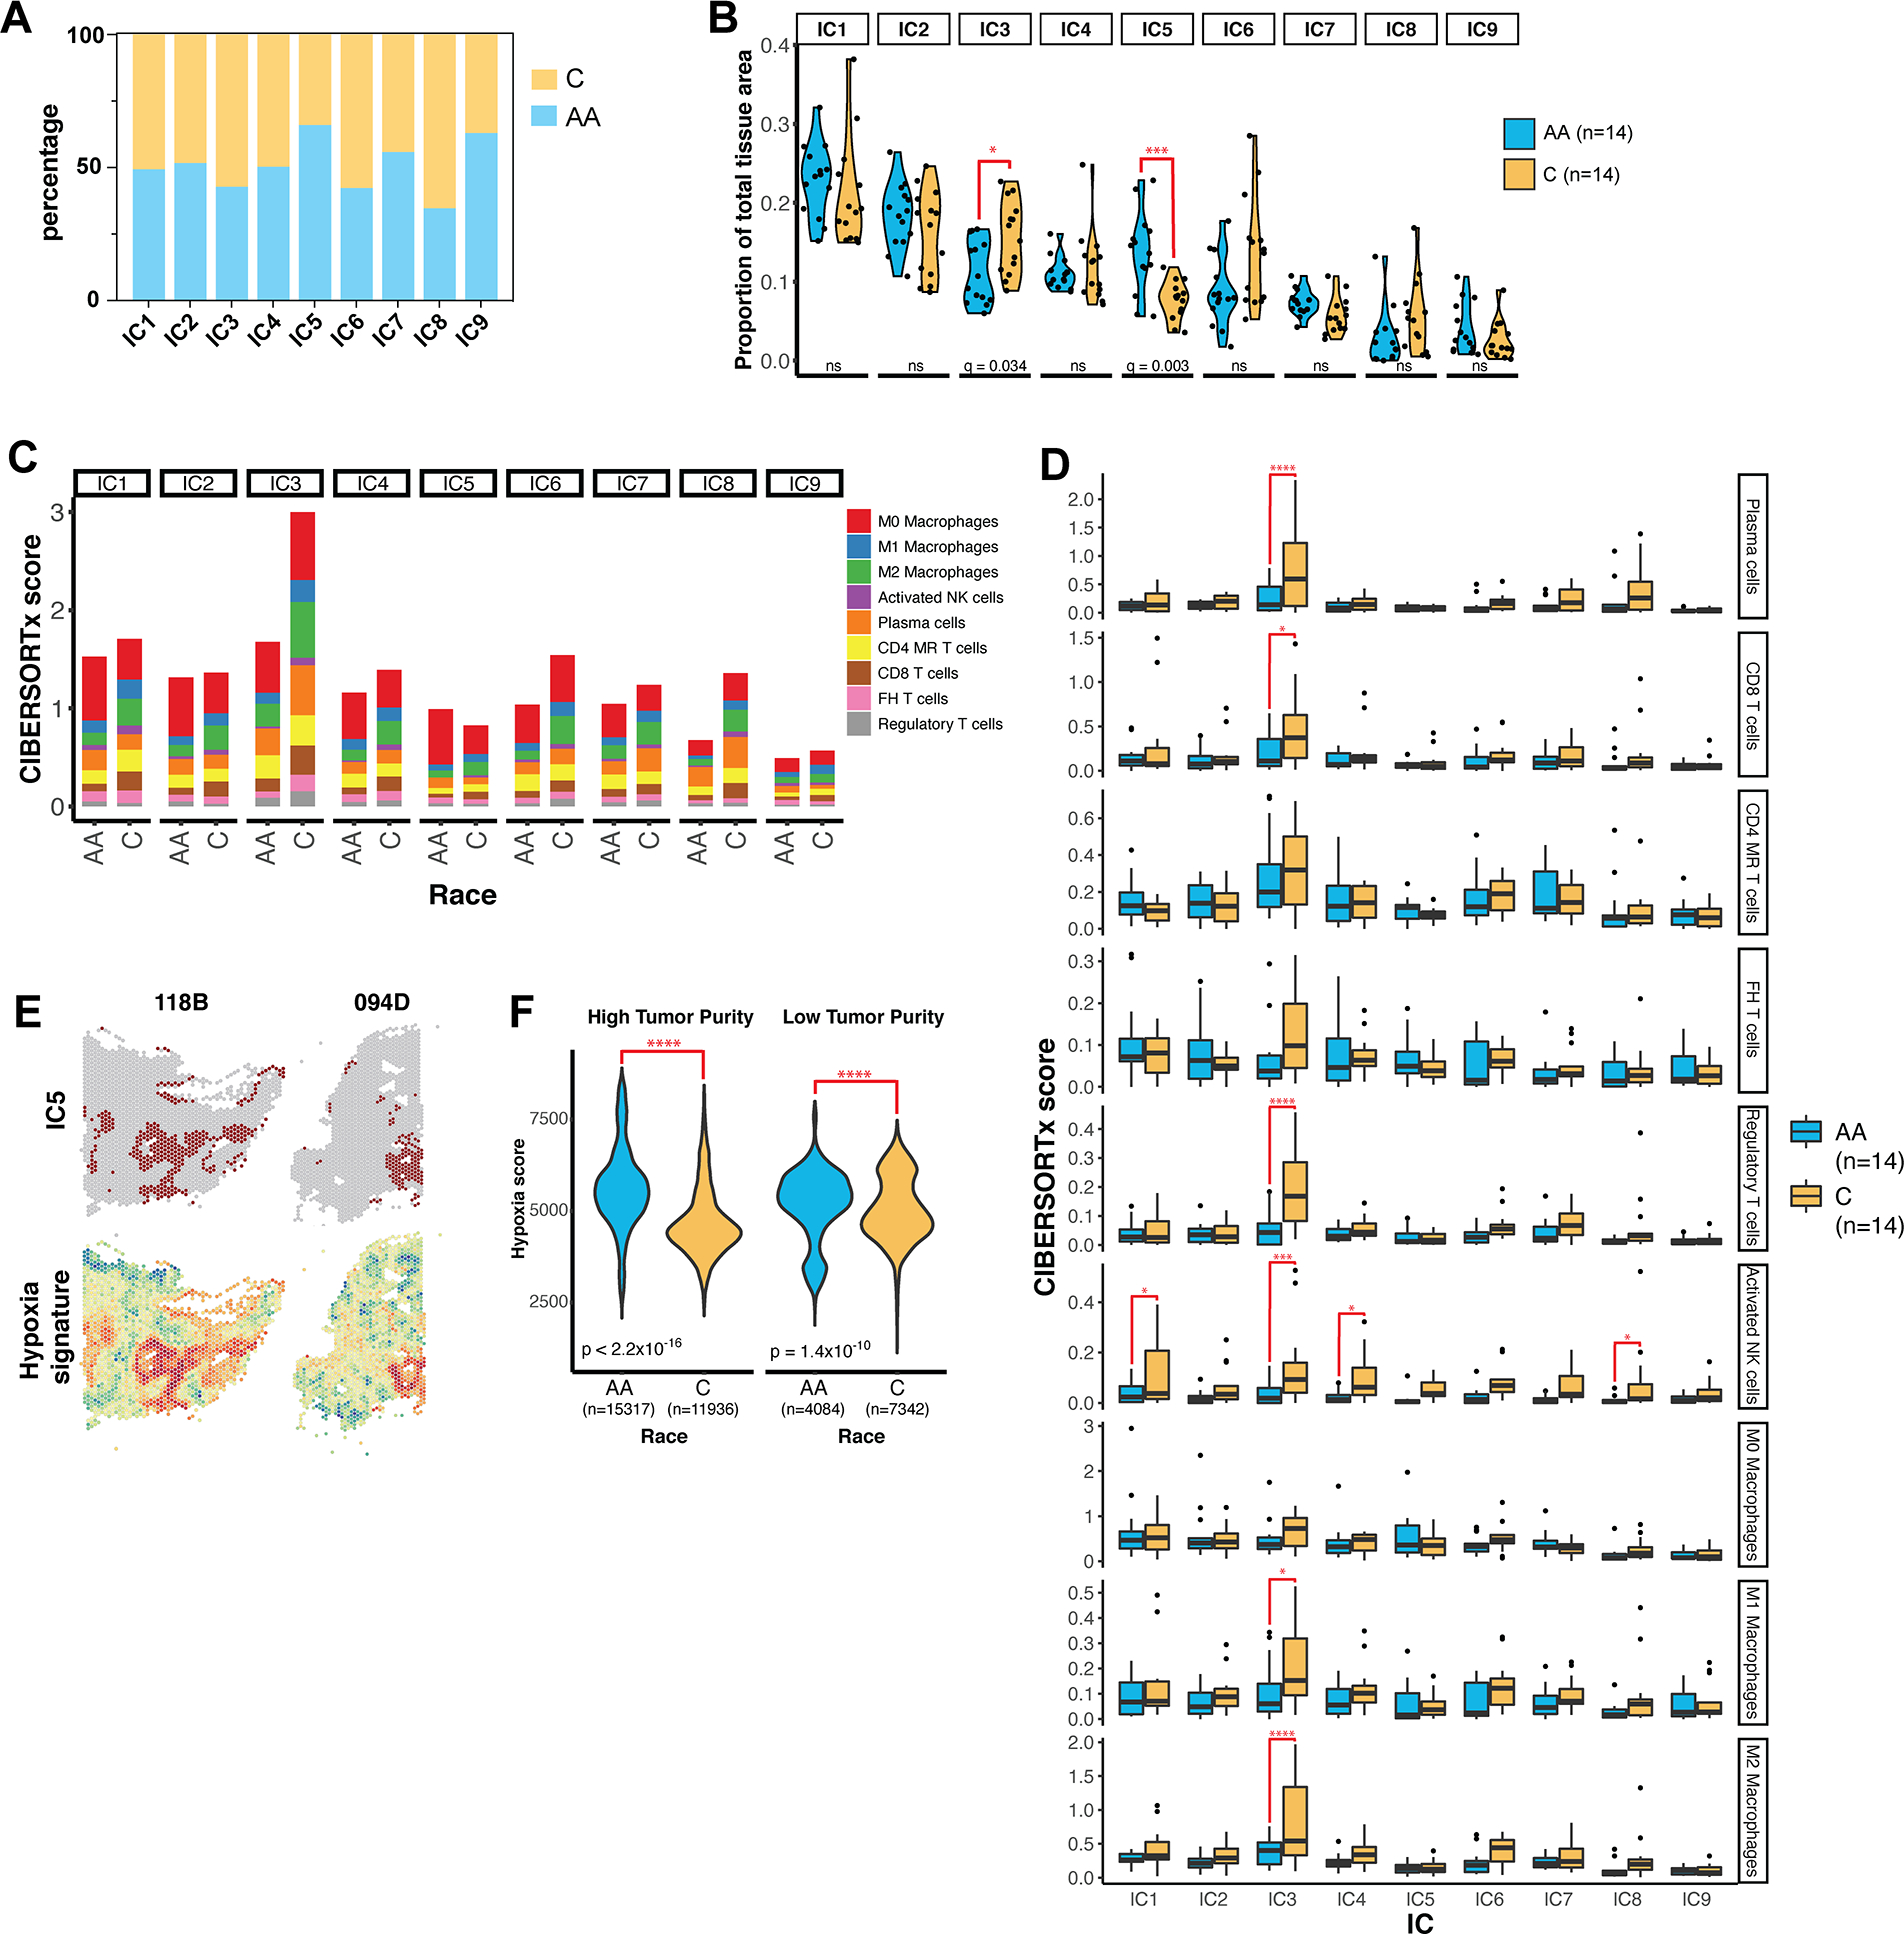
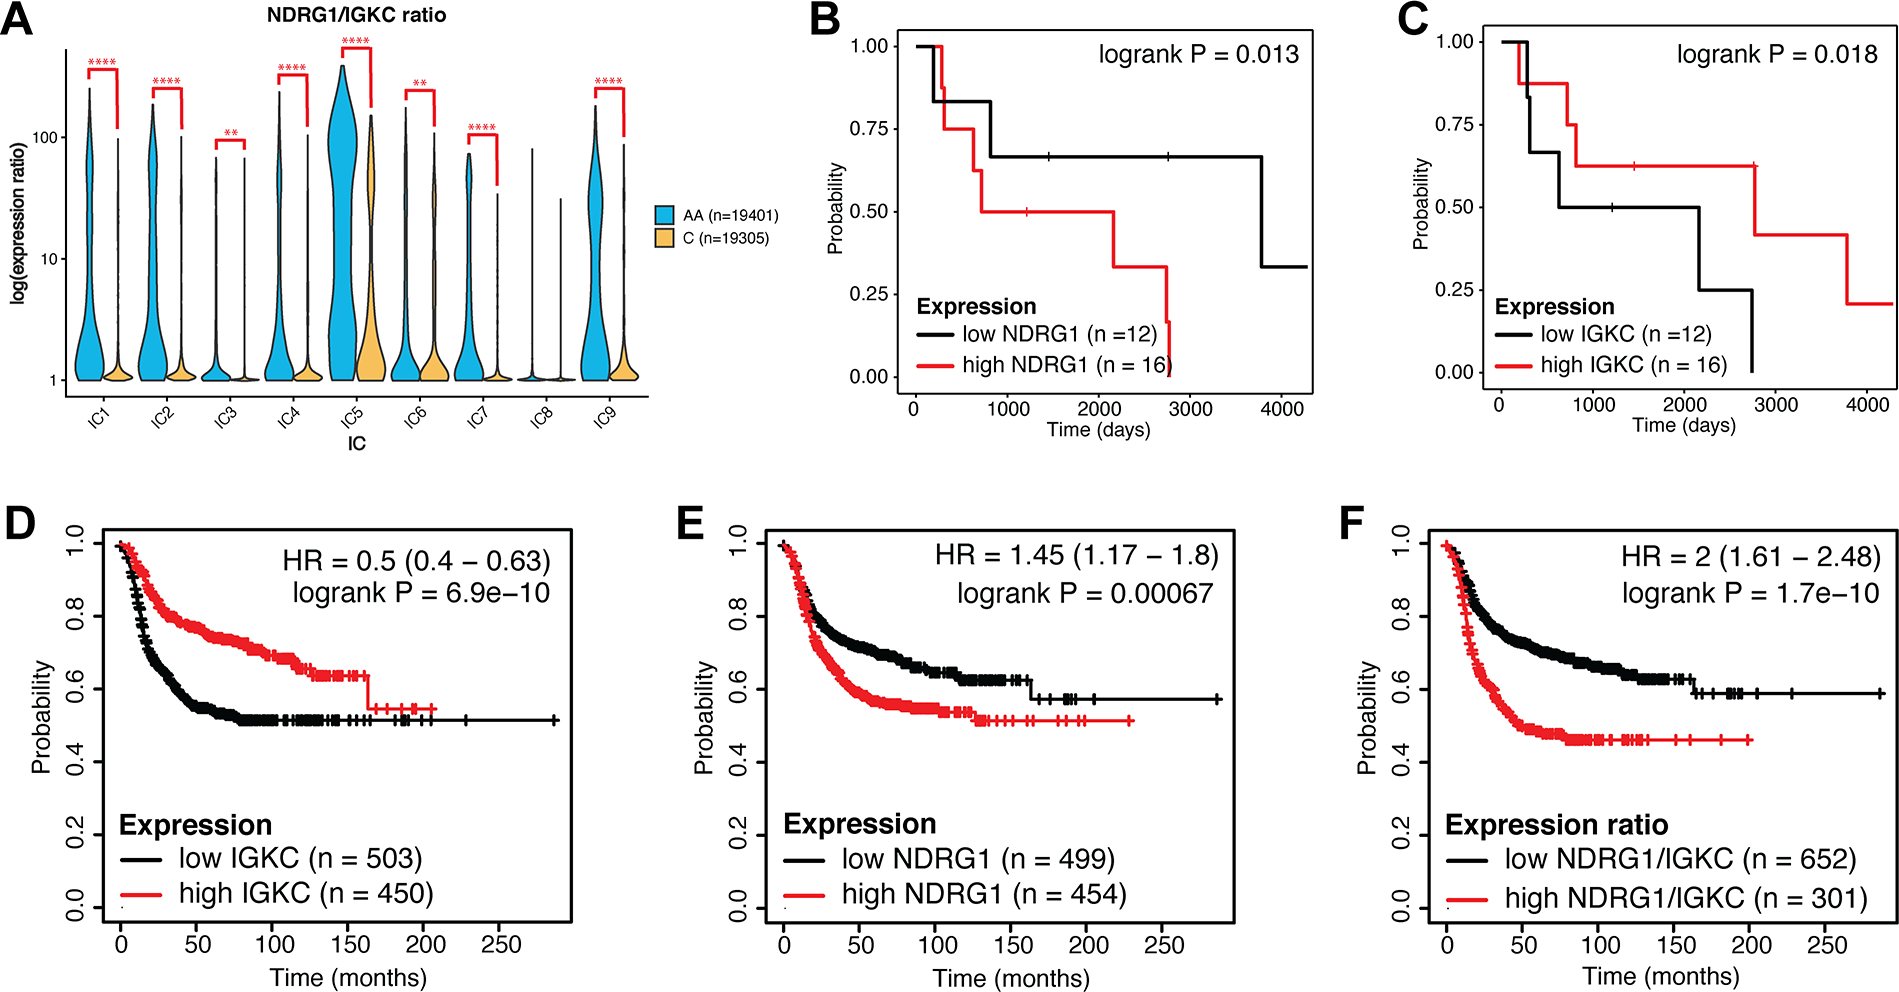
Triple-negative breast cancer (TNBC) is an aggressive disease that disproportionately affects African American (AA) women. Limited targeted therapeutic options exist for patients with TNBC. Here, we employ spatial transcriptomics to interrogate tissue from a racially diverse TNBC cohort to comprehensively annotate the transcriptional states of spatially resolved cellular populations. A total of 38,706 spatial features from a cohort of 28 sections from 14 patients were analyzed. Intratumoral analysis of spatial features from individual sections revealed heterogeneous transcriptional substructures. However, integrated analysis of all samples resulted in nine transcriptionally distinct clusters that mapped across all individual sections. Furthermore, novel use of join count analysis demonstrated nonrandom directional spatial dependencies of the transcriptionally defined shared clusters, supporting a conserved spatio-transcriptional architecture in TNBC. These findings were substantiated in an independent validation cohort comprising 17,861 spatial features representing 15 samples from 8 patients. Stratification of samples by race revealed race-associated differences in hypoxic tumor content and regions of immune-rich infiltrate. Overall, this study combined spatial and functional molecular analyses to define the tumor architecture of TNBC, with potential implications in understanding TNBC disparities.

Significance: Spatial transcriptomics profiling of a diverse cohort of triple-negative breast cancers and innovative informatics approaches reveal a conserved cellular architecture across cancers and identify proportional differences in tumor cell composition by race.


Conflict of interest statement

Conflict of interest statement: The authors declare no potential conflicts of interest.

Figures

Figure 1.
Figure 1.. Overview of spatial transcriptomics workflow and study design.
(A) An overview of the 10x Genomics Visium spatial transcriptomics workflow, beginning with affixation of tissue to Visium spatial gene expression slides and ending with sequencing data processing and analysis. (B) An overview of the study design, including analysis strategies for a reference cohort of 28 samples, and a validation cohort of 15 samples. Image created with BioRender.com.
Figure 2.
Figure 2.. Transcriptional estimation of tumor purity approximates expert pathological annotation
(A) H&E stained images of sample 094D. Pathologist’s annotation highlights extensive regions of fibrosis. (B) Expression data per spatial feature was analyzed using ESTIMATE to generate a Tumor Purity score, Stromal Score, and Immune Score. (C) Violin plot of tumor purity scores of features in the regions identified as tumor and fibrosis by manual annotation of sample 094D. (D) Pathologist’s annotation of sample 120D, which contained a region of dense lymphoid infiltrate in addition to tumor, fibrotic, and necrotic regions. (E) Per-feature ESTIMATE analysis of sample 120D. (F) Comparison of pathologist-assigned identity to Tumor Purity score for sample 120D. (G) Magnified region of immune infiltrate in sample 120D, with an arrow indicating dense outer edge. (H) Per-feature enrichment scores for several tumor-associated immune cell signatures (31) as determined by ssGSEA. (I) Violin plot of tumor purity profiles of all 28 samples. Samples are colored by patient ID; two samples were available for each patient. (J) Scatter plot of immune and stromal scores per feature in all samples, with a correlation coefficient of r = 0.7. Data points are colored by Tumor Purity, which is inversely related to immune and stromal scores.
Figure 3.
Figure 3.. Clustering reveals transcriptionally distinct regions of tumor and stroma
(A) Graph-based clustering of sample 094D resulted in 6 transcriptionally distinct clusters. (B) UMAP projection of sample 094D, colored by cluster assignment. (C) Tumor purity profiles of clusters identified in sample 094D. (D) UMAP projection of sample 094D, colored by Tumor Purity score. (E) TNBC subtypes assigned to each cluster. (F) Heatmap of top differentially expressed genes per cluster for sample 094D. Colors represent the Pearson residuals of normalized and variance-stabilized expression data (24). Each column represents a single spatial feature, and features are grouped by their cluster assignment. (G) Spatial mapping of representative marker genes for clusters in sample 094D. Color scale represents log-transformed normalized gene expression. (H) GSEA for clusters of sample 094D against Hallmark collection gene sets. Only results with a false discovery rate (FDR) < 0.05 are displayed. NES = Normalized enrichment score. (I) Spatially mapped feature-level ssGSEA scores for selected Hallmark gene sets. Color scale represents enrichment scores.
Figure 4.
Figure 4.. Clustering of an integrated dataset reveals shared cell populations
A) Graph-based clustering analysis of the integrated reference dataset resulted in nine integrated clusters (ICs), depicted here on the integrated UMAP embeddings. (B) ICs mapped back to individual representative samples. (C) Ridgeline plot of ESTIMATE scores for all ICs, calculated for all corresponding features in the reference dataset. The x-axis represents score, and increases from left to right. (D) Bar graph representing the distribution of the nine ICs across the individual samples of the dataset. (E) Heatmap of top differentially expressed marker genes of the ICs across the integrated dataset. Color scale represents the Pearson residuals of normalized and variance-stabilized expression data (24). (F) Expression of selected marker genes represented on the integrated UMAP embedding, as well as spatially in individual samples. Color scales represent Pearson residuals. (G) GSEA of ICs using the Hallmark gene sets. Only results with a false discovery rate (FDR) < 0.05 are displayed. NES = Normalized enrichment score. (H) CIBERSORTx was used to deconvolute immune mixtures in each ICs. Absolute CIBERSORTx scores are represented on the y-axis, and immune identities of selected cell types are differentiated by color.
Figure 5.
Figure 5.. Spatial analytics of integrated clusters reveals a consistent molecular topography
(A) An overview of join count analysis (JCA). Each sample is subset by integrated cluster (IC), and corresponding coordinates are rasterized individually using R package raster. Subsetting allows each IC to be coded uniquely during rasterization. Individual rasters for all 9 ICs are then merged to recreate the complete sample. R package spdep is then used to generate a neighbors list with spatial weights for each observation. Join counts for all cluster pairs are then tabulated and compared to a spatially random distribution. (B) Mapping of ICs on sample 094B. (C) Raster of sample 094B, in which each spatial feature is represented by a pixel coded by IC assignment. (D) A region of sample 094B representative of clustering, in which any given pixel is likely to have a similar group of neighbors. (E) A region representative of dispersion, in which most pixels have dissimilar neighbors. (F) JCA results for sample 094B. For each IC pair, the observed join count is indicated, along with what would be expected under conditions of spatial randomness. (G) Z-values corresponding to the analysis in (F), reflecting the deviation of the observed join count from theoretical randomness. A positive z-value indicates spatial clustering, a negative value indicates spatial dispersion, and a value close to 0 indicates no spatial dependency, i.e. a near random distribution. (H) A summary of z-values resulting from JCA of all 28 samples represented in a box plot. The box represents the interquartile range, with the median marked by a vertical line. Outliers are represented by points outside the range of the whiskers. The shaded region represents our selected z-value cutoff of +/−3 (as described in Methods) to assess significance of results. All autocorrelations were strongly positive (z ≥ 10) and are not represented here. (I) Spatial mapping and UMAP embeddings of selected IC pairs found to trend towards positive and negative spatial dependency.
Figure 6.
Figure 6.. Annotation of a validation cohort with IC labels
(A) Tumor purity profiles of 15 samples belonging to the validation cohort. (B) Representative sample 395B from the validation cohort, with pathologist’s manual annotation. (C) Per-feature Tumor Purity scores for sample 395B. (D) IC assignments for sample 395B, which were transferred from the integrated dataset by reference mapping. (E) Cumulative Tumor Purity scores for all samples in the validation cohort after each was individually queried for reference mapping. The x-axis represents transferred IC labels. (F) The expression of selected marker genes in the labeled validation cohort. Expression is represented by Pearson residuals. (G) Join count analysis was performed on labeled samples of the validation cohort. The box plot represents a summary of the resulting z-scores for a subset of cluster pairs that were found to be significant in the reference cohort. (H) Spatial validation of cluster pairs with positive and negative spatial dependencies in representative samples of the validation cohort.
Figure 7.
Figure 7.. Annotation of ICs in the context of racial disparities
(A) The percentage of features in each IC contributed by Caucasian (C) and African American (AA) samples in the cohort. (B) The proportion of each IC by total tissue area in each sample was calculated as the number of spatial features belonging to the IC divided by the total number of features in the tissue. IC proportions were compared between AA and C samples using multiple t-test corrected by false discovery rate (FDR). (C) Immune content of ICs in AA and Caucasian samples as determined by CIBERSORTx. Absolute CIBERSORTx scores are represented on the y-axis. MR = memory resting, FH = follicular helper. (D) Boxplots summarizing the immune content determined by IC in individual samples. q-values were determined by multiple t-testing corrected by FDR. * = q < 0.05; *** = q < 0.001; **** = q < 0.0001. (E) Spatial maps of features assigned to IC5 and hypoxia signature scores in representative samples. (F) Violin plots of hypoxia enrichment score by race in features with high tumor purity (score > 0.75) and low tumor purity (score < 0.75). n indicates the number of spatial features in each group. P-value was determined by Welch’s two-sample t-test.
Figure 8.
Figure 8.. NDRG1 and IGKC expression correlate with survival in TNBC and basal breast cancer
(A) Violin plot of the ratio of expression of NDRG1 to IGKC by race in each IC. Log-transformed expression ratio is represented on the y-axis. q-value was determined by multiple t-test corrected by false discovery rate. ** = q < 0.01; **** = q < 0.0001. (B-C) Kaplan-Meier plots of relapse-free survival in our reference cohort, when samples were stratified by NDRG1 (B) or IGKC (C) expression as detailed in Methods. (D-F) Kaplan-Meier plots of relapse-free survival stratified by IGKC expression (D), NDRG1 expression (E), and NDRG1/IGKC ratio (F) in molecularly subtyped basal breast cancer. Analysis is based on publicly available microarray expression datasets as detailed in Methods. Hazard ratio (HR) and p-value are indicated.

References

    1. Cancer Genome Atlas N Comprehensive molecular portraits of human breast tumours. Nature. 2012;490(7418):61–70. - PMC - PubMed
    1. Foulkes WD, Smith IE, Reis JS. Triple-Negative Breast Cancer. New Engl J Med. 2010;363(20):1938–48. - PubMed
    1. Dent R, Trudeau M, Pritchard KI, Hanna WM, Kahn HK, Sawka CA, et al. Triple-negative breast cancer: clinical features and patterns of recurrence. Clin Cancer Res. 2007;13(15 Pt 1):4429–34. - PubMed
    1. Bareche Y, Venet D, Ignatiadis M, Aftimos P, Piccart M, Rothe F, et al. Unravelling triple-negative breast cancer molecular heterogeneity using an integrative multiomic analysis. Ann Oncol. 2018;29(4):895–902. - PMC - PubMed
    1. Shah SP, Roth A, Goya R, Oloumi A, Ha G, Zhao Y, et al. The clonal and mutational evolution spectrum of primary triple-negative breast cancers. Nature. 2012;486(7403):395–9. - PMC - PubMed

Publication types