

Natural and after colon washing fecal samples: the two sides of the coin for investigating the human gut microbiome
- PMID: 36284112
- PMCID: PMC9596478
- DOI: 10.1038/s41598-022-20888-z
Natural and after colon washing fecal samples: the two sides of the coin for investigating the human gut microbiome
Abstract
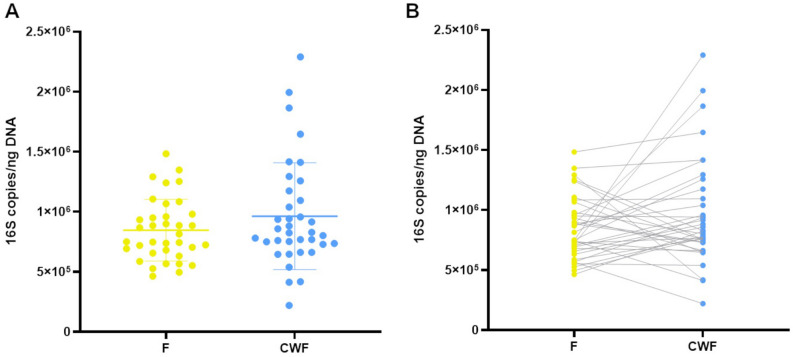
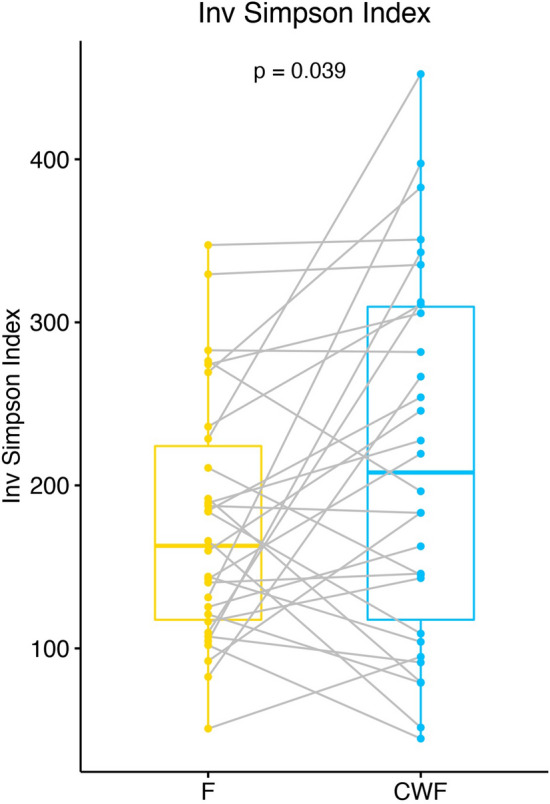
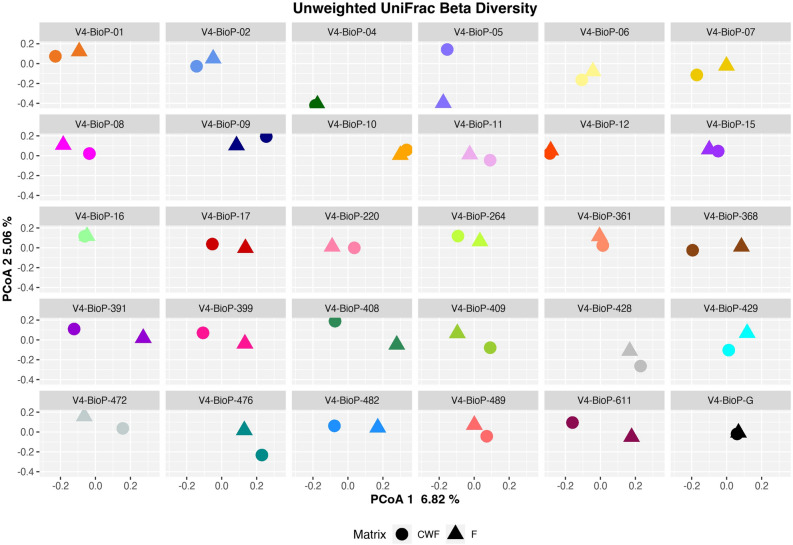
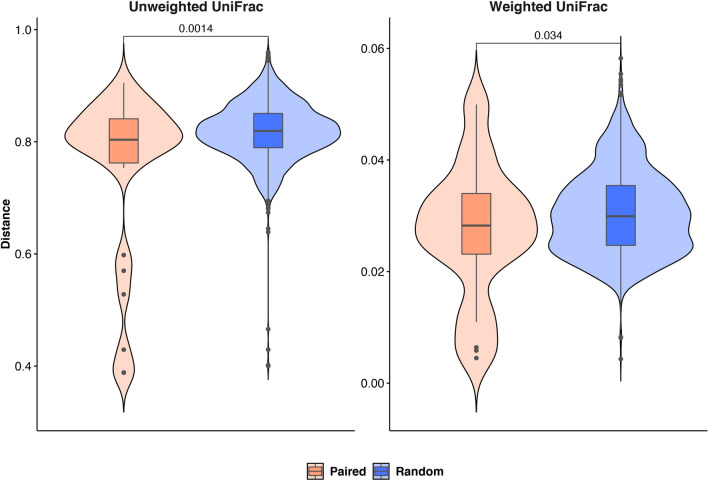
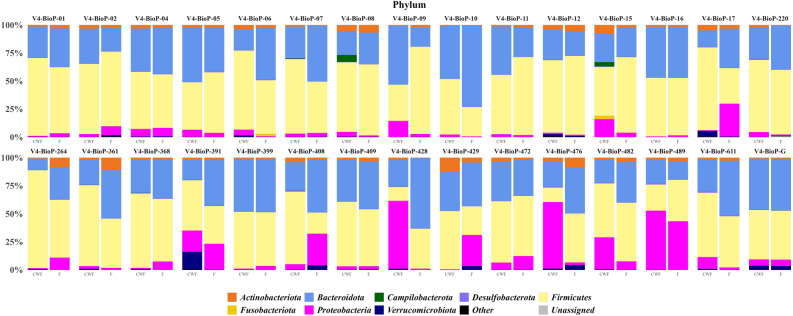
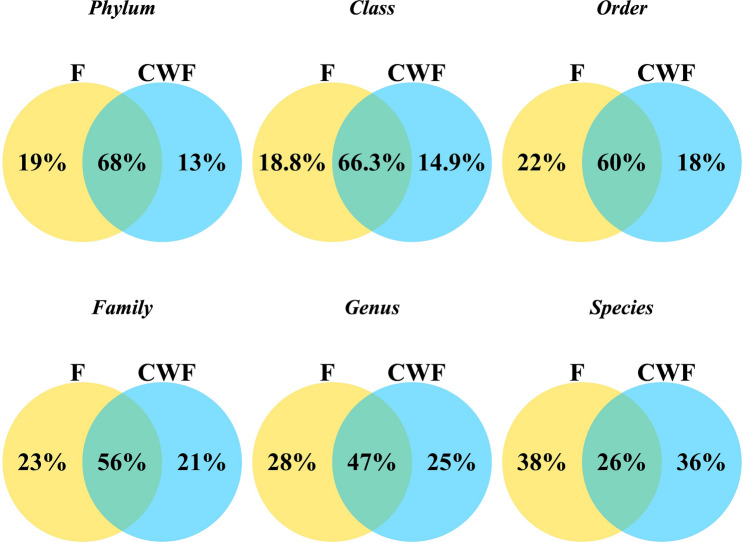
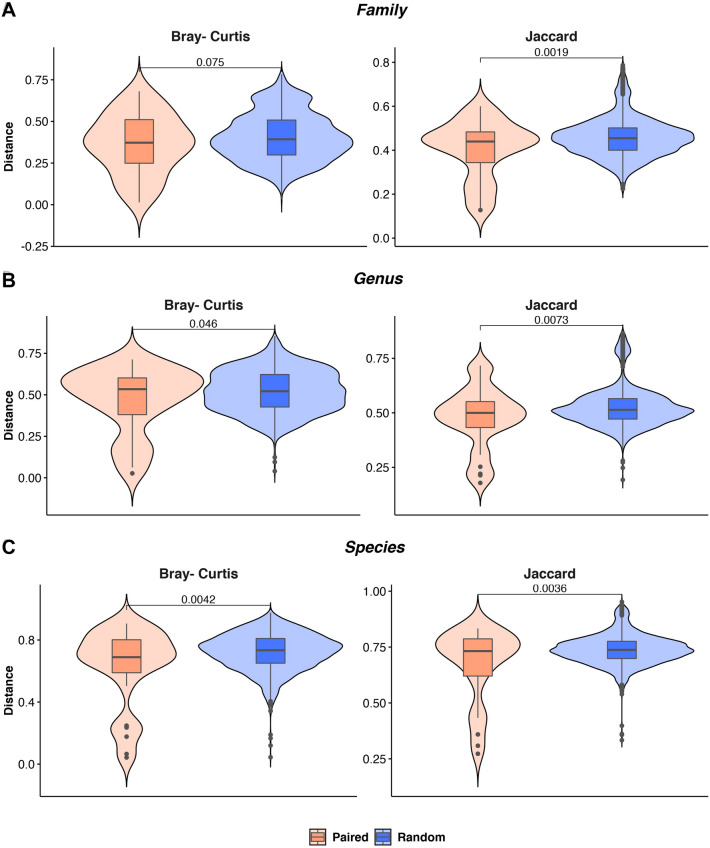
To date several studies address the important role of gut microbiome and its interplay with the human host in the health and disease status. However, the selection of a universal sampling matrix representative of the microbial biodiversity associated with the gastrointestinal (GI) tract, is still challenging. Here we present a study in which, through a deep metabarcoding analysis of the 16S rRNA gene, we compared two sampling matrices, feces (F) and colon washing feces (CWF), in order to evaluate their relative effectiveness and accuracy in representing the complexity of the human gut microbiome. A cohort of 30 volunteers was recruited and paired F and CWF samples were collected from each subject. Alpha diversity analysis confirmed a slightly higher biodiversity of CWF compared to F matched samples. Likewise, beta diversity analysis proved that paired F and CWF microbiomes were quite similar in the same individual, but remarkable inter-individual variability occurred among the microbiomes of all participants. Taxonomic analysis in matched samples was carried out to investigate the intra and inter individual/s variability. Firmicutes, Bacteroidota, Proteobacteria and Actinobacteriota were the main phyla in both F and CWF samples. At genus level, Bacteirodetes was the most abundant in F and CWF samples, followed by Faecalibacterium, Blautia and Escherichia-Shigella. Our study highlights an inter-individual variability greater than intra-individual variability for paired F and CWF samples. Indeed, an overall higher similarity was observed across matched F and CWF samples, suggesting, as expected, a remarkable overlap between the microbiomes inferred using the matched F and CWF samples. Notably, absolute quantification of total 16S rDNA by droplet digital PCR (ddPCR) revealed comparable overall microbial load between paired F and CWF samples. We report here the first comparative study on fecal and colon washing fecal samples for investigating the human gut microbiome and show that both types of samples may be used equally for the study of the gut microbiome. The presented results suggest that the combined use of both types of sampling matrices could represent a suitable choice to obtain a more complete overview of the human gut microbiota for addressing different biological and clinical questions.
© 2022. The Author(s).
Conflict of interest statement
The authors declare no competing interests.
Figures
References
-
- Ley RE, Peterson DA, Gordon JI. Ecological and evolutionary forces shaping microbial diversity in the human intestine. Cell. 2006;124:837–848. - PubMed
MeSH terms
Substances
LinkOut - more resources
Full Text Sources
