An asparagine metabolism-based classification reveals the metabolic and immune heterogeneity of hepatocellular carcinoma
- PMID: 36284275
- PMCID: PMC9594908
- DOI: 10.1186/s12920-022-01380-z
An asparagine metabolism-based classification reveals the metabolic and immune heterogeneity of hepatocellular carcinoma
Abstract
Introduction and objectives: hepatocellular carcinoma (HCC) is the major form of liver cancer with a poor prognosis. Amino acid metabolism has been found to alter in cancers and contributes to malignant progression. However, the asparagine metabolism status and relevant mechanism in HCC were barely understood.
Methods: By conducting consensus clustering and the least absolute shrinkage and selection operator regression of HCC samples from three cohorts, we classified the HCC patients into two subtypes based on asparagine metabolism level. The Gene Ontology, Kyoto Encyclopedia of Genes and Genomes analyses and Gene Set Enrichment Analysis of the differentially expressed genes between two subgroups were conducted. Immune cell infiltration was evaluated using CIBERSORT algorithm. The prognostic values of genes were analyzed by univariate and multivariate cox regression, ROC curve and Kaplan-Meier survival estimate analyses. Cell types of sing-cell RNA sequencing (scRNA-seq) data were clustered utilizing UMAP method.
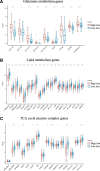
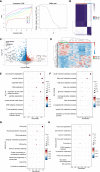
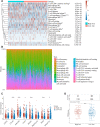
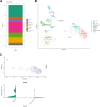
Results: HCC patients with higher asparagine metabolism level have worse prognoses. Moreover, we found the distinct energy metabolism patterns, DNA damage response (DDR) pathway activating levels, drug sensitivities to DDR inhibitors, immune cell compositions in the tumor microenvironment and responses to immune therapy between two subgroups. Further, we identified a potential target gene, glutamic-oxaloacetic transaminase 2 (GOT2). GOT2 downregulation was associated with worse HCC prognosis and increased infiltration of T regulatory cells (Tregs). ScRNA-seq revealed the GOT2 downregulation in cancer stem cells compared with HCC cells.
Conclusions: Taken together, HCC subtype which is more reliant on asparagine and glutamine metabolism has a worse prognosis, and a core gene of asparagine metabolism GOT2 is a potential prognostic marker and therapeutic target of HCC. Our study promotes the precision therapy of HCC and may improve patient outcomes.
Keywords: Asparagine metabolism; DNA damage response; GOT2; Hepatocellular carcinoma; Tumor microenvironment.
© 2022. The Author(s).
Conflict of interest statement
The authors declare that they have no competing interests.
Figures


Similar articles
-
The glycolytic characteristics of hepatocellular carcinoma and its interaction with the microenvironment: a comprehensive omics study.J Transl Med. 2025 Apr 10;23(1):424. doi: 10.1186/s12967-025-06421-6. J Transl Med. 2025. PMID: 40211257 Free PMC article.
-
Integrated analysis reveals an aspartate metabolism-related gene signature for predicting the overall survival in patients with hepatocellular carcinoma.Clin Transl Oncol. 2024 Sep;26(9):2181-2197. doi: 10.1007/s12094-024-03431-6. Epub 2024 Mar 12. Clin Transl Oncol. 2024. PMID: 38472558
-
Multiple-omics analysis of aggrephagy-related cellular patterns and development of an aggrephagy-related signature for hepatocellular carcinoma.World J Surg Oncol. 2025 Apr 30;23(1):175. doi: 10.1186/s12957-025-03816-z. World J Surg Oncol. 2025. PMID: 40307857 Free PMC article.
-
Metabolic rearrangements and intratumoral heterogeneity for immune response in hepatocellular carcinoma.Front Immunol. 2023 Jan 25;14:1083069. doi: 10.3389/fimmu.2023.1083069. eCollection 2023. Front Immunol. 2023. PMID: 36776894 Free PMC article. Review.
-
Obesity contributes to hepatocellular carcinoma development via immunosuppressive microenvironment remodeling.Front Immunol. 2023 May 17;14:1166440. doi: 10.3389/fimmu.2023.1166440. eCollection 2023. Front Immunol. 2023. PMID: 37266440 Free PMC article. Review.
Cited by
-
CD69 serves as a potential diagnostic and prognostic biomarker for hepatocellular carcinoma.Sci Rep. 2023 May 8;13(1):7452. doi: 10.1038/s41598-023-34261-1. Sci Rep. 2023. PMID: 37156819 Free PMC article.
-
The glycolytic characteristics of hepatocellular carcinoma and its interaction with the microenvironment: a comprehensive omics study.J Transl Med. 2025 Apr 10;23(1):424. doi: 10.1186/s12967-025-06421-6. J Transl Med. 2025. PMID: 40211257 Free PMC article.
-
Molecular classification of hepatocellular carcinoma based on zoned metabolic feature and oncogenic signaling pathway.Clin Mol Hepatol. 2025 Jul;31(3):981-1002. doi: 10.3350/cmh.2024.1088. Epub 2025 Mar 11. Clin Mol Hepatol. 2025. PMID: 40065709 Free PMC article.
-
Influenced tumor microenvironment and tumor immunity by amino acids.Front Immunol. 2023 Jan 31;14:1118448. doi: 10.3389/fimmu.2023.1118448. eCollection 2023. Front Immunol. 2023. PMID: 36798123 Free PMC article. Review.
-
Metabolic Reprogramming of HCC: A New Microenvironment for Immune Responses.Int J Mol Sci. 2023 Apr 18;24(8):7463. doi: 10.3390/ijms24087463. Int J Mol Sci. 2023. PMID: 37108625 Free PMC article. Review.
References
-
- Llovet J, Zucman-Rossi J, Pikarsky E, Sangro B, Schwartz M, Sherman M, et al. Hepatocellular carcinoma. Nat Rev Dis Primers. 2016;2:16018. - PubMed
-
- Finn RS, Qin S, Ikeda M, Galle PR, Ducreux M, Kim TY, et al. Atezolizumab plus bevacizumab in unresectable hepatocellular carcinoma. N Engl J Med. 2020;382(20):1894–1905. - PubMed
MeSH terms
Substances
LinkOut - more resources
Full Text Sources
Medical
Miscellaneous

