. 2022 Oct 25;41(1):314.
doi: 10.1186/s13046-022-02523-x.

B3GALT4 remodels the tumor microenvironment through GD2-mediated lipid raft formation and the c-met/AKT/mTOR/IRF-1 axis in neuroblastoma

Affiliations

B3GALT4 remodels the tumor microenvironment through GD2-mediated lipid raft formation and the c-met/AKT/mTOR/IRF-1 axis in neuroblastoma

Yong-Liang Sha et al. J Exp Clin Cancer Res. .

Abstract

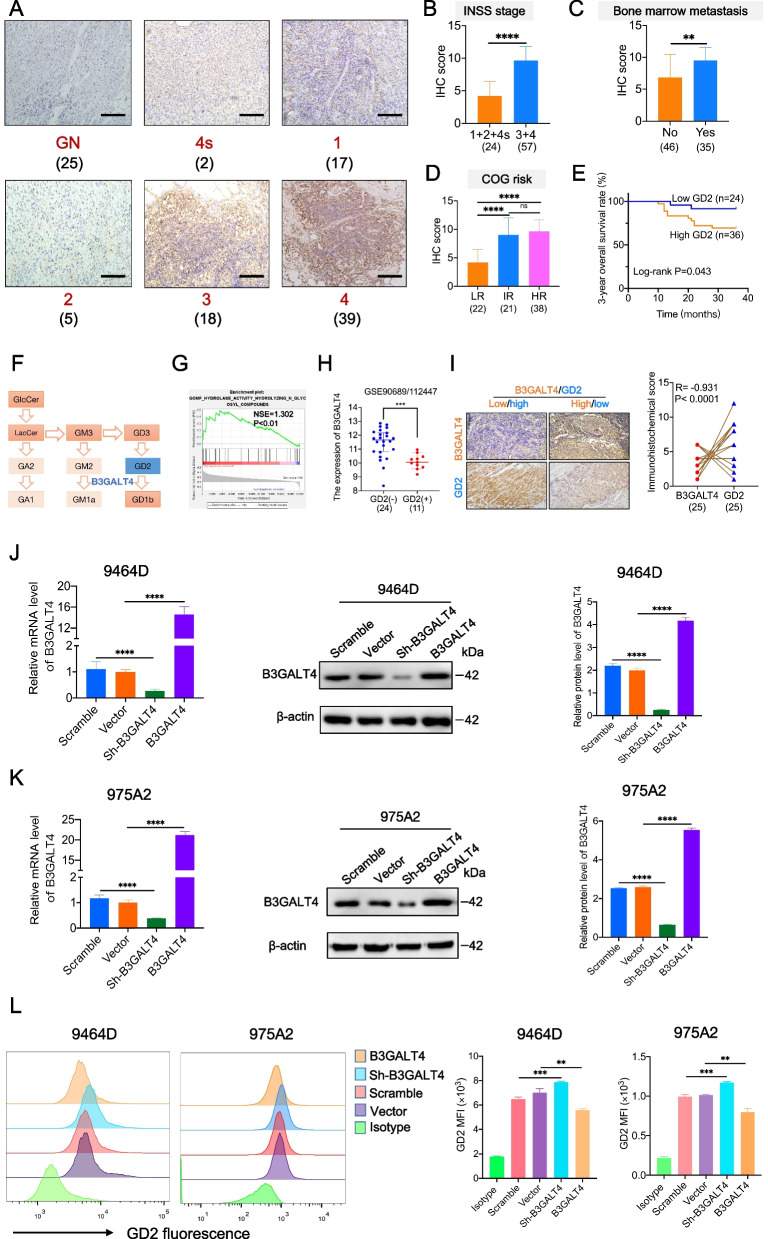
Background: Beta-1,3-galactosyltransferase-4 (B3GALT4) plays a critical regulatory role in tumor biology. However, the role of B3GALT4 in modulating the tumor microenvironment (TME) of neuroblastoma (NB) remains unknown.

Methods: Public datasets and clinical NB samples were collected to evaluate the expression and clinical significance of GD2 and B3GALT4 in NB patients. CCK-8, colony formation, and transwell assays and experiments in tumor-bearing mouse models were conducted to investigate the function of B3GALT4. Flow cytometry, ELISA, immunohistochemistry, immunofluorescence, western blotting, and chemotaxis assays were conducted to ascertain the immunomodulatory mechanism of B3GALT4. The combined therapeutic effect of the lipid raft inhibitor MβCD and anti-GD2 mAb was validated in a murine model of NB.

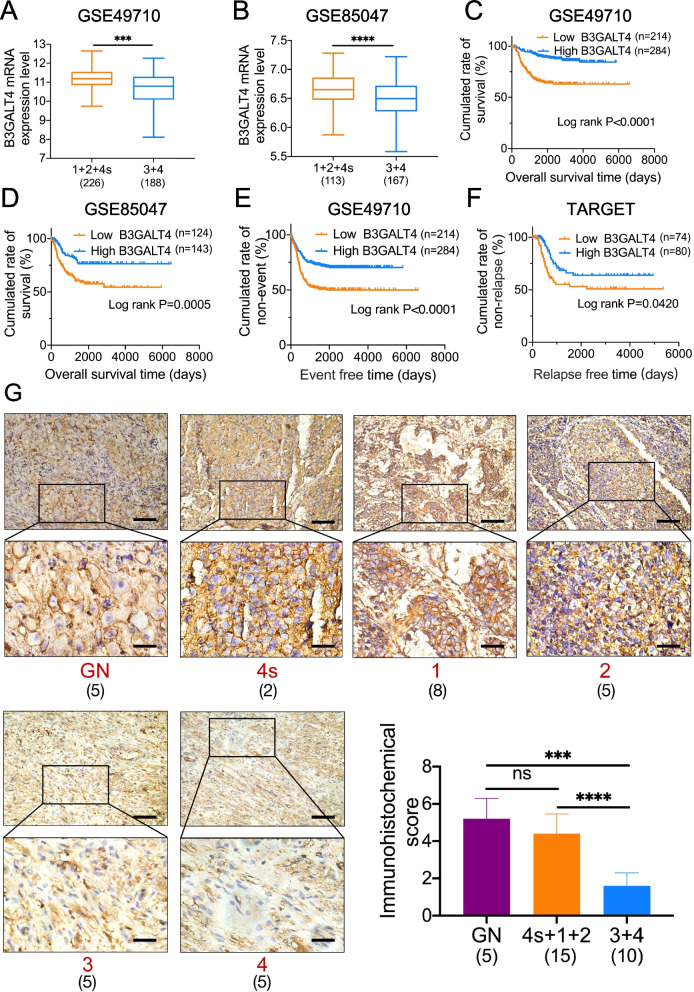
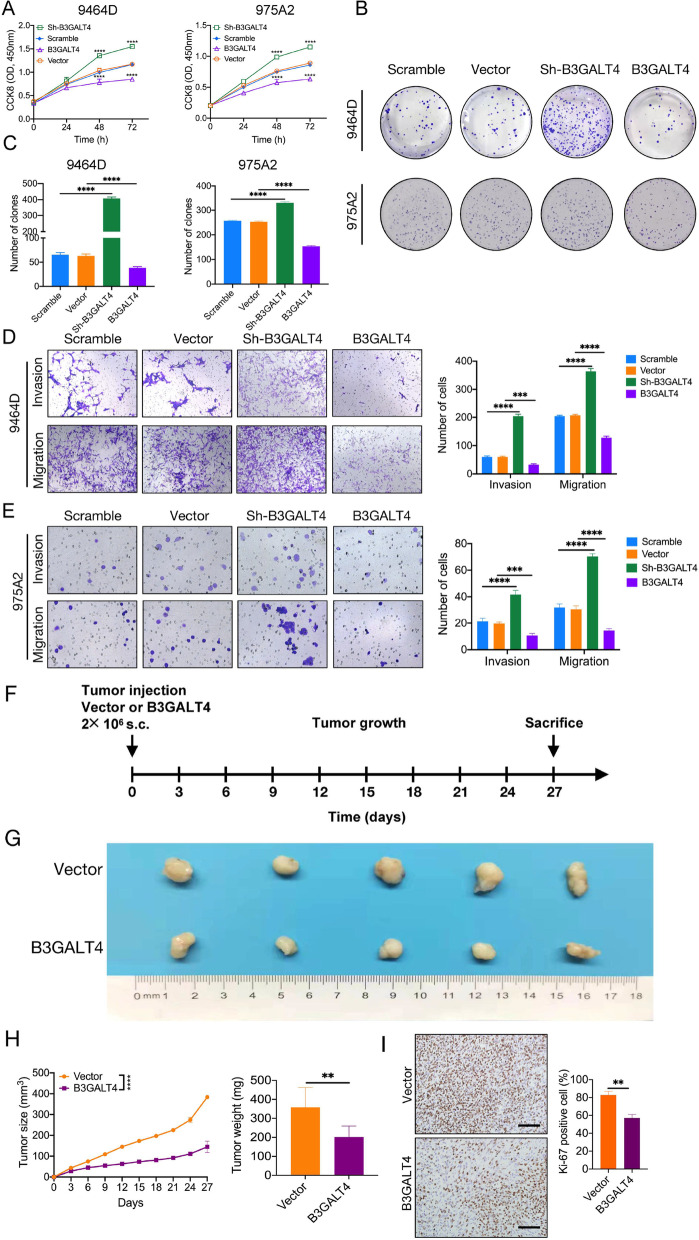
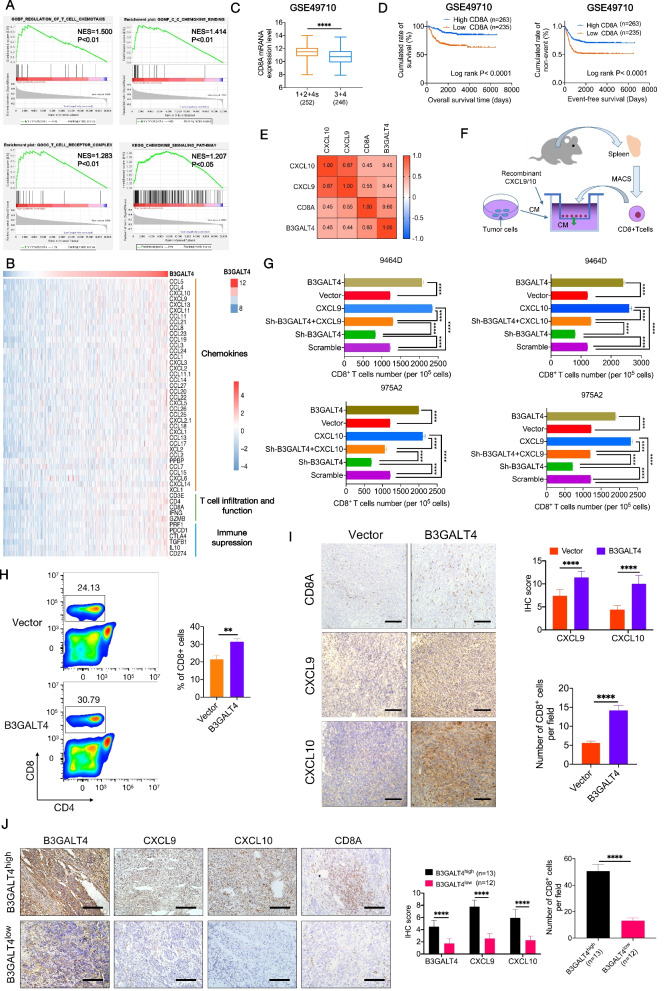
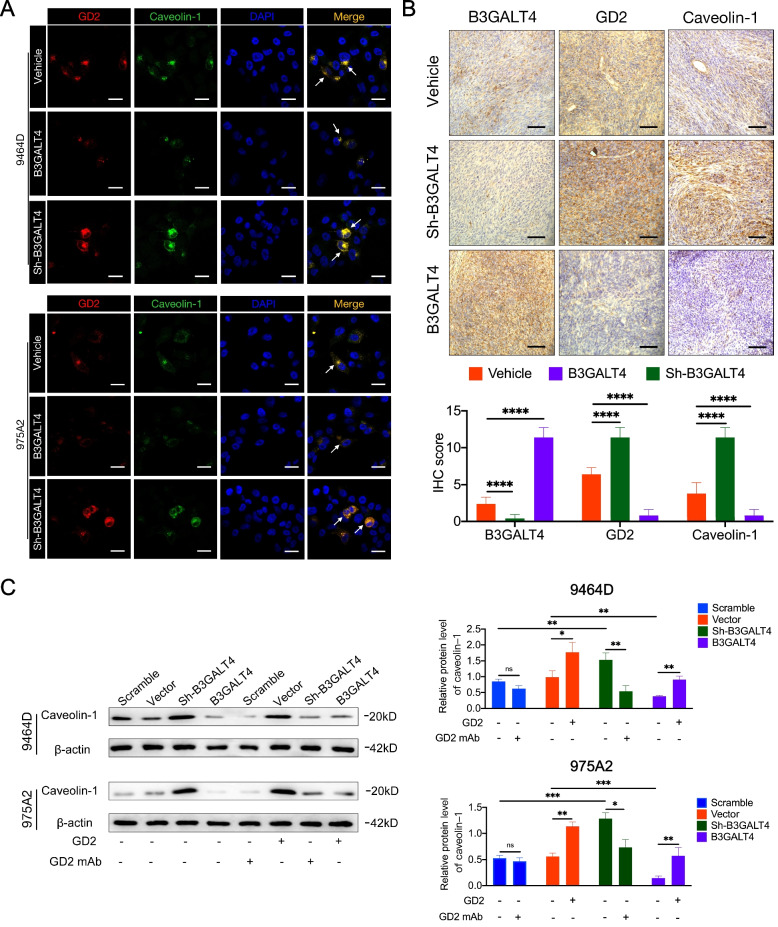
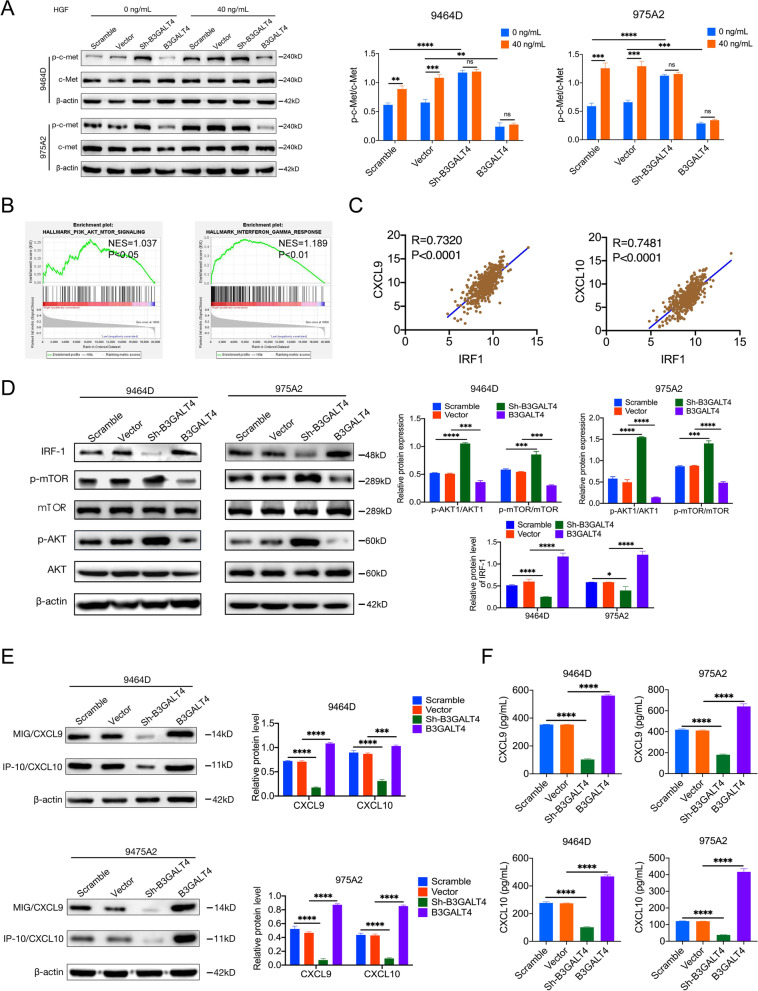
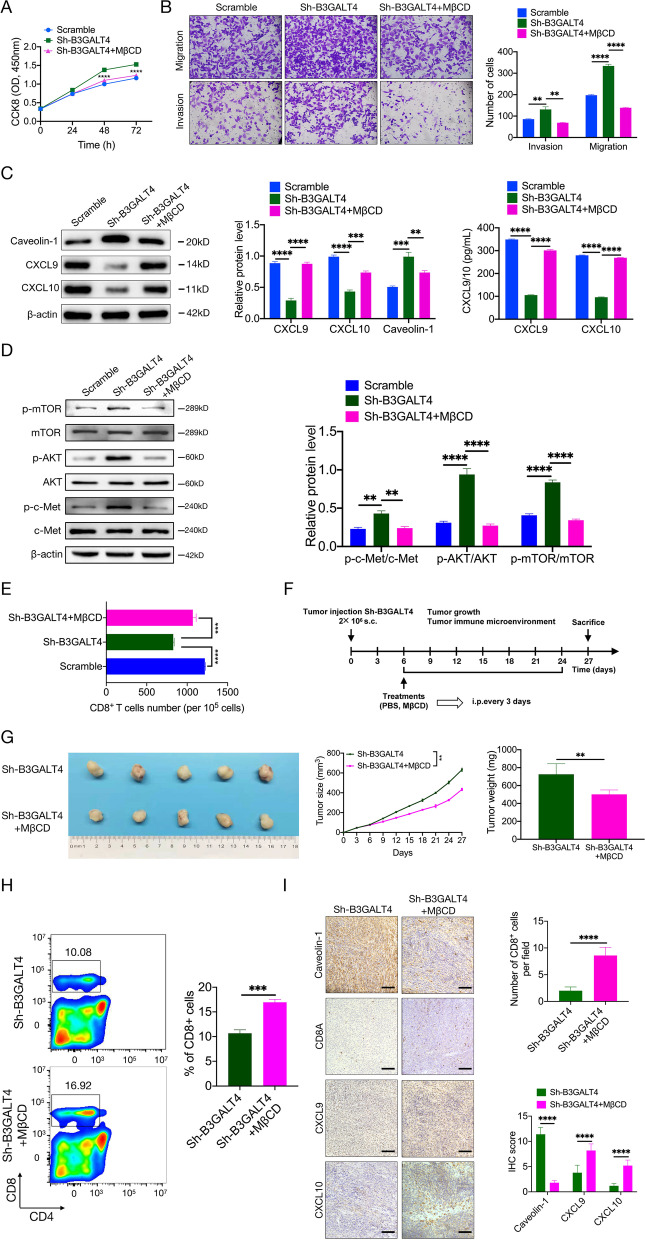
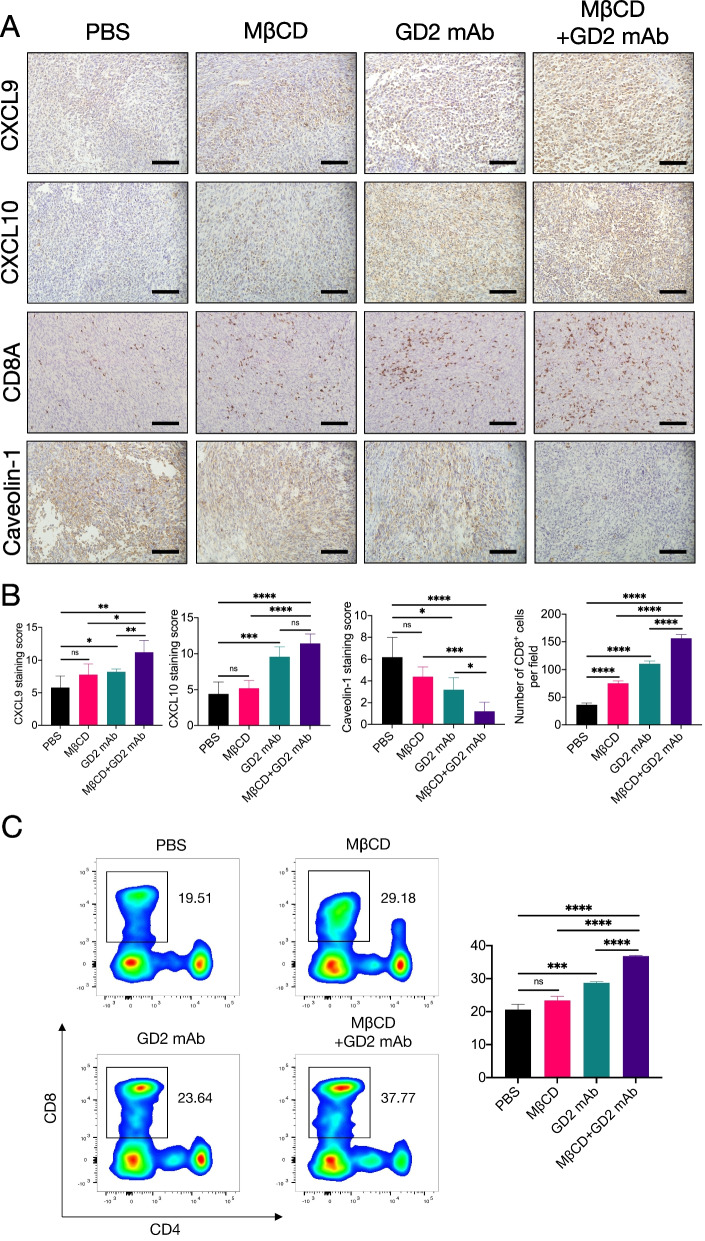
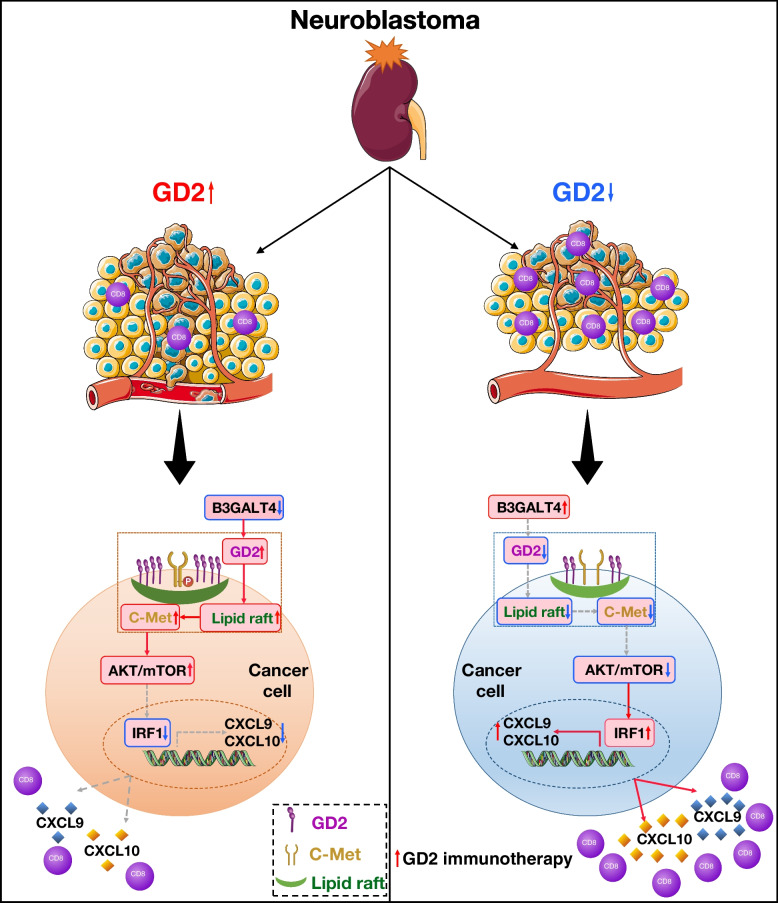
Results: GD2 was overexpressed in NB tissues and high expression of GD2 was associated with poor prognosis in NB patients. B3GALT4 was downregulated in NB tissues, and low expression of B3GALT4 indicated poor prognosis in NB patients. Silencing B3GALT4 significantly enhanced tumor progression both in vitro and in vivo. Meanwhile, the overexpression of B3GALT4 increased the recruitment of CD8+ T lymphocytes via the chemokines CXCL9 and CXCL10. Additionally, B3GALT4 regulated NB-cell GD2 expression and lipid raft formation. Mechanistically, B3GALT4 regulated the expression of CXCL9 and CXCL10 via the c-Met signaling in the lipid rafts and the downstream AKT/mTOR/IRF-1 pathway. The lipid raft inhibitor, MβCD, attenuated B3GALT4 deficiency-induced tumor progression and immune evasion. Last, MβCD combined with anti-GD2 mAb treatment significantly enhanced the antitumor effect and the infiltration of CD8+ T cells.

Conclusions: Upregulation of B3GALT4 promotes the secretion of CXCL9 and CXCL10 to recruit CD8+ T lymphocytes via the GD2-mediated lipid rafts and the c-Met/AKT/mTOR/IRF-1 pathway. Moreover, lipid raft inhibitors may enhance the efficacy of anti-GD2 immunotherapy for NB.

Keywords: Beta-1,3-galactosyltransferase-4; CD8+ T-cell chemokine; Ganglioside GD2; Immunotherapy; Lipid raft; Neuroblastoma.


Conflict of interest statement

The authors declare that they have no competing interests.

Figures

Fig. 1
Fig. 1
Overexpression of GD2 in NB tumor tissues is mediated by B3GALT4. A Immunohistochemistry (IHC) analysis of GD2 expression in ganglioneuroma (GN) (n = 25) and neuroblastoma (NB) tumor tissues (n = 81). Scale bar: 100 μm. B The correlation between the International Neuroblastoma Staging System (INSS) stage and GD2 expression of NB was analyzed. C IHC scores were applied to assess GD2 expression in NB specimens with or without bone marrow metastasis. D The correlation between the Children’s Oncology Group (COG) stage and GD2 expression of NB was analyzed. E Kaplan-Meier survival curve for 3-year overall survival of 60 NB patients in the 81 patients (Fig. 1A-D) according to GD2 expression levels (log-rank test and the p-value is shown). F B3GALT4 was a crucial enzyme for ganglioside GD2 synthesis. G Gene set enrichment analysis (GSEA) analysis showed that B3GALT4 overexpression was enriched in hydrolyzing N-glycosyl compounds based on data from the GEO database (GSE49710). H Differences in B3GALT4 level between GD2 (+) and GD2 (−) NB samples from the GEO databases (GSE90689 and GSE112447). I Negative correlation between the expression level of GD2 and B3GALT4 in NB tissues (n = 25). Scale bar: 100 μm. J, K B3GALT4 knockdown and overexpression 9464D and 975A2 stable cell lines were constructed using recombinant lentiviral transfection. The overexpression and knockdown efficiency were detected by quantitative real-time polymerase chain reaction (qRT-PCR) and western blotting. Quantitative data are shown as means ± SEM from three independent experiments. Representative Western blots and bar charts are shown. (L) Representative flow cytometric analysis images of GD2 levels in 9464D and 975A2 cells with different treatments and statistical analysis results
Fig. 2
Fig. 2
B3GALT4 is down-regulated in NB tissues, and deficient B3GALT4 indicates a poor prognosis. A bioinformatics study was conducted to analyze the B3GALT4 expression levels in INSS stages 1 + 2 + 4 s versus 3 + 4 NB patients based on the GSE49710 (A) and GSE85047 (B) datasets. Kaplan-Meier analysis of overall survival (OS) (C, D), event-free survival (EFS) (E), and relapse-free survival (RFS) (F) using the TARGET database and GEO datasets median expression value cutoffs for B3GALT4. P-value was determined by a log-rank test. G IHC was performed to detect B3GALT4 expression in GN (n = 5) and NB (n = 25) tumor tissues (scale bars of the initial images: 100 μm, inset: scale bars of magnification: 25 μm)
Fig. 3
Fig. 3
Elevated B3GALT4 inhibits NB progression in vitro and in vivo. CCK-8 (A) and colony formation assays (B, C) were performed to determine the proliferation of 9464D and 975A2 cells transfected with B3GALT3 overexpression and knockdown lentivirus. Transwell assays were performed to analyze the invasion and migration abilities of 9464D (D) and 975A2 (E) cells. F Approximately 2 × 1069464D cells infected with vector or overexpressed B3GALT4 plasmids were injected subcutaneously into the back of C57BL/6 mice (n = 5 mice per group). G After 27 days, the mice were sacrificed, and the tumors were harvested. H The tumor volumes were measured every 3 days and shown in the line chart (Left). The final weights of tumors were calculated (Right). I IHC staining for Ki-67 in the indicated tumors. Scale bar: 100 μm
Fig. 4
Fig. 4
B3GALT4 modulates CD8+ T lymphocyte migration and tumor infiltration via CXCL9 and CXCL10. A GSEA analysis indicated that B3GALT4 overexpression was enriched in T cell chemotaxis and chemokine-mediated signaling pathways based on data from the GEO database (GSE49710). B Integrated molecular analysis of mRNA expression of genes from the GSE49710 dataset was performed based on the B3GALT4 mRNA expression level. C Box plot demonstrating CD8A mRNA expression level in NB tissues (stages 1 + 2 + 4 s versus stages 3 + 4) from the GSE49710 dataset. D Survival analysis showed CD8A expression levels were significantly related to EFS and OS of NB patients in the GSE49710 dataset. E Correlation analysis between B3GALT4, CD8A, and chemokines (CXCL9 and CXCL10) mRNA expression levels in the GSE49710 database. F Schematic diagram of in vivo chemotaxis assay of CD8+ T cell migration. G Transwell assay analysis of CD8+ T cell migration ability in the supernatants of tumor cells with different treatments. H The percentages of CD8+ T cells in tumors from subcutaneous xenograft mouse models were assessed by FACS. Bar graphs showed the mean ± SD of three independent experiments. I IHC was done to evaluate CD8, CXCL9, and CXCL10 expression in NB tissues derived from tumor xenografts in mice. J IHC staining results of the B3GALT4, CD8A, CXCL9, and CXCL10 expression in tumor samples from NB patients with B3GALT4 high (n = 13) or low expression (n = 12)
Fig. 5
Fig. 5
Modulatory role of ganglioside GD2 on lipid rafts. A Immunofluorescence colocalization of GD2 and caveolin-1 in 9464D and 975A2 cells with silenced or overexpression of B3GALT4. Scale bar: 50 μm. B IHC was used to evaluate B3GALT4, GD2, and caveolin-1 expression in NB tissues derived from tumor xenografts in mice, n = 5. Scale bar: 100 μm. C Western blot was conducted to analyze the expression of caveolin-1 in lipid rafts of 9464D and 975A2 cells with treatment with ganglioside GD2 or GD2 mAb
Fig. 6
Fig. 6
The c-Met/AKT/mTOR/IRF-1 pathway is essential for synthesizing CXCL9 and CXCL10 regulated by B3GALT4. A Western blot analysis of the protein level of c-Met and the phosphorylation of c-Met in lipid rafts of 9464D and 975A2 cells with treatment with hepatocyte growth factor (HGF) (40 ng/ml, 24 h). B GSEA analysis showed that B3GALT4 overexpression was enriched in PI3K/AKT/mTOR and interferon regulatory factor-1 (IFN-γ) pathways based on data from the GEO database (GSE49710). (C) Correlation analysis of CXCL9, CXCL10, and IRF-1 expression levels in human NB specimens from the GSE49710 database. D, E Western blot analysis of the protein level of mTOR, p-mTOR, AKT, p-AKT, IRF-1, CXCL9, and CXCL10 in 9464D and 975A2 cells. F Enzyme-linked immunosorbent assay (ELISA) analysis of CXCL9 and CXCL10 in the 9464D and 975A2 cells supernatants
Fig. 7
Fig. 7
Treatment of lipid raft inhibitor, MβCD, suppresses low B3GALT4-mediated NB progression and CD8+ T cells recruitment. A The effects of MβCD on 9464D cell proliferation were measured by a CCK-8 assay. B The impacts of MβCD on 9464D cell migration and invasion. C Western blot and ELISA have shown that the treatment of MβCD can enhance knockdown B3GALT4-mediated CXCL9 and CXCL10 production and inhibit caveolin-1 expression in lipid rafts. D Western blot showed that the treatment of MβCD could reverse knockdown B3GALT4-mediated activation of the c-Met/AKT/mTOR pathway. E Chemotaxis assays showed that the treatment of MβCD could improve knockdown B3GALT4-mediated CD8+ T cell migration. F The in vivo experimental procedure scheme was detailed in the “Materials and Methods” and “Results” sections. G In vivo assays showed that the treatment of MβCD could block knockdown B3GALT4-mediated NB growth. H Flow cytometric analyzed the population of intratumoral CD8+ T cells between groups on day 27, respectively, n = 5. I Representative IHC images of serial sections derived from the tumor xenografts were stained for caveolin-1, CD8A, CXCL9, and CXCL10. Left, representative pictures of IHC staining (scale bar: 100 μm). Right, a statistic of CD8+ T cells per section, the digital quantification of the histoscore of CXCL9 and CXCL10
Fig. 8
Fig. 8
Increased intratumoral CD8+ T cell infiltration after MβCD plus anti-GD2 treatment is mediated by CXCL9 and CXCL10. A Representative images of CD8A, CXCL9, CXCL10, and caveolin-1 immunohistochemical staining of tumors treated with PBS, MβCD, or anti-GD2 mAb (scale bar: 100 μm). B A bar graph showed the IHC score quantification of CXCL9, CXCL10, and caveolin-1. Quantifications of CD8+ T cells percentage from mice treated with different conditions as indicated. C Flow cytometric analysis (left) and statistical analysis (right) of the numbers of CD8+ T cells per mg of tumors in mice 21 days after the beginning of treatments
Fig. 9
Fig. 9
Schematic representation of this study. B3GALT4 overexpression promotes CXCL9 and CXCL10 expression and secretion via the inhibition of c-Met signaling in the lipid raft, accompanied by the downstream Akt/mTOR/IRF-1 signaling pathway. The secreted chemokines recruit CD8+ T lymphocytes to the tumor microenvironment. In particular, lipid raft inhibitor combined with anti-GD2 mAb significantly suppressed tumor growth in the 9464D-derived tumor xenografts in vivo

Similar articles

Cited by

References

    1. Alexander F. Neuroblastoma. Urol Clin North Am. 2000;27(3):383–392. - PubMed
    1. Voeller J, Sondel PM. Advances in anti-GD2 immunotherapy for treatment of high-risk neuroblastoma. J Pediatr Hematol Oncol. 2019;41(3):163–169. - PMC - PubMed
    1. Zoine JT, Knight KA, Fleischer LC, Sutton KS, Goldsmith KC, Doering CB, et al. Ex vivo expanded patient-derived gammadelta T-cell immunotherapy enhances neuroblastoma tumor regression in a murine model. Oncoimmunology. 2019;8(8):1593804. - PMC - PubMed
    1. Layer JP, Kronmuller MT, Quast T, van den Boorn-Konijnenberg D, Effern M, Hinze D, et al. Amplification of N-Myc is associated with a T-cell-poor microenvironment in metastatic neuroblastoma restraining interferon pathway activity and chemokine expression. Oncoimmunology. 2017;6(6):e1320626. - PMC - PubMed
    1. Griffith JW, Sokol CL, Luster AD. Chemokines and chemokine receptors: positioning cells for host defense and immunity. Annu Rev Immunol. 2014;32:659–702. - PubMed