

Nsp16 shields SARS-CoV-2 from efficient MDA5 sensing and IFIT1-mediated restriction
- PMID: 36285486
- PMCID: PMC9724656
- DOI: 10.15252/embr.202255648
Nsp16 shields SARS-CoV-2 from efficient MDA5 sensing and IFIT1-mediated restriction
Abstract
Methylation of the mRNA 5' cap by cellular methyltransferases enables efficient translation and avoids recognition by innate immune factors. Coronaviruses encode viral 2'-O-methyltransferases to shield their RNA from host factors. Here, we generate recombinant SARS-CoV-2 harboring a catalytically inactive 2'-O-methyltransferase Nsp16, Nsp16mut, and analyze viral replication in human lung epithelial cells. Although replication is only slightly attenuated, we find SARS-CoV-2 Nsp16mut to be highly immunogenic, resulting in a strongly enhanced release of type I interferon upon infection. The elevated immunogenicity of Nsp16mut is absent in cells lacking the RNA sensor MDA5. In addition, we report that Nsp16mut is highly sensitive to type I IFN treatment and demonstrate that this strong antiviral effect of type I IFN is mediated by the restriction factor IFIT1. Together, we describe a dual role for the 2'-O-methyltransferase Nsp16 during SARS-CoV-2 replication in avoiding efficient recognition by MDA5 and in shielding its RNA from interferon-induced antiviral responses, thereby identifying Nsp16 as a promising target for generating attenuated and highly immunogenic SARS-CoV-2 strains and as a potential candidate for therapeutic intervention.
Keywords: 2′-O-methyltransferase; IFIT1; MDA5; Nsp16; SARS-CoV-2.
© 2022 The Authors. Published under the terms of the CC BY NC ND 4.0 license.
Figures
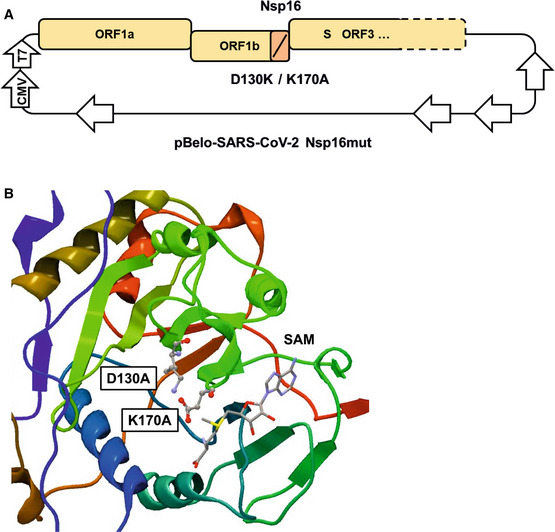
Schematic depiction of Nsp16 modifications within the bacterial artificial chromosome pBelo‐SARS–CoV‐2 Nsp16mut. Not drawn to scale.
Inactivating mutations of aspartic acid residue 130 to Alanine (D130A) and lysine residue 170 to Alanine (K170A) within the active center of Nsp16, based on the publicly available crystal structure of Nsp16 (PDB 6W4H). SAM, S‐Adenosyl methionine.
- A
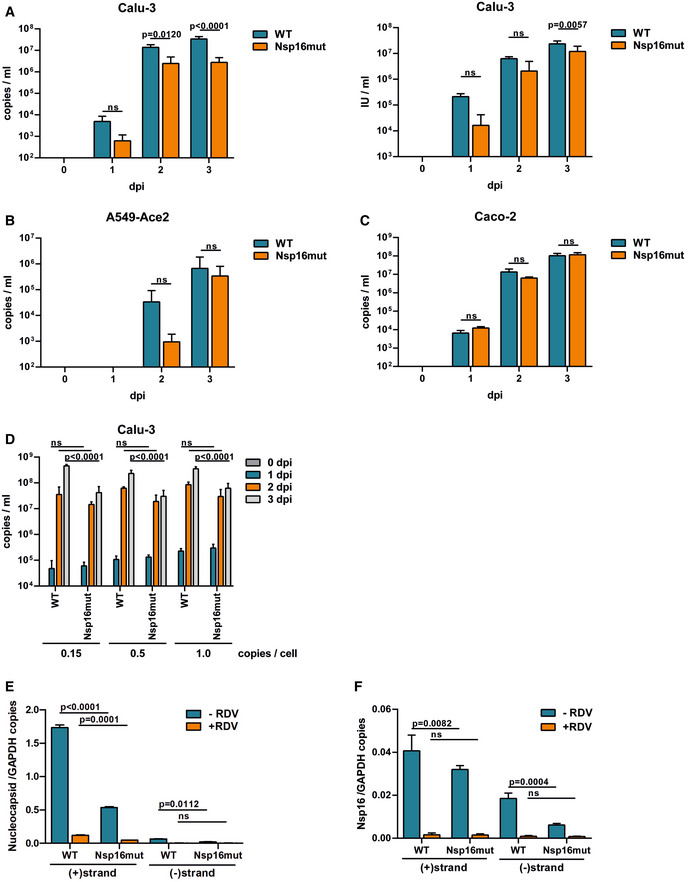
Calu‐3 cells were infected in triplicates with normalized amounts of recombinant SARS–CoV‐2 wt (WT) or Nsp16mut at 0.015 RNA copies/cell (left) or 0.003 IU/cell (right).
- B
A549 cells were transduced with lentiviral particles encoding the SARS–CoV‐2 receptor ACE2 and infected in triplicates with SARS–CoV‐2 wt (WT) or Nsp16mut at 0.025 RNA copies/cell the next day.
- C
Caco‐2 cells were infected with SARS–CoV‐2 wt (WT) or Nsp16mut at 0.015 RNA copies/cell.
- D
Calu‐3 cells were infected with the indicated increasing amounts of SARS–CoV‐2 wt (WT) or Nsp16mut (copies/well).
- E, F
Calu‐3 cells were inoculated with SARS–CoV‐2 wt or Nsp16mut at 0.02 RNA copies/cell in the presence or absence of 200 nM Remdesivir (RDV). At 24 h postinfection, cells were washed and intracellular levels of Nucleocapsid (E) or Nsp16 (F) transcripts were quantified by droplet digital PCR using minus (−) or plus (+) strand‐specific oligos. SARS‐CoV‐2 transcripts were normalized to GAPDH transcript copy number. Results are plotted as mean of triplicate PCR reactions (technical repeats) with error bars representing the SD. One out of three independent biological repeats is shown (n = 3).
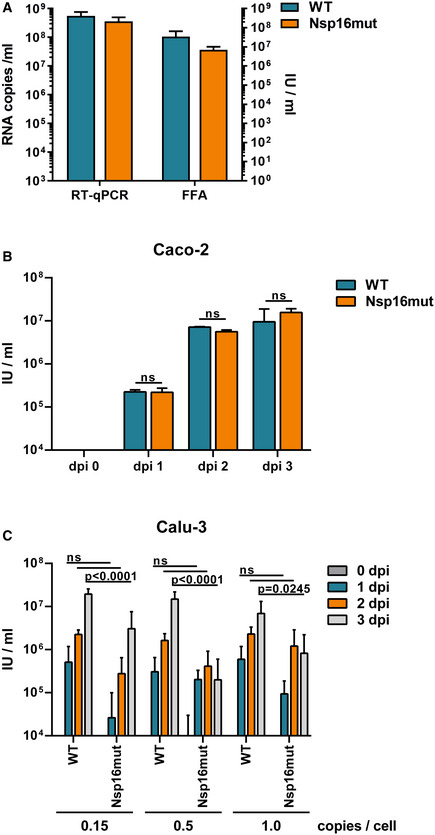
Quantification of SARS–CoV‐2 WT and Nsp16mut virus stocks using RT–qPCR or focus forming assay. Supernatant from transfected Caco2‐MDA5 KO cells was collected at 3 dpi and quantified by RT–qPCR or focus forming assay (FFA). RT–qPCR: SARS–CoV‐2 WT: 5.59 × 10⁸ copies/ml; Nsp16mut 3.56 × 10⁸ copies/ml. FFA: SARS‐CoV‐2 WT: 1.0 × 10⁸ IU/ml; Nsp16mut 3.7 × 10⁷ IU/ml. Results are plotted as mean of triplicate reactions (technical replicates) with error bars representing the SD. One out of two independent experiments is shown (n = 2).
Quantification of SARS–CoV‐2 WT and Nsp16mut infecrtion of Caco‐2 cells using focus forming assay. Results are plotted as mean of triplicate infections (biological replicates) with error bars representing the SD. One out of three independent experiments is shown (n = 3).
Quantification of Calu‐3 cell infection with increasing amounts of SARS–CoV‐2 WT and Nsp16mut using focus forming assay. Results are plotted as mean of triplicate infections (biological replicates) with error bars representing the SD. One out of three independent experiments is shown (n = 3).
As in Fig 2, Calu‐3 cells were inoculated with SARS–CoV‐2 wt (WT) or Nsp16mut at 0.02 RNA copies/cell in the presence or absence of 200 nM Remdesivir (RDV). At 24 h postinfection, cells were washed and intracellular levels of Nsp16 transcripts were quantified by droplet digital PCR using plus (+) strand‐specific or GAPDH‐specific oligos.
Average GAPDH transcript copy numbers for each condition are plotted (biological replicates, n = 3).
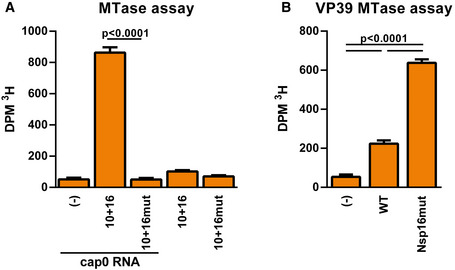
In vitro Methyltransferase activity. Recombinant proteins Nsp10 and Nsp16 wt or Nsp16mut were combined with cap0 RNA and Adenosyl‐L‐methionine ([methyl‐3H] SAM) for 90 min at 37°C. Methylation of cap0 RNA was quantified using a scintillation counter (Beckmann). (−) Control did not contain any recombinant protein. Results are plotted as mean of triplicate reactions with error bars representing SD. One out of three independent biological repeats is shown.
MTase activity of Nsp16 upon viral infection. Cellular mRNA was purified 24 h postinfection with SARS–CoV‐2 wt or Nsp16mut (triplicate infections, biological replicates). Purified mRNA was incubated with 100 U of the recombinant MTase VACV VP39 (NEB) and [methyl‐3H] SAM for 90 min at 37°C. Methylation of mRNA from SARS–CoV‐2 infected cells was quantified using a scintillation counter (DPM3H; Beckmann). (−) Control did not contain cellular RNA. Results are plotted as mean of triplicate infections with error bars representing SD. One out of three independent experiments is shown (n = 3).
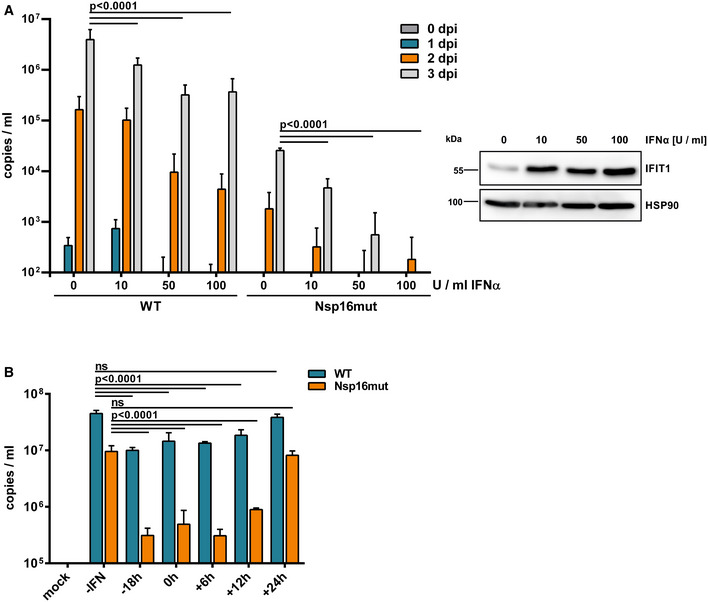
Calu‐3 cells were incubated with the indicated amounts of type I IFN 24 h prior to infection with normalized amounts of SARS–CoV‐2 wt (WT) or Nsp16mut at 0.015 RNA copies/cell. Viral load in the supernatant was quantified at the indicated time points by RT–qPCR targeting viral polymerase RdRp. Results are plotted as mean of triplicate infections with error bars representing the SD (biological replicates). One out of three independent experiments is shown (n = 3). Three days postinfection, protein expression of IFIT1 was analyzed by immunoblot to control for type I IFN treatment. Membranes were probed with antibodies targeting IFIT1 and the housekeeping gene HSP90.
Calu‐3 cells were incubated with medium (‐IFN) or 100 U/well type I IFN at the indicated time points prior‐ or postinfection. Cells were infected with normalized amounts of SARS–CoV‐2 wt (WT) or Nsp16mut at 0.015 RNA copies/cell. Viral load in the supernatant was quantified at 3 dpi by RT–qPCR targeting viral polymerase RdRp. Results are plotted as mean of triplicate infections with error bars representing the SD (biological replicates). One out of three independent experiments is shown (n = 3).

- A
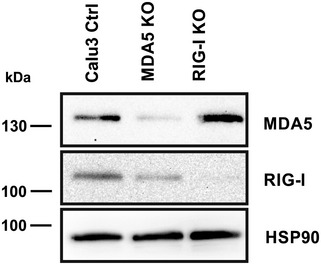
Calu‐3 cells lacking MDA5 (MDA5 KO), RIG‐I (RIG‐I KO), or luciferase KO control cells (Ctrl) were infected with normalized amounts of SARS–CoV‐2 wt (WT) with 0.015 RNA copies/cell. Viral load in the supernatant was quantified at the indicated time points by RT–qPCR targeting viral polymerase RdRp. Results are plotted as mean of triplicate infections with error bars representing the SD (biological replicates).
- B
Calu‐3 cells lacking MDA5 (MDA5 KO), RIG‐I (RIG‐I KO), cGAS (cGAS KO), or control KO cells (Ctrl) were inoculated with normalized amounts of Nsp16mut with 0.015 RNA copies/cell. Viral load in the supernatant was quantified at the indicated time points by RT–qPCR targeting viral polymerase RdRp. Results are plotted as mean of triplicate infections with error bars representing the SD (biological replicates).
- C
Calu‐3 cells lacking MDA5 (MDA5 KO), RIG‐I (RIG‐I KO), or control KO cells (Ctrl) were seeded into 96well plates and infected with increasing amounts of SARS–CoV‐2 wt (WT) or Nsp16mut in triplicates (biological replicates). Type I IFN release was quantified after 48 h by incubating supernatants with HEK‐Blue IFN‐α/β reporter cells. SEAP activity in the supernatant of the reporter cells is shown as mean of quadruplicates with error bars representing SD.
- D
Calu‐3 cells (Ctrl) were seeded into 96 well plates and infected with 10 RNA copies/cell of SARS–CoV‐2 wt (WT) or Nsp16mut in the presence of increasing amounts of Remdesivir (RDV). Type I IFN release was quantified after 48 h by IFN bioassay on HEK‐Blue IFN‐α/β and is depicted as mean of quadruplicates with error bars representing SD. In parallel, infectivity of SARS–CoV‐2 wt and Nsp16 in the presence of increasing amounts of RDV was determined at the indicated time points by RT–qPCR targeting viral polymerase RdRp transcripts.
- E–G
Calu‐3 cells were mock infected or infected with SARS–CoV‐2 wt or Nsp16mut at 0.15 copies/cell. At 24 hpi, total RNA was extracted from lysed cells and expression of the indicated ISGs was quantified using RT–qPCR. ISG levels were normalized on GAPDH transcript expression. Results are plotted as mean of triplicate infections with error bars representing SD (biological replicates). One out of three independent experiments is shown (n = 3).
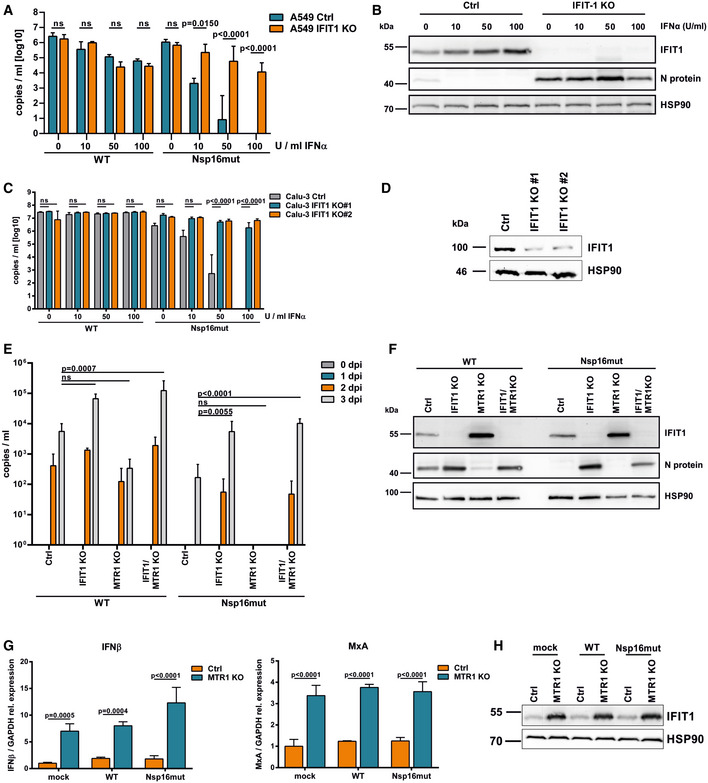
A549 luciferase KO (Ctrl) or IFIT1 KO cells were transduced with lentiviral particles encoding ACE2 followed by pretreatment with increasing amounts of type I IFN (IFNα2a) as indicated (10, 50, or 100 U/ml). At 24 h postinterferon treatment, cells were infected with SARS‐CoV‐2 wt or Nsp16mut at 0.025 RNA copies/cell. Virus release was quantified at 3 days postinfection by RT–qPCR targeting RdRp. Results are plotted as mean of triplicate infections with error bars representing the SD (biological repliactes). One out of three independent experiments is shown.
Three days after SARS–CoV‐2 Nsp16mut infection of A549 cells described in (A), expression of IFIT1 and viral nucleocapsid protein N was analyzed by immunoblot. Membranes were probed with antibodies targeting IFIT1, SARS–CoV‐2 N protein, and the housekeeping gene HSP90.
Calu‐3 control cells (Ctrl) or two different IFIT1 KO cell lines (IFIT1 KO #1, #2) were incubated with increasing amounts of type I IFN (10, 50, or 100 U/ml) 18 h prior to infection with SARS–CoV‐2 wt and Nsp16mut at 0.015 RNA copies/ml. Virus release was quantified at 3 dpi by RT–qPCR targeting RdRp. Results are plotted as mean of triplicate infections with error bars representing SD (biological replicates). One out of three independent experiments is shown.
IFIT1 expression levels in Calu‐3 Ctrl, IFIT1 KO #1 and #2 lines treated with type I IFN (24 h; 100 U/ml) were analyzed by immunoblot. Membranes were probed with antibodies targeting IFIT1 or the housekeeping gene HSP90.
A549 cells lacking IFIT1 (IFIT1 KO), the cellular methyltransferase MTR1 (MTR1 KO), both proteins (IFIT1/MTR1 KO), or control cells (Ctrl) were transduced with lentiviral particles encoding ACE2 and infected with SARS–CoV‐2 wt (WT) or Nsp16mut at 0.025 RNA copies/cell the next day. Virus release into the supernatant was quantified at the indicated time points by RT–qPCR. Results are plotted as mean of triplicate infections with error bars representing the SD. One out of three independent experiments is shown.
Three days postinfection, A549 cells described in (E) were analyzed by immunoblot. Membranes were probed with antibodies targeting IFIT1, SARS–CoV‐2 N protein, or the housekeeping gene HSP90.
A549 Ctrl and MTR1 KO cells were infected with SARS–CoV‐2 wt or Nsp16 mut virus at 0.015 RNA copies/cell or mock treated (triplicates, biological repeats). At 24 hpi, total RNA was extracted from lysed cells and expression of MxA and IFNβ transcripts was quantified using RT–qPCR. ISG levels were normalized on GAPDH transcripts. Data are plotted as mean of triplicate infections with error bars representing the SD.
IFIT1 expression was analyzed in mock treated, SARS–CoV‐2 wt (WT) or Nsp16mut infected cells at 48 hpi by immunoblot. Membranes were probed with antibodies targeting IFIT1 and the housekeeping gene HSP90.
References
-
- Bergant V, Yamada S, Grass V, Tsukamoto Y, Lavacca T, Krey K, Muhlhofer MT, Wittmann S, Ensser A, Herrmann A et al (2022) Attenuation of SARS‐CoV‐2 replication and associated inflammation by concomitant targeting of viral and host cap 2′‐O‐ribose methyltransferases. EMBO J 41: e111608 - PMC - PubMed
Publication types
MeSH terms
Substances
Associated data
- Actions
LinkOut - more resources
Full Text Sources
Medical
Research Materials
Miscellaneous
