

A high-resolution 3D atlas of the spectrum of tuberculous and COVID-19 lung lesions
- PMID: 36285507
- PMCID: PMC9641421
- DOI: 10.15252/emmm.202216283
A high-resolution 3D atlas of the spectrum of tuberculous and COVID-19 lung lesions
Abstract
Our current understanding of the spectrum of TB and COVID-19 lesions in the human lung is limited by a reliance on low-resolution imaging platforms that cannot provide accurate 3D representations of lesion types within the context of the whole lung. To characterize TB and COVID-19 lesions in 3D, we applied micro/nanocomputed tomography to surgically resected, postmortem, and paraffin-embedded human lung tissue. We define a spectrum of TB pathologies, including cavitary lesions, calcium deposits outside and inside necrotic granulomas and mycetomas, and vascular rearrangement. We identified an unusual spatial arrangement of vasculature within an entire COVID-19 lobe, and 3D segmentation of blood vessels revealed microangiopathy associated with hemorrhage. Notably, segmentation of pathological anomalies reveals hidden pathological structures that might otherwise be disregarded, demonstrating a powerful method to visualize pathologies in 3D in TB lung tissue and whole COVID-19 lobes. These findings provide unexpected new insight into the spatial organization of the spectrum of TB and COVID-19 lesions within the framework of the entire lung.
Keywords: COVID-19; calcification; granuloma; thrombosis; tuberculosis.
© 2022 The Authors. Published under the terms of the CC BY 4.0 license.
Figures
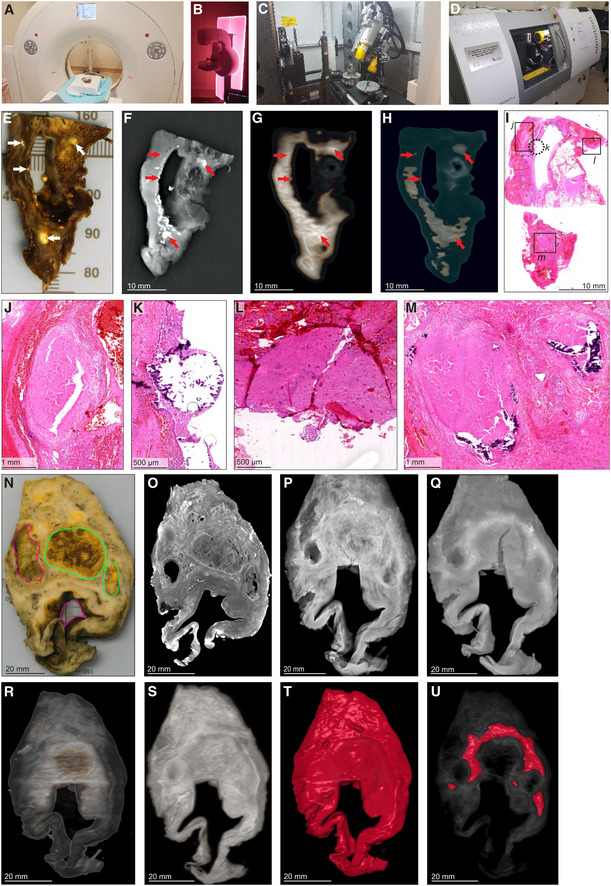
- A
HRCT scanner: Siemens Somatom Perspective (64‐slice). - B
Mammography
STX scanner: Siemens Mammomat Inspiration System. - C
μCT scanner: General Electric Phoenix V|tome|x L240. -
D nCT scanner: General Electric Phoenix Nanotom S. -
E–M Imaging of Sample A exhibiting caseous necrosis and cavitation without contrast staining. (E) Macro‐image. Necrotic and calcified legions are indicated by white arrows. (F)
STX scan. Brighter regions correspond, in part, with regions of caseous necrosis that can be observed on the surface. Necrotic and calcified legions are indicated by red arrows. (G, H) Post‐processedHRCT scans. Volumes of higher density can also be detected beneath the sample surface, and certain visualization presets within theHRCT software designed to aid clinical diagnosis can aid visualization ofTB pathology. These visualizations, (G) the “Onco‐thorax” preset, and (H) the “Onco‐liver” preset, correspond, in part, with surface lesions and presumably with other denser tissue below the sample surface. Necrotic and calcified legions are indicated by the red arrows. (I) H&E histology of (E) (composite of two standard slides). (J–M ) Close‐ups of boxed lesions in (I) corresponding to regions of high‐density visible inHRCT andSTX . Calcification is indicated by dark‐blue/purple lakes in (K) and (M). -
N–U Imaging of a sample B exhibiting cavitation, mycetoma, and caseous lesions from a sample with iodine contrast staining (Lugol's solution). The missing portion in panels
P–U was excised for histology prior to scanning with clinicalCT . (N) Gross image, with cavitation (purple) and mycetomas (green). (O)μCT slice of (N) at 60.0 μm voxel size. (P, Q)STX scan, before and after destaining, respectively. A small section (also observed inR–T ) was removed from the cavity wall for histopathology. (R, S)HRCT with “Onco‐thorax” preset post‐processing before and after destaining, respectively. (T, U)HRCT with “Bone‐metal” preset post‐processing before and after destaining, respectively.
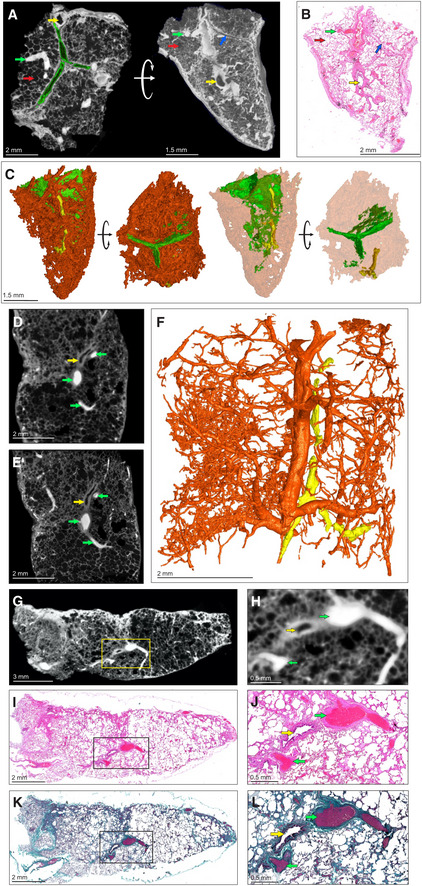
- A–C
μCT and histological analysis of healthy lung, which was resected adjacent to cancerous lung, with iodine contrast staining (Sample C). (A) μCT image at 4.5 μm voxel size (top and side view), revealing inter/intralobular septa (green outline, blue arrow), alveoli (red arrows), airways (yellow arrows), and blood (green arrows). The side‐view and surface (right image) were generated using ‘ScatterHQ’ rendering in MyVGL. (B) H&E histology of region depicted in (A), side view. Septa (blue arrow), alveoli (red arrow), airways (yellow arrow), and blood (green arrow). (C) 3D segmentation of blood (red), septa (green, partial segmentation), and bronchi (yellow).
- D
μCT image at 20.0 μm voxel size (Sample D). Blood vessels (green arrows) and a bronchiole (yellow arrow).
- E
nCT image at 4.1 μm voxel size. Blood vessels (green arrows) and a bronchiole (yellow arrow).
- F
3D segmentation of (E) revealing vascular network (red) and airways (yellow). See also Appendix Fig S1.
- G
μCT image of Sample D at 16.0 μm voxel size.
- H
Magnified view of blood vessels (green arrows) and a bronchiole (yellow arrow) from the boxed area in (G).
- I
Low power magnification of the H&E stain near to (G).
- J
High power magnification of the H&E stain showing blood vessels (green arrows) and a bronchiole (yellow arrow) from the boxed area in (I).
- K
Low power magnification of Masson's Trichrome (MT) stain.
- L
High power magnification of MT stain showing blood vessels (green arrow) and a bronchiole (yellow arrow) from the boxed area in (K). MT stain produces red keratin and muscle fibers, blue/green collagen, red/pink cytoplasm, and brown/black nuclei.
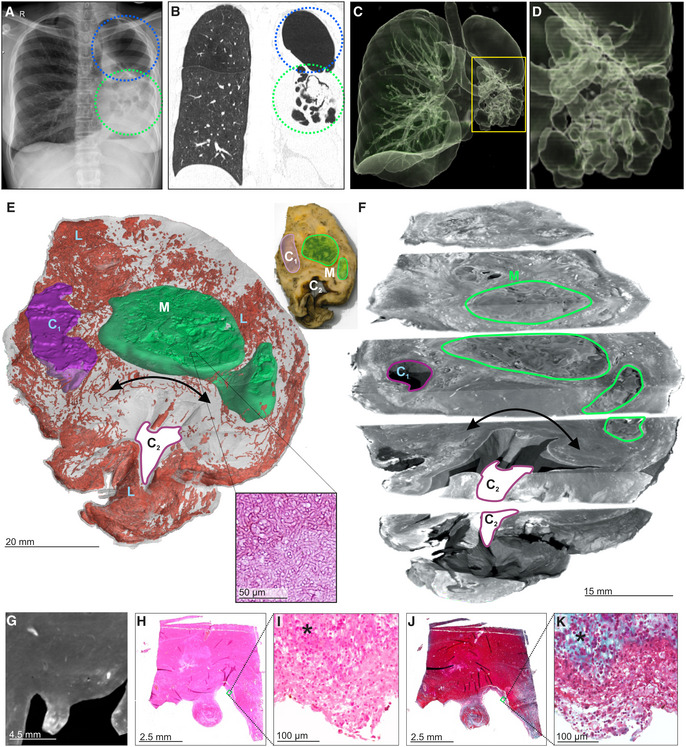
- A
Chest X‐ray of a TB patient exhibiting cavitation (blue circle) and mycetomas (green circle) in the left lung.
- B
HRCT slice of same lung as (A) with cavitation (blue circle) and mycetoma (green circle).
- C, D
3D reconstruction of HRCT from (B). (D) Magnified image of mycetoma.
- E
3D segmentation of blood (red, 1279.12 mm3), mycetoma (green, 3,709.62 mm3, H&E histological confirmation of hyphae in boxed area), and partial cavity (purple, 673.13 mm3), total sample volume: 26,739.92 mm3. Top‐right: macro‐photo indicating the cavities (purple, “Cn”) and mycetoma (green, “M”). Wall thickening around the cavity corresponds with a lack of vasculature (black double arrow). Hemorrhage is visible in the form of blood lakes (“L”).
- F
ScatterHQ (MyVGL) rendering of internal structure at ± 2 cm intervals and 5 mm below the top surface. The mycetoma is outlined in green (“M”) and the upper cavity (“C1”). The lower cavity (C2) wall is indicated by the black double arrow. See also Movie EV2.
- G
μCT close‐up of cavity wall with strongly staining ridge.
- H–K
H&E (H, I) and MT (J, K) histology of cavity wall with ridge reveals muscle (*) at medium and high magnification.
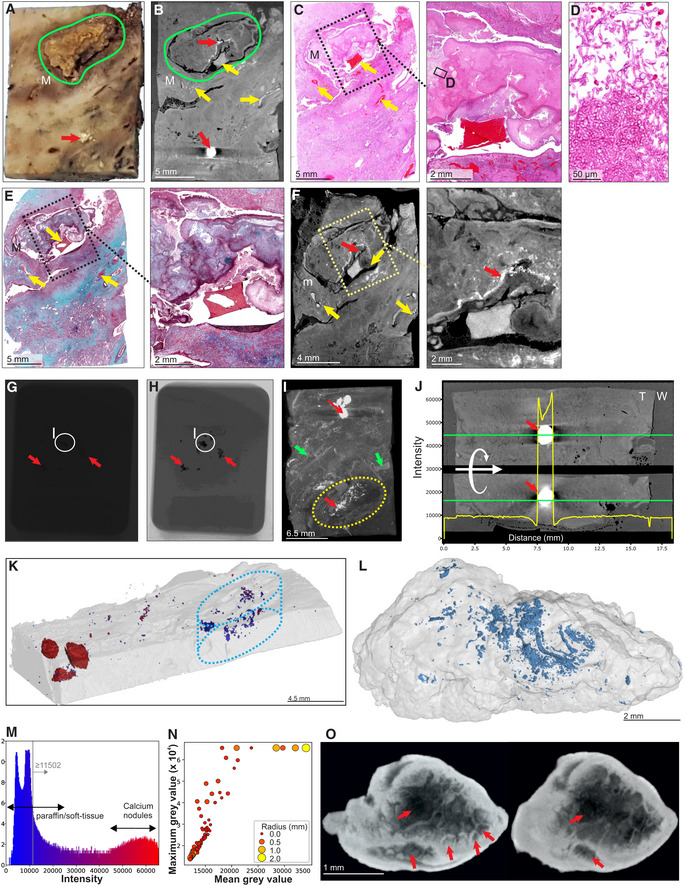
Macrophotograph of Sample H, exhibiting calcification (red arrow) and a mycetoma (green outline, “M”).
μCT slice of (A) at 26.8 μm voxel size. Determination of internal structure is limited compared to contrast staining with iodine. Nonetheless, calcification (red arrows) and to a lesser extent vasculature (yellow arrows) can be visualized.
H&E histology of (A) with medium power image of the mycetoma. Yellow arrows indicate blood vessels.
High power histology image of boxed area from (C) confirms the presence of hyphae in the mycetoma.
MT histology of (A) with close‐up of the mycetoma cavity. Yellow arrows indicate blood vessels.
μCT of after paraffin removal (12.0 μm voxel size) and excluding calcified regions results in improved internal contrast with close‐up of the mycetoma cavity. Yellow arrows: blood vessels, red arrow calcification.
Example of a single raw image of μCT scan with some calcifications indicated (red arrows; Sample I).
Edited version of (G); use of Corel PhotoPaint reveals calcium deposits (dark spots, red arrows).
Maximum Intensity Projection of reconstructed volume of Sample H, revealing calcification (red arrows), blood vessels (green arrows), and mycetoma (yellow circle).
Typical opacity profile (yellow graph) measured along the green axis in unstained paraffin block across a calcium deposit. Paraffin wax; “W”, tissue; “T”; calcium; red arrow. The similar intensity of paraffin and soft tissue hindered differentiation within the tissue compared to scanning after paraffin removal. Calcium deposits are easy to distinguish; however, they do give rise to artifacts around the crystal (red arrow).
Segmentation of high‐density regions in (I) (Sample H). Regions of interest are above the intensity threshold of 11,502 (grey line, see panel M) and are colored according to their maximum intensity within each region of interest (ROI).
Segmentation of high‐density volumes (likely lower density calcification) within the mycetoma (dotted oval regions: I, K) in Sample H shown in Fig 4K and Appendix Fig S5A. See also Movie EV3.
X‐ray intensity histogram for μCT of Fig 4K. The grey line approximately represents the threshold separating paraffin from soft tissue. The right bulge (red) corresponds to calcification, while the intermediate region corresponds to lower levels of calcification within soft tissue.
μCT can be used to quantify calcification in TB‐infected tissue: Mean vs Max grey values of ROI from (K) with volume > 30 voxels. Circle size and color corresponds to ROI radius of gyration. High intensities were clamped (leveling of max values at 65,535) in order to improve contrast within soft tissue regions.
nCT slices (8.0 μm voxel size) of a calcium nodule reveals internal heterogeneity and lacunae (red arrows). See also Movie EV3.
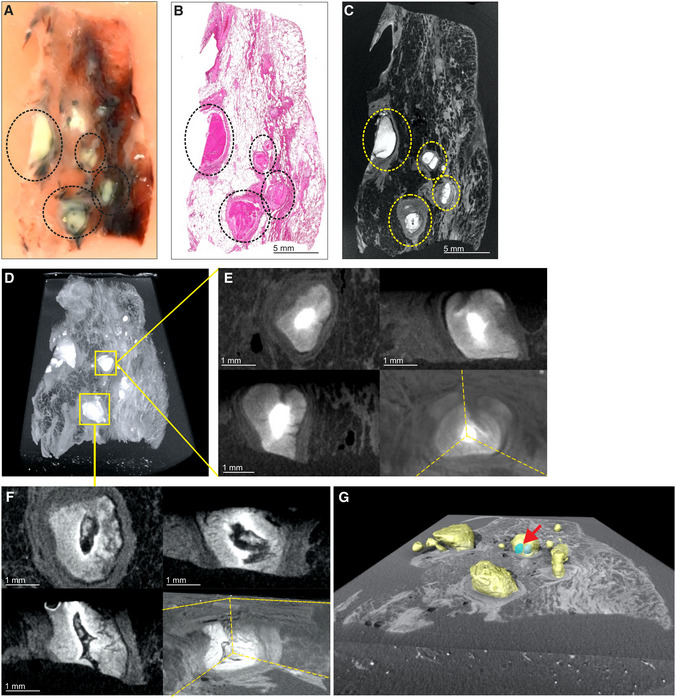
Image of necrotic
TB lesions in aFFPE block. Dotted line circles: areas containing necrotic lesions.H&E section of (A). Dotted line circles: areas containing necrotic lesions.
μCT section of (A). Dotted line circles: areas containing necrotic lesions.Maximum intensity projection of
μCT volume.High power images of necrotic lesion with embedded calcification. Notice the gradient of electron density.
High power image of a necrotic lesion with airway remnants.
3D segmentation of necrotic lesion (yellow), calcification (blue, red arrow) embedded in a clipped view of X‐ray attenuation.
- A
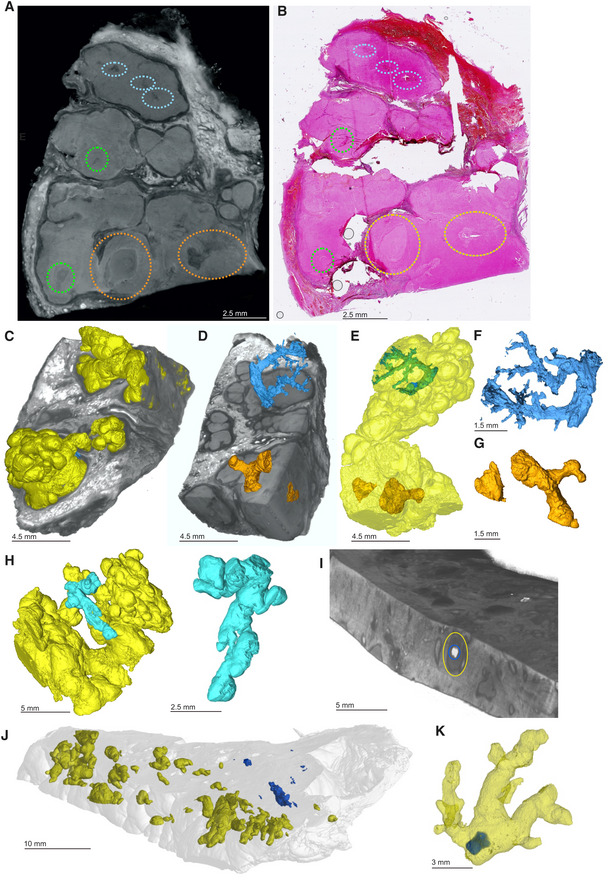
μCT slice of human TB lung specimen exhibiting caseous necrotic granulomas. Regions circled in blue, orange, and green contain pathological anomalies not readily identifiable in the corresponding histological analysis (B) but are amenable to manual segmentation (C–G). Not all abnormalities were segmented (e.g., green circles). Further adjacent slices are displayed in Appendix Fig S7.
- B
H&E histology of (A) with regions containing anomalies circled as in (A).
- C–G
Segmentation of unidentified branched structure in the dotted blue and orange circled regions from (A). (C) Rendered granulomas (yellow volumes) in relation to clipped electron density rendering. (D) Branched volumes in relation to clipped electron density rendering of necrotic granulomas. (E) Branched volumes in relation to rendered lesion surfaces (yellow). (F, G) Isolated rendering of branched volume in blue ovals and orange‐circle regions from (A), which corresponds to obliterated airways.
- H
Alternate views of independent granulomas (yellow, cyan) to demonstrate the spatial arrangement and complexity of granuloma morphology.
- I
Overlay of scans with and without iodine contrast staining demonstrating the presence of a calcium crystal (blue) within a necrotic lesion (circled in yellow).
- J
3D rendering overlay of necrotic lesions (yellow) and calcium crystals (blue) across entire sample.
- K
3D rendering of calcium crystal (blue) within a necrotic lesion (yellow).
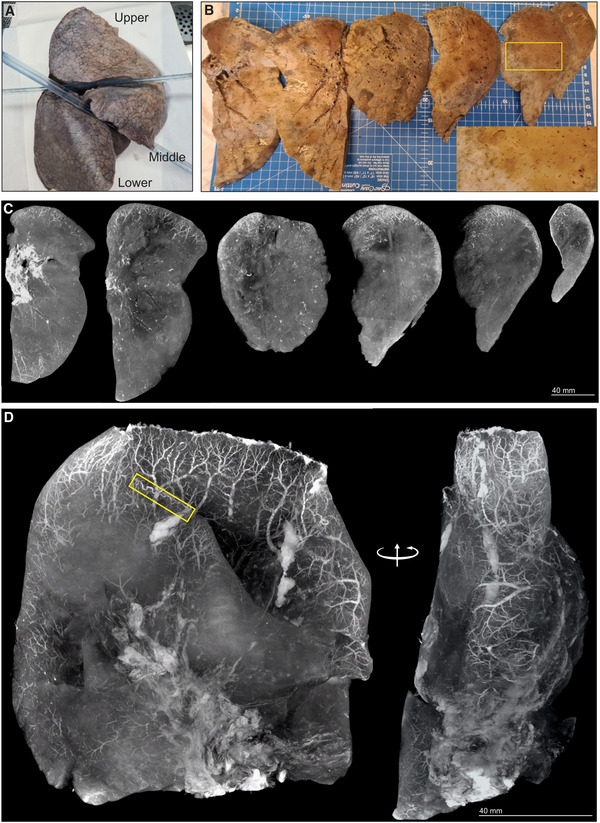
Gross image of formalin‐fixed right lung. The upper and lower lobes were selected for μCT.
Macrophotographs of lower lobe sections with medium power magnification (yellow box inset).
Maximum intensity projections of separate μCT scans for sections from (B).
Maximum intensity projection of lower lobe from (A). A tortuous blood vessel (yellow box) is indicated.
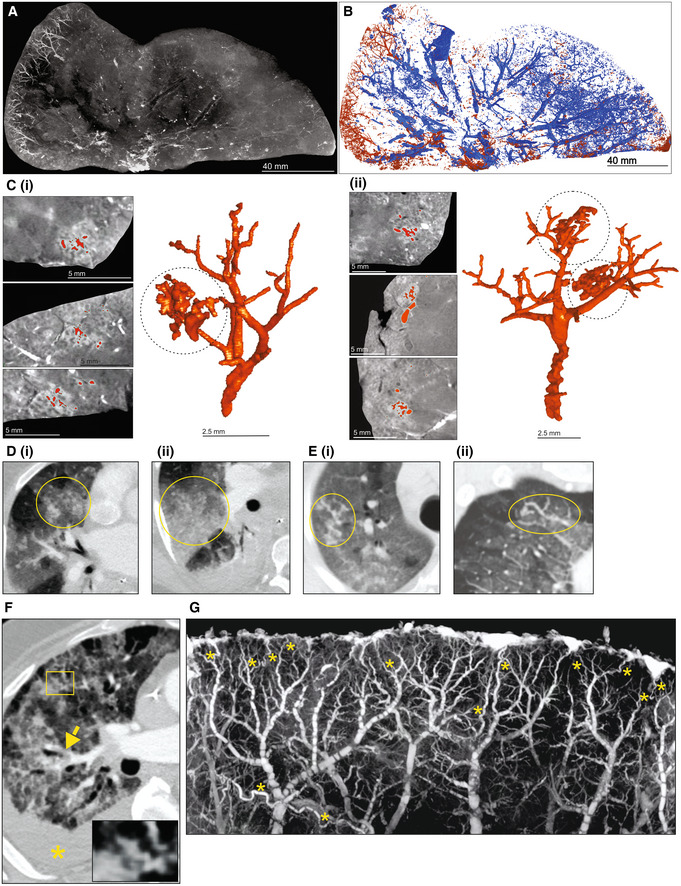
- A
μCT imaging of vascularization in a 1 cm‐thick slice of right upper lobe of a COVID‐19 lung.
- B
Segmentation of blood (red) from and airways (blue) from (A).
- C
Segmentation of blood and blood‐pooling in tissue shown in (A) (red); (i), (ii). Two separate of examples of pooling. Left: μCT from three orthogonal views. Right: 3D segmentation.
- D–F
Chest CTA shows (D) vascular tree‐in‐bud (yellow oval) appearance, (E) non‐dichotomous branching (yellow oval) and (F) tortuous dilated blood vessel (yellow rectangle), pulmonary thromboembolism in small sub‐segmental pulmonary arteries (yellow arrow), and ground glass opacities due to COVID‐19 pneumonia and dependent pleural effusion (yellow asterisk).
- G
High‐power μCT image of a segment from Fig 7D revealing tortuous blood vessels (yellow asterisks).
References
-
- Aronson JD, Whitney CE (1930) The types of tubercle Bacilli found in tuberculous lesions and in nontuberculous tissue in man. J Infect Dis 47: 30–55
Publication types
MeSH terms
Grants and funding
LinkOut - more resources
Full Text Sources
Medical
