. 2022 Nov 11;131(11):909-925.
doi: 10.1161/CIRCRESAHA.122.321129. Epub 2022 Oct 26.

Neuroinflammation Plays a Critical Role in Cerebral Cavernous Malformation Disease

Affiliations

Neuroinflammation Plays a Critical Role in Cerebral Cavernous Malformation Disease

Catherine Chinhchu Lai et al. Circ Res. .

Abstract

Background: Cerebral cavernous malformations (CCMs) are neurovascular lesions caused by loss of function mutations in 1 of 3 genes, including KRIT1 (CCM1), CCM2, and PDCD10 (CCM3). CCMs affect ≈1 out of 200 children and adults, and no pharmacologic therapy is available. CCM lesion count, size, and aggressiveness vary widely among patients of similar ages with the same mutation or even within members of the same family. However, what determines the transition from quiescent lesions into mature and active (aggressive) CCM lesions is unknown.

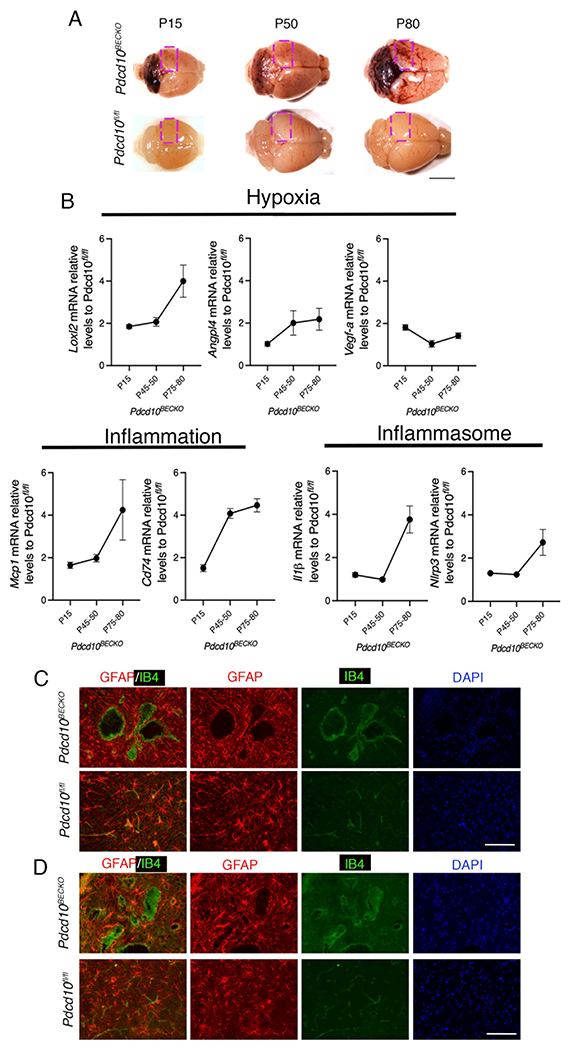
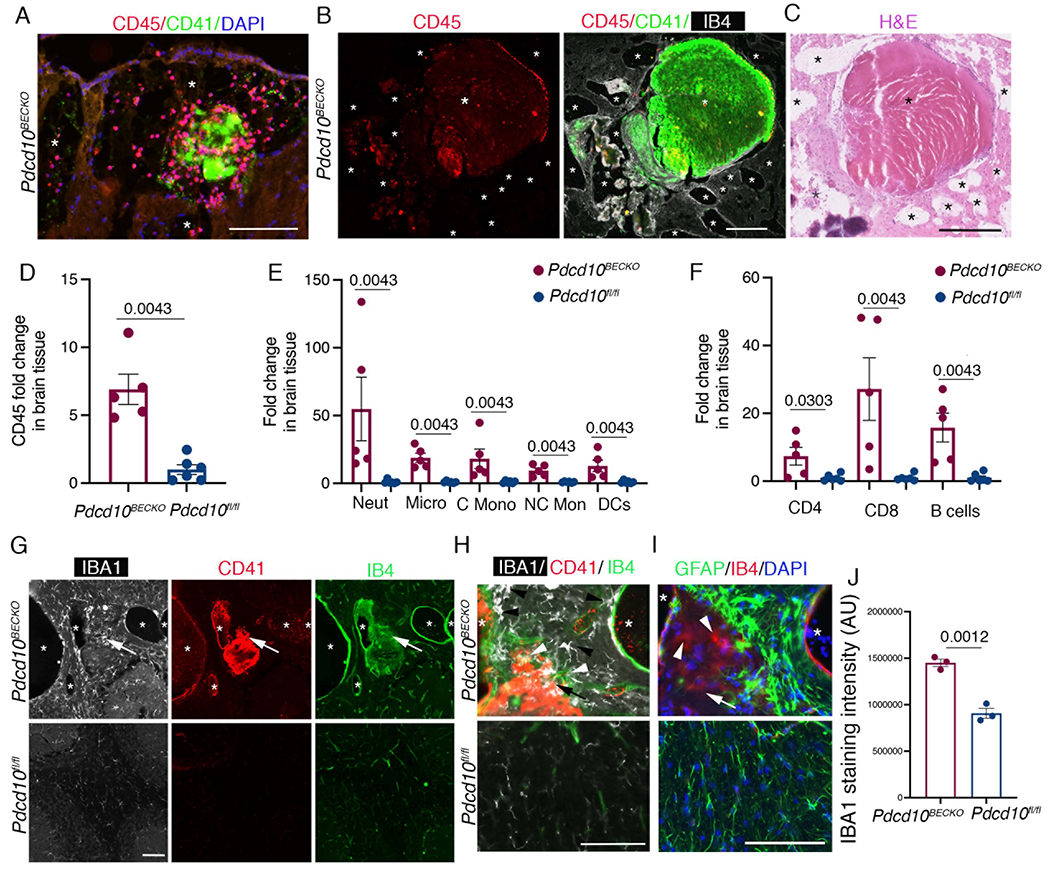
Methods: We use genetic, RNA-sequencing, histology, flow cytometry, and imaging techniques to report the interaction between CCM endothelium, astrocytes, leukocytes, microglia/macrophages, neutrophils (CCM endothelium, astrocytes, leukocytes, microglia/macrophages, neutrophils interaction) during the pathogenesis of CCMs in the brain tissue.

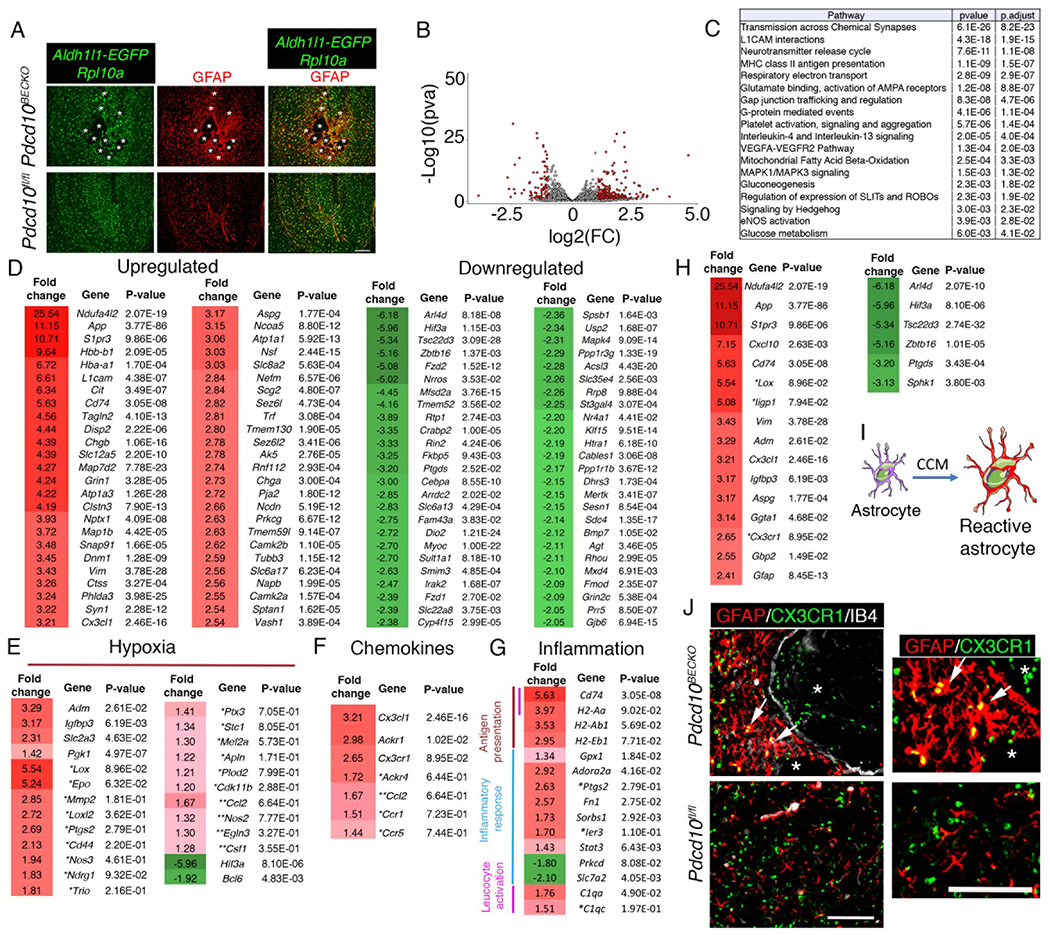
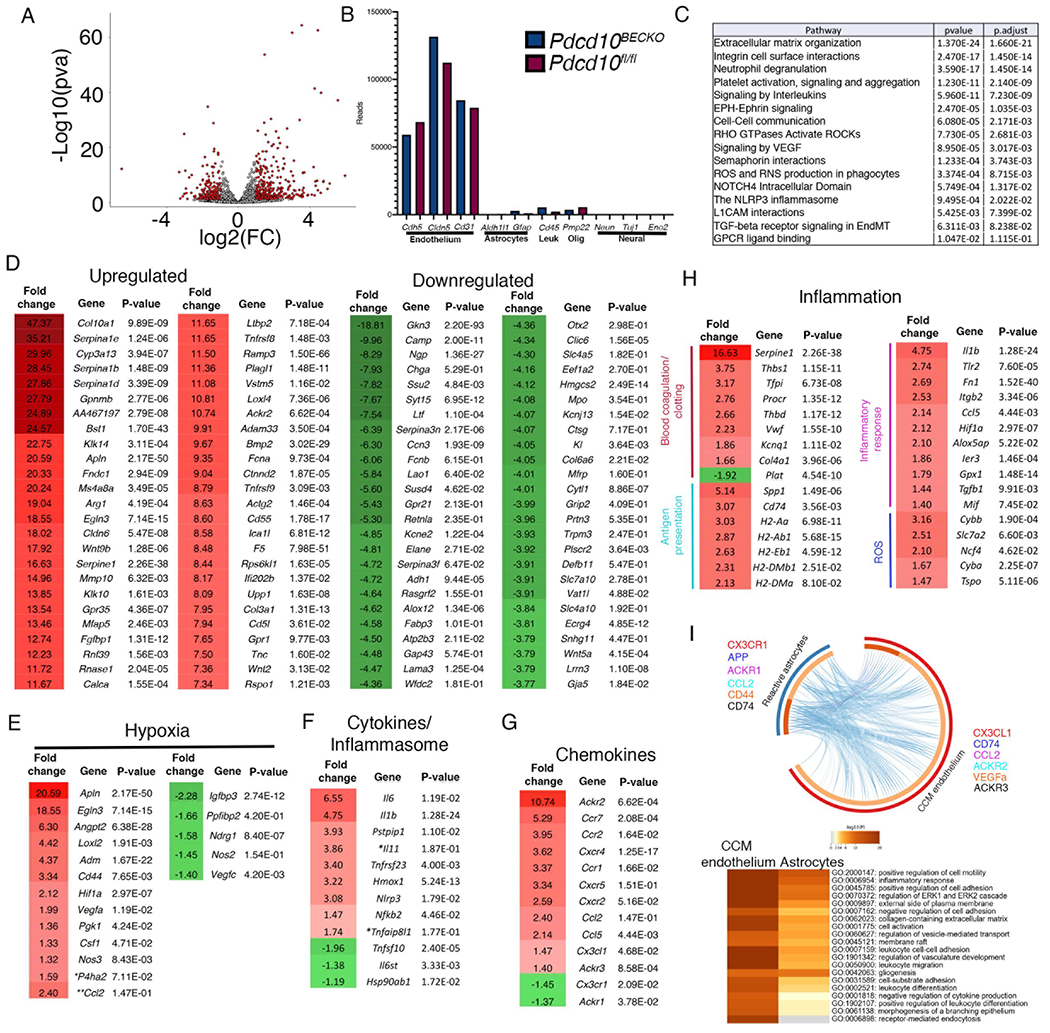
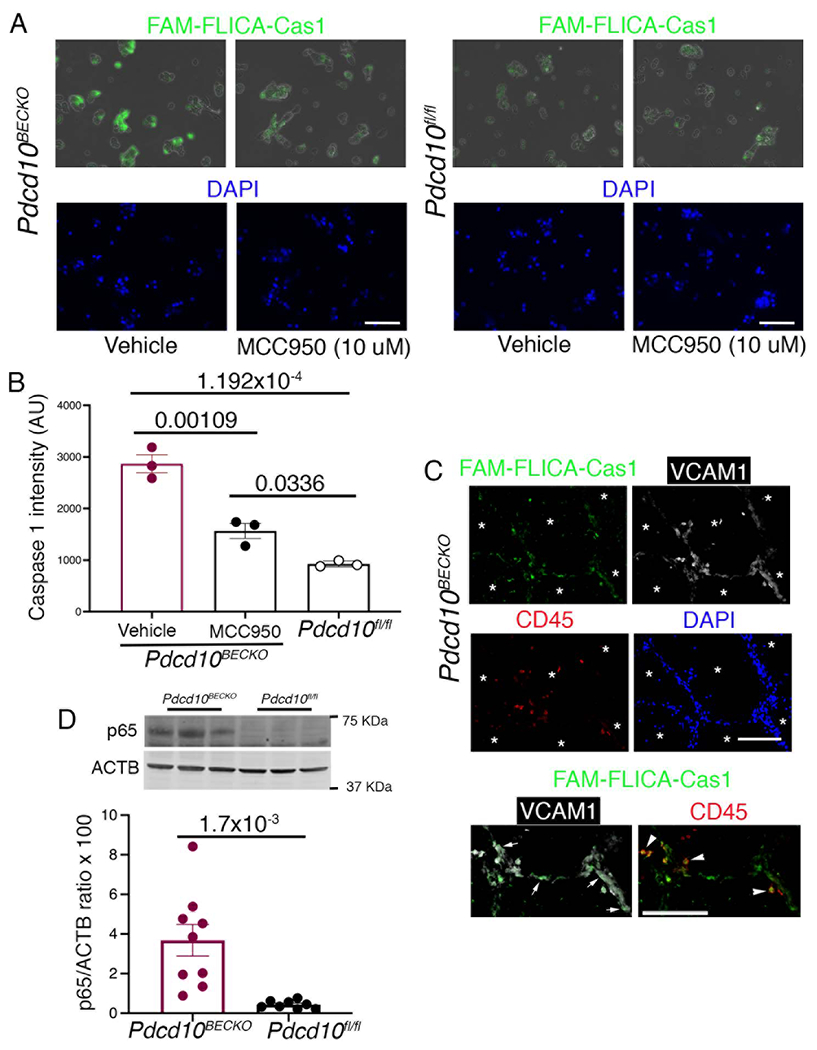
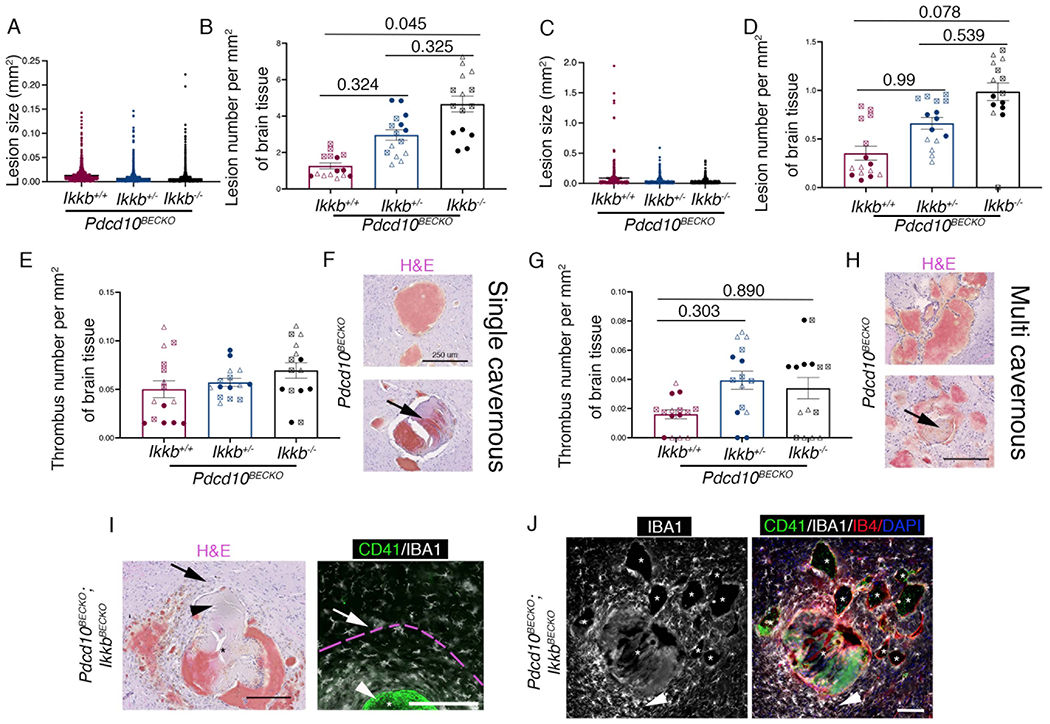
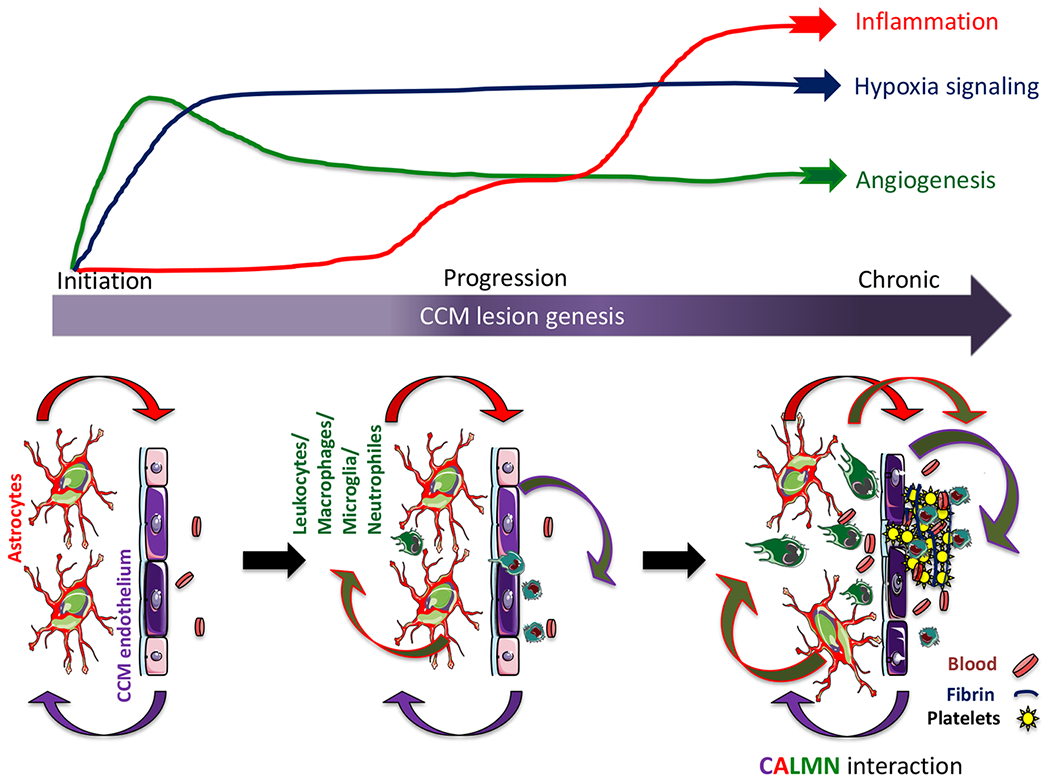
Results: Expression profile of astrocytes in adult mouse brains using translated mRNAs obtained from the purification of EGFP (enhanced green fluorescent protein)-tagged ribosomes (Aldh1l1-EGFP/Rpl10a) in the presence or absence of CCM lesions (Slco1c1-iCreERT2;Pdcd10fl/fl; Pdcd10BECKO) identifies a novel gene signature for neuroinflammatory astrocytes. CCM-induced reactive astrocytes have a neuroinflammatory capacity by expressing genes involved in angiogenesis, chemotaxis, hypoxia signaling, and inflammation. RNA-sequencing analysis on RNA isolated from brain endothelial cells in chronic Pdcd10BECKO mice (CCM endothelium), identified crucial genes involved in recruiting inflammatory cells and thrombus formation through chemotaxis and coagulation pathways. In addition, CCM endothelium was associated with increased expression of Nlrp3 and Il1b. Pharmacological inhibition of NLRP3 (NOD [nucleotide-binding oligomerization domain]-' LRR [leucine-rich repeat]- and pyrin domain-containing protein 3) significantly decreased inflammasome activity as assessed by quantification of a fluorescent indicator of caspase-1 activity (FAM-FLICA [carboxyfluorescein-fluorochrome-labeled inhibitors of caspases] caspase-1) in brain endothelial cells from Pdcd10BECKO in chronic stage. Importantly, our results support the hypothesis of the crosstalk between astrocytes and CCM endothelium that can trigger recruitment of inflammatory cells arising from brain parenchyma (microglia) and the peripheral immune system (leukocytes) into mature active CCM lesions that propagate lesion growth, immunothrombosis, and bleedings. Unexpectedly, partial or total loss of brain endothelial NF-κB (nuclear factor κB) activity (using Ikkbfl/fl mice) in chronic Pdcd10BECKO mice does not prevent lesion genesis or neuroinflammation. Instead, this resulted in a trend increase in the number of lesions and immunothrombosis, suggesting that therapeutic approaches designed to target inflammation through endothelial NF-κB inhibition may contribute to detrimental side effects.

Conclusions: Our study reveals previously unknown links between neuroinflammatory astrocytes and inflamed CCM endothelium as contributors that trigger leukocyte recruitment and precipitate immunothrombosis in CCM lesions. However, therapeutic approaches targeting brain endothelial NF-κB activity may contribute to detrimental side effects.

Keywords: astrocytes; caspases; cerebral cavernous malformations; endothelial cells; inflammasomes; inflammation; macrophages.


Conflict of interest statement

Conflict of interest statement: The authors have declared that no conflict of interest exists

Disclosure

There are no conflicts of interest related to this work.

Figures

Figure 1.
Figure 1.. Increase of hypoxia and neuroinflammation signaling pathways in CCM disease.
A, CCM lesions are present in the cerebellum and cerebrum of Pdcd10BECKO mice at acute (P15), progression (P50), and chronic stage (P80). A square shows the region used in B for RNA analysis. Scale bar, 5 mm. B, Analysis of Loxl2, Angpl4, Vegfa, Mcp1, Cd74, Il1β, and Nlrp3 mRNA levels by RT-qPCR at acute, progression, and chronic stage as indicated. Data are mean ±SEM, Pdcd10BECKO mice, n=3; Pdcd10fl/fl mice, n=6. C, Immunofluorescence staining of GFAP+ astrocytes (red), and endothelial marker isolectin B4 (IB4; green) of cerebral sections from P15 Pdcd10BECKO and littermate control Pdcd10flfl. DAPI staining (blue) was used to reveal nuclei. n = 4 mice in each group. Scale bar, 100 μm. D, Immunofluorescence staining of GFAP+ astrocytes (red), and endothelial marker isolectin B4 (IB4; green) of cerebral sections from P80 Pdcd10BECKO and littermate control Pdcd10flfl. DAPI staining (blue) was used to reveal nuclei. n = 5 mice in each group. Scale bar, 100 μm.
Figure 2.
Figure 2.. Neuroinflammatory astrocytes in CCM disease.
A, Immunofluorescence analysis show colocalization of GFAP+ astrocytes with cells expressing EGFP-RpL10a in Pdcd10fl/fl;Aldh1l1-EGFP/Rpl10a brains sections. Asterisks denote the vascular lumen of CCM lesions. Scale bar is 200 μm. n = 3 mice in each group. B, Volcano plot of differentially expressed transcripts in P75 Pdcd10BECKO;Aldh1l1-EGFP/Rpl10a versus littermate control Pdcd10fl/fl;Aldh1l1-EGFP/Rpl10a. Transcripts are represented on a log2 scale. The significantly down- and up-regulated genes are labeled in red. n = 3 mice in each group. C, Top pathway enrichment analysis for Pdcd10BECKO;Aldh1l1-EGFP/Rpl10a brain tissue. Pdcd10fl/fl;Aldh1l1-EGFP/Rpl10a littermates were used as controls. (320 DEG, fold change ≥ 1.2 and FDR < 0.03). D, List of the top 50 up- or down-regulated genes from translated mRNAs obtained from ribosomes in astrocytes from Pdcd10BECKO;Aldh1l1-EGFP/Rpl10a brains. Fold change and P values are shown for each gene. E, Analysis of hypoxia-regulated genes. F, Analysis of chemokine transcripts. G, Analysis of inflammation-related transcripts. H, Transcriptional signature of CCM reactive astrocytes. I, CCM endothelium instructs the astrocytes to acquire a reactive astrocyte phenotype. J, CCM reactive astrocytes are positive to CX3CR1 staining. Fold change and P values are shown for each gene. n = 3 mice in each group. * and ** indicate genes that do not reach statistical significance because one of the biological replicates the fold change was too large but in the same direction (*) or when one of the biological replicates does not change (**).
Figure 3.
Figure 3.. Inflammation and inflammasome pathways are increased in the CCM endothelium.
A, Volcano plot of differentially expressed transcripts in fresh isolated brain endothelial cells from P75 Pdcd10BECKO;Aldh1l1-EGFP/Rpl10a versus isolated brain endothelial cells from littermate control Pdcd10fl/fl;Aldh1l1-EGFP/Rpl10a. Transcripts are represented on a log2 scale. The significantly down- and up-regulated genes are labeled in red. Pdcd10BECKO mice, n=4; Pdcd10fl/fl mice, n=3 mice in each group. B, Analysis of known brain cell-specific gene markers. C, Top pathway enrichment analysis. D, List of the top 50 up- or down-regulated genes. Fold change and P values are shown for each gene. E, Analysis of hypoxia-regulated genes. F, Analysis of cytokines and inflammasome transcripts. G, Analysis of chemokine transcripts. H, Analysis of inflammation-related transcripts. I, Ligand-receptor analysis in reactive astrocytes (blue semicircle) and CCM endothelium (red semicircle) from Pdcd10BECKO RNAseq. Upregulated membrane bound and soluble proteins were used for analysis. Heatmap of statistical enrichment terms in I. Dark orange color represent the genes that are share by CCM endothelium and reactive astrocytes (e.g., CD74). Lines link ligand-receptor between cell types and examples are presented color coded (e.g., CX3CR1-CX3CL1). Fold change and P values are shown for each gene. Pdcd10BECKO; Aldh1l1-EGFP/Rpl10a mice, n=4; Pdcd10fl/fl; Aldh1l1-EGFP/Rpl10a mice, n=4 mice in each group.
Figure 4.
Figure 4.. Increase in inflammasome activity in CCM endothelium.
A, Visualization of inflammasome activation in P80 Pdcd10BECKO isolated brain endothelial cells in the presence or absence of MCC950 (10 μM, 1 h at 37 C). Pdcd10fl/fl isolated brain endothelial cells were used as controls in the presence or absence of MCC950. FAM-FLICA Caspase-1 assay kit was used to visualize caspase-1 signal as an indicator of inflammasome activity. Scale bars, 50 μm. B, Quantification of FAM-FLICA Caspase-1 intensity from a in Pdcd10BECKO compared to Pdcd10fl/fl or Pdcd10BECKO isolated cells exposed to MCC950. Data are mean ±SEM, n = 3 mice in each group (One-Way ANOVA followed by the Tukey post hoc test). C, FAM-FLICA fluorescence analysis (green) in multi-cavernous CCM lesions in combination with immunofluorescence for VCAM-1 (white) and CD45 (red), and DAPI labelling nuclei (blue). Asterisks denote vascular lumen of lesions. FAM-FLICA Caspase-1 signal is observed in both VCAM-1 (endothelium) and CD45 (leukocytes) positive cells as marked by white arrows and arrowheads, respectively. Scale bars, 100 μm. D, Quantification of phospho p65 protein in P80 Pdcd10BECKO brains compared to Pdcd10fl/fl brain controls by western blot. Data are mean ±SEM Pdcd10BECKO mice, n=9; Pdcd10fl/fl mice, n=8 (2-tailed unpaired t test).
Figure 5.
Figure 5.. Increased presence of immune cells in CCM brain tissue.
A, Immunofluorescence analysis shows leukocyte recruitment CD45+ (red) and early platelet aggregation by CD41+ (green) in the vascular lumen of lesions in P75 Pdcd10BECKO brains. Nuclei are labelled by DAPI (blue). Asterisks denote vascular lumen of CCM lesions. Scale bar, 100 μm. B, Large mature vascular thrombosis associated with CD45+ leukocyte infiltration in P75 Pdcd10BECKO brains. Scale bar, 200 μm. C, Hematoxylin and eosin staining of a serial section in b. Scale bar, 250 μm. Asterisks denote vascular lumen of CCM lesions. D, Flow cytometry of CD45+ cells isolated from P80 Pdcd10BECKO brains compared to Pdcd10fl/fl brain controls. Data are mean ±SEM, Pdcd10BECKO mice, n=5; Pdcd10fl/fl mice, n=6 (2-tailed Mann-Whitey test). E, Flow cytometry of myeloid cells. Data are mean ±SEM, Pdcd10BECKO mice, n=5; Pdcd10fl/fl mice, n=6 (2-tailed Mann-Whitey test). No multiple testing was performed. F, Flow cytometry of lymphoid cells. Data are mean ±SEM, Pdcd10BECKO mice, n=5; Pdcd10fl/fl mice, n=6 (2-tailed Mann-Whitey test). No multiple testing were performed. G, Immunofluorescence analysis for microglia IBA1+ (white), platelets CD41+ (red) cells and labeling of the brain vasculature, using isolectin B4 (green). Asterisks denote vascular lumen of CCM lesions. Scale bar, 100 μm. Arrows indicate region at high magnification observed in h. H, Increase of IBA1+ microglial cells (black arrowheads) and infiltrated IBA1+IB4+ leukocytes (white arrow heads) can be observed near thrombus (CD41+, red) of Pdcd10BECKO brains. I, Immunofluorescence analysis for GFAP (green), and IB4 (red) from a serial section in g and h, Nuclei are labelled by DAPI (blue). GFAP+ astrocytes enclosed IB4+ cells (white arrowheads) present in the thrombus in h. Asterisks denote vascular lumen of CCM lesions. J, microglia IBA1+ staining quantification. Scale bar, 100 μm. Data are mean ±SEM, n = 3 mice in each group (2-tailed student’s t test).
Figure 6.
Figure 6.. Loss of brain endothelial IKKb increases lesion number and thrombosis during CCM disease.
A, Analysis and quantification of stage 1 (single cavernous) lesion size in Pdcd10BECKO;Ikkbwt/wt (Pdcd10BECKO;Ikkb+/+) , Pdcd10BECKO;IkkbBECKO/wt (Pdcd10BECKO;Ikkb+/−) and Pdcd10BECKO;IkkbBECKO (Pdcd10BECKO;Ikkb−/−) brains. B, Analysis and quantification of the number of stage 1 lesions per mm2. C, Analysis and quantification of stage 2 (multi-cavernous). D, Analysis and quantification of the number of stage 2 lesions per mm2. Animals were injected at P5 with 4-hydroxi-tamoxifen to differentially assess lesion burden. E, Analysis and quantification of the number of thrombi in stage 1 lesions per mm2. F, Hematoxylin and eosin staining of stage 1 lesions in P80 Pdcd10BECKO mice. Arrow indicates thrombus present in stage 1 lesion. G, Analysis and quantification of the number of thrombi in stage 2 lesions per mm2. H, Hematoxylin and eosin staining of stage 2 lesions in P80 Pdcd10BECKO mice. The arrow indicates thrombus present in stage 2 lesion. I, Hematoxylin and eosin staining show a multifaceted CCM lesion in Pdcd10BECKO;IkkbBECKO brains, a serial section was used for immunofluorescence analysis for CD41 (green) and IBA1 (white). Arrows indicate similar regions. Increase in IBA1+ microglial cells with hypertrophied and ameboid in morphology are observed to form a ring near the thrombus. Pink broken line indicates area of microglia activation. Arrowheads indicate thrombus. Scale bar, 200 μm. J, Immunofluorescence analysis of CD41+ (green), IBA1+ (white) and labeling of the brain vasculature, using isolectin B4 (red), of cerebral sections from P80 Pdcd10BECKO;IkkbBECKO. Exacerbated increased of IBA1+ microglial cells near a lesion with thrombosis (arrowhead). Lesions with not thrombosis show a moderate recruitment of microglial cells. Nuclei are labelled by DAPI (blue). Asterisks denote vascular lumen of CCM lesions. Animals were injected at P1 with 4-hydroxi-tamoxifen. Scale bar, 100 μm. Statistical analysis is based on the average of 5 sections per animal. Data regarding lesion number per area and thrombosis from each individual section is represented by three (B, D, E, G) different symbol shapes in the graphs, each set of shapes represents one animal (per group: filled circle, animal 1; triangle, animal 2; square, animal 3). All data are mean ±SEM, n=3 (Kruskal-Wallis post hoc Dunn’s test).
Figure 7.
Figure 7.. CALMN interaction plays a critical role in the pathogenesis of CCM disease.
The illustration shows that angiogenesis and hypoxia signaling are essential in CCM lesion formation (initiation), while the inflammation pathway initiates in the progression phase and may contribute to mature active CCM lesions, lesion growth, immunothrombosis, and bleedings. Our model proposes that CCM endothelium and astrocytes synergize to recruit inflammatory cells to CCM lesions. Moreover, a reciprocal interaction between CCM endothelium, astrocytes, leukocyte, and macrophage/microglia, neutrophils, that we termed CALMN interaction, is critical for the transition of lesions into aggravating active lesions.

References

    1. Snellings DA, Hong CC, Ren AA, Lopez-Ramirez MA, Girard R, Srinath A, Marchuk DA, Ginsberg MH, Awad IA and Kahn ML. Cerebral Cavernous Malformation: From Mechanism to Therapy. Circ Res. 2021;129:195–215. - PMC - PubMed
    1. Perrelli A and Retta SF. Polymorphisms in genes related to oxidative stress and inflammation: Emerging links with the pathogenesis and severity of Cerebral Cavernous Malformation disease. Free Radic Biol Med. 2021;172:403–417. - PubMed
    1. Stamatovic SM, Sladojevic N, Keep RF and Andjelkovic AV. PDCD10 (CCM3) regulates brain endothelial barrier integrity in cerebral cavernous malformation type 3: role of CCM3-ERK1/2-cortactin cross-talk. Acta Neuropathol. 2015;130:731–50. - PMC - PubMed
    1. Lopez-Ramirez MA, Fonseca G, Zeineddine HA, Girard R, Moore T, Pham A, Cao Y, Shenkar R, de Kreuk BJ, Lagarrigue F, et al. ,. Thrombospondin1 (TSP1) replacement prevents cerebral cavernous malformations. J Exp Med. 2017;214:3331–3346. - PMC - PubMed
    1. Clatterbuck RE, Moriarity JL, Elmaci I, Lee RR, Breiter SN and Rigamonti D. Dynamic nature of cavernous malformations: a prospective magnetic resonance imaging study with volumetric analysis. J Neurosurg. 2000;93:981–6. - PubMed

Publication types