

Four Severity Levels for Grading the Tortuosity of a Retinal Fundus Image
- PMID: 36286352
- PMCID: PMC9605460
- DOI: 10.3390/jimaging8100258
Four Severity Levels for Grading the Tortuosity of a Retinal Fundus Image
Abstract
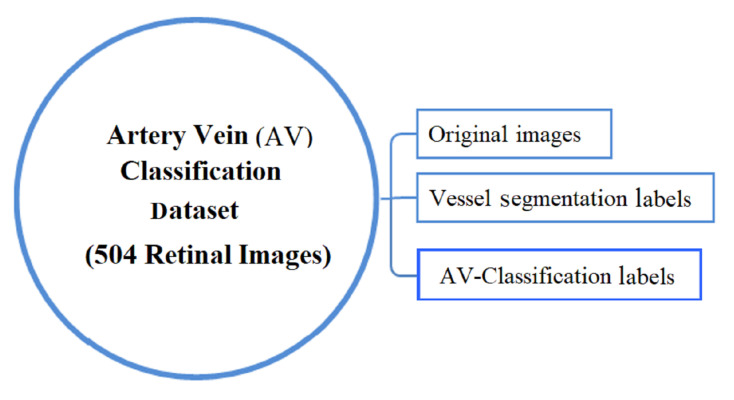
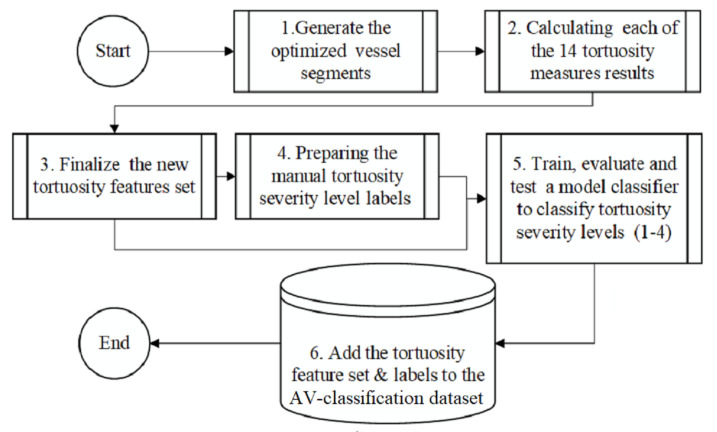
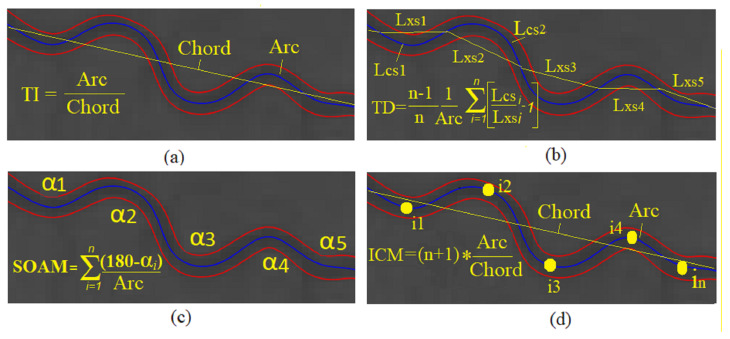
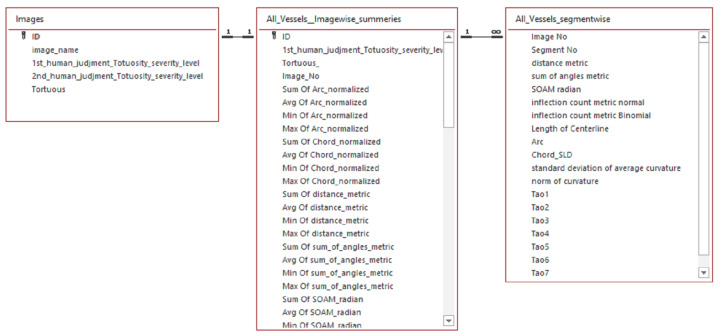
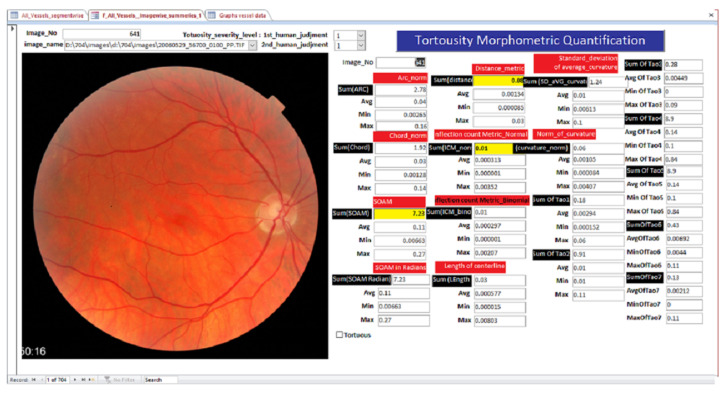
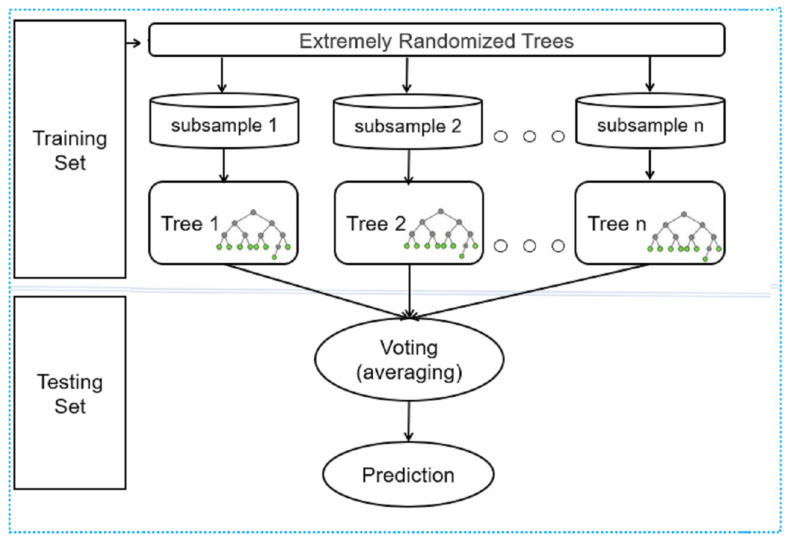
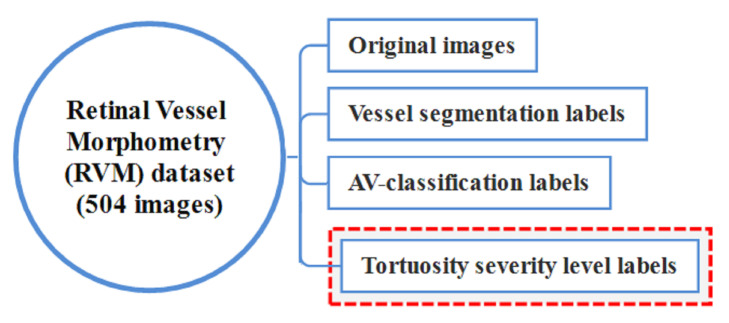
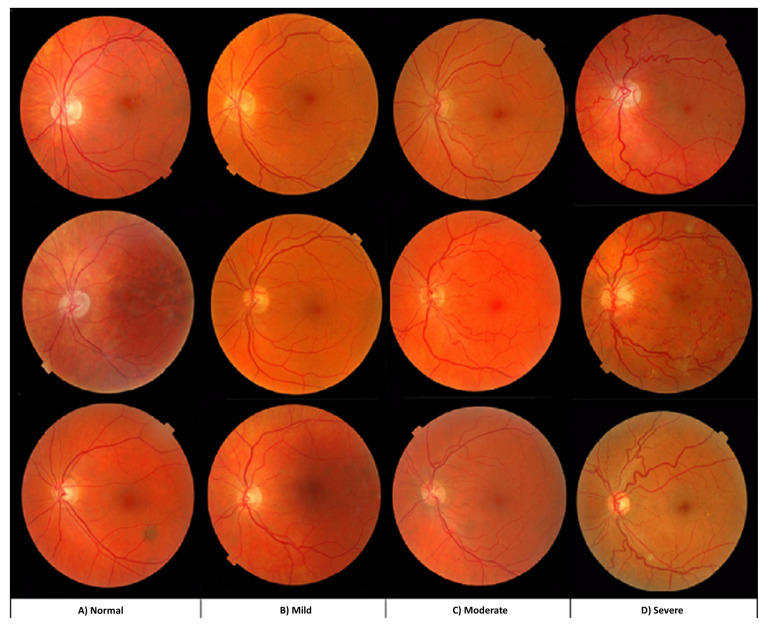
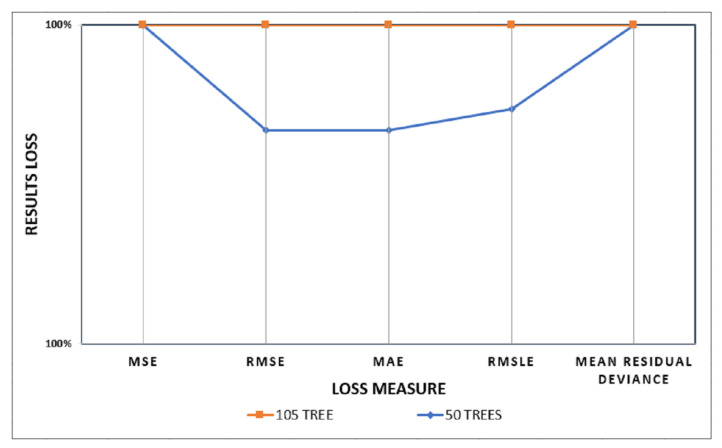
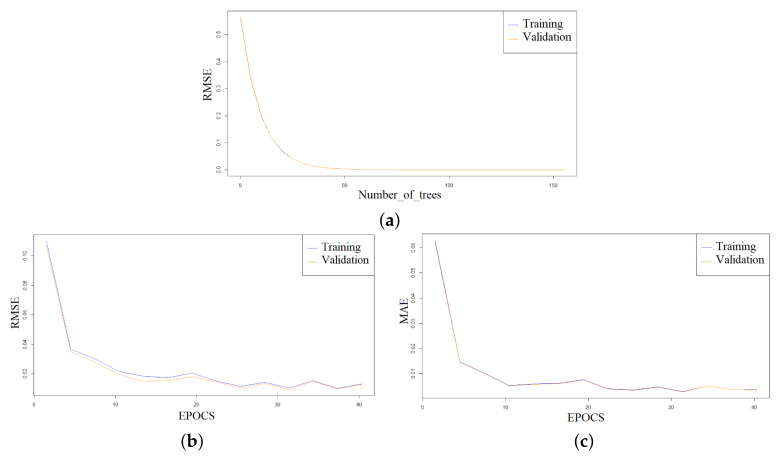
Hypertensive retinopathy severity classification is proportionally related to tortuosity severity grading. No tortuosity severity scale enables a computer-aided system to classify the tortuosity severity of a retinal image. This work aimed to introduce a machine learning model that can identify the severity of a retinal image automatically and hence contribute to developing a hypertensive retinopathy or diabetic retinopathy automated grading system. First, the tortuosity is quantified using fourteen tortuosity measurement formulas for the retinal images of the AV-Classification dataset to create the tortuosity feature set. Secondly, a manual labeling is performed and reviewed by two ophthalmologists to construct a tortuosity severity ground truth grading for each image in the AV classification dataset. Finally, the feature set is used to train and validate the machine learning models (J48 decision tree, ensemble rotation forest, and distributed random forest). The best performance learned model is used as the tortuosity severity classifier to identify the tortuosity severity (normal, mild, moderate, and severe) for any given retinal image. The distributed random forest model has reported the highest accuracy (99.4%) compared to the J48 Decision tree model and the rotation forest model with minimal least root mean square error (0.0000192) and the least mean average error (0.0000182). The proposed tortuosity severity grading matched the ophthalmologist's judgment. Moreover, detecting the tortuosity severity of the retinal vessels', optimizing vessel segmentation, the vessel segment extraction, and the created feature set have increased the accuracy of the automatic tortuosity severity detection model.
Keywords: blood vessels; decision support system; decision tree; diagnosis; distributed random forest; inflection count metric; retinal images; skeletonization; tortuosity.
Conflict of interest statement
The authors declare that there is no conflict of interest in this work with any party. This work is part of the first author’s Ph.D. thesis, which was defended on 27 August 2020; the thesis and the related source code are protected by copyrights law No. 404-2021 in the Ministry of Economics in the UAE and 153 other countries.
Figures

References
-
- Dictionary O.E., Idioms E.U. Oxford. Dictionary-Tortuous. 1989. [(accessed on 19 May 2022)]. Available online: https://www.oxfordlearnersdictionaries.com/definition/english/tortuous?q....
LinkOut - more resources
Full Text Sources
