. 2023 Jan 4;83(1):20-27.
doi: 10.1158/0008-5472.CAN-22-1492.

Common Germline Risk Variants Impact Somatic Alterations and Clinical Features across Cancers

Affiliations

Common Germline Risk Variants Impact Somatic Alterations and Clinical Features across Cancers

Shinichi Namba et al. Cancer Res. .

Abstract

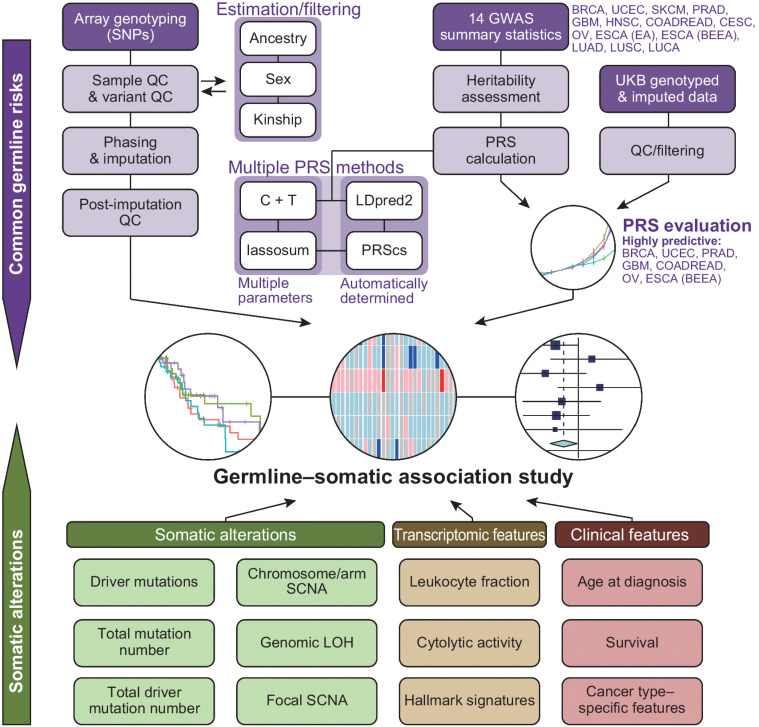
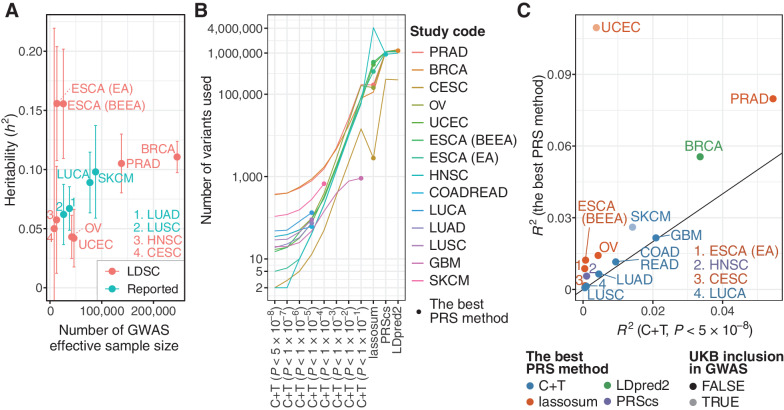
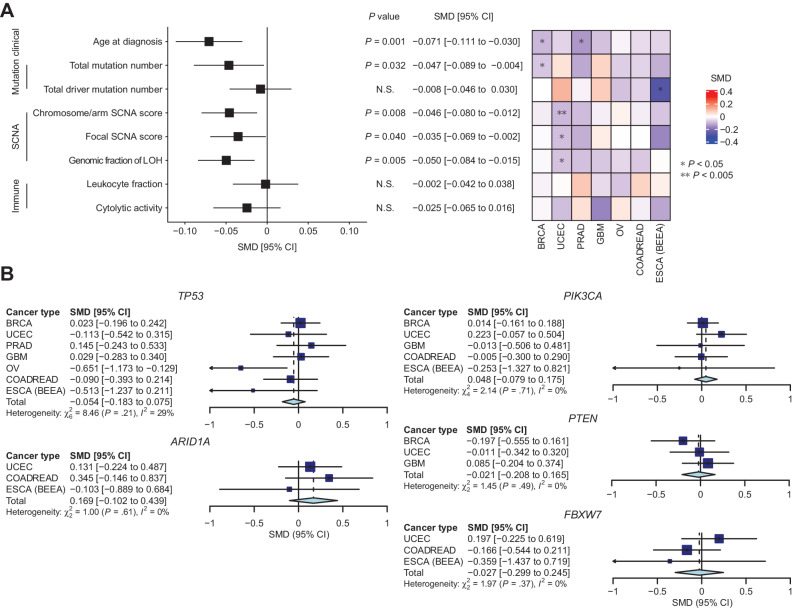
Aggregation of genome-wide common risk variants, such as polygenic risk score (PRS), can measure genetic susceptibility to cancer. A better understanding of how common germline variants associate with somatic alterations and clinical features could facilitate personalized cancer prevention and early detection. We constructed PRSs from 14 genome-wide association studies (median n = 64,905) for 12 cancer types by multiple methods and calibrated them using the UK Biobank resources (n = 335,048). Meta-analyses across cancer types in The Cancer Genome Atlas (n = 7,965) revealed that higher PRS values were associated with earlier cancer onset and lower burden of somatic alterations, including total mutations, chromosome/arm somatic copy-number alterations (SCNA), and focal SCNAs. This contrasts with rare germline pathogenic variants (e.g., BRCA1/2 variants), showing heterogeneous associations with somatic alterations. Our results suggest that common germline cancer risk variants allow early tumor development before the accumulation of many somatic alterations characteristic of later stages of carcinogenesis.

Significance: Meta-analyses across cancers show that common germline risk variants affect not only cancer predisposition but the age of cancer onset and burden of somatic alterations, including total mutations and copy-number alterations.


Figures

Figure 1. Overview of this study. A graphical overview of germline–somatic association analyses. SNP, single-nucleotide polymorphism; QC, quality control; BRCA, breast cancer; UCEC, uterine endometrial carcinoma; SKCM, skin cutaneous melanoma; PRAD, prostate cancer; GBM, glioblastoma multiforme; HNSC, head and neck squamous cell carcinoma; COADREAD, colorectal cancer; CESC, cervical cancer; OV, ovarian serous carcinoma; ESCA (EA), esophageal adenocarcinoma; ESCA (BEEA), esophageal adenocarcinoma and Barrett's esophagus; LUAD, lung adenocarcinoma; LUSC, lung squamous cell carcinoma; LUCA, lung cancer; SCNA, somatic copy-number alteration; LOH, loss of heterozygosity.
Figure 1.
Overview of this study. A graphical overview of germline–somatic association analyses. CESC, cervical cancer; COADREAD, colorectal cancer; ESCA (BEEA), esophageal adenocarcinoma and Barrett's esophagus; ESCA (EA), esophageal adenocarcinoma; GBM, glioblastoma multiforme; HNSC, head and neck squamous cell carcinoma; LUAD, lung adenocarcinoma; LUCA, lung cancer; LUSC, lung squamous cell carcinoma; OV, ovarian serous carcinoma; PRAD, prostate cancer; QC, quality control; SKCM, skin cutaneous melanoma; SNP, single-nucleotide polymorphism; UCEC, uterine endometrial carcinoma.
Figure 2. Construction and evaluation of PRSs. A, A scatter plot showing heritability (h2) and effective sample size of the GWAS summary statistics. Heritability was estimated by LD score regression (LDSC) for GWASs in which genome-wide variants were available. For others, heritability estimated by LDSC was obtained from the original articles if reported (Reported). GBM and COADREAD were excluded because heritability estimated by LDSC was not reported for these cancer types. Error bars represent 95% confidence interval. B, The number of variants used for calculating PRSs. For six GWAS summary statistics in which genome-wide variants were unavailable, only C+T was conducted for PRS calculation. C, The difference of Nagelkerke's R2 for the C+T PRS with genome-wide significant variants (i.e., P < 5×10⁻⁸; x-axis) and the best PRS (y-axis). It was calculated in UKB as a difference between the full model and the reduced model, including all covariates but PRS. UCEC and SKCM are shown in light colors because UKB was included in the GWAS cohort for these two cancer types.
Figure 2.
Construction and evaluation of PRSs. A, A scatter plot showing heritability (h2) and effective sample size of the GWAS summary statistics. Heritability was estimated by LD score regression (LDSC) for GWASs, in which genome-wide variants were available. For others, heritability estimated by LDSC was obtained from the original articles if reported (Reported). GBM and COADREAD were excluded because heritability estimated by LDSC was not reported for these cancer types. Error bars, 95% confidence interval. B, The number of variants used for calculating PRSs. For six GWAS summary statistics in which genome-wide variants were unavailable, only C+T was conducted for PRS calculation. C, The difference of Nagelkerke's R2 for the C+T PRS with genome-wide significant variants (i.e., P < 5×10⁻⁸; x-axis) and the best PRS (y-axis). It was calculated in UKB as a difference between the full model and the reduced model including all covariates but PRS. UCEC and SKCM are shown in light colors because UKB was included in the GWAS cohort for these two cancer types.
Figure 3. Germline–somatic association analyses in TCGA. A, The associations between PRS values and somatic/clinical features of cancer. Pooled effect size (standardized mean difference; SMD) of PRS values for evaluated features (left). Heatmap, indicating the SMD of PRS values for each feature in each cancer type (right). SCNA, somatic copy-number alteration; LOH, loss of heterozygosity. B, Forest plots of cancer type–specific and pooled SMD of PRS values for driver mutations. Genes listed as drivers in three or more cancer types were evaluated.
Figure 3.
Germline–somatic association analyses in TCGA. A, The associations between PRS values and somatic/clinical features of cancer. Left, pooled effect size (standardized mean difference, SMD) of PRS values for evaluated features. Right, heatmap indicating the SMD of PRS values for each feature in each cancer type. B, Forest plots of cancer type–specific and pooled SMD of PRS values for driver mutations. Genes listed as drivers in three or more cancer types were evaluated.

References

    1. Huang K-L, Mashl RJ, Wu Y, Ritter DI, Wang J, Oh C, et al. . Pathogenic germline variants in 10,389 adult cancers. Cell 2018;173:355–70. - PMC - PubMed
    1. Bailey MH, Tokheim C, Porta-Pardo E, Sengupta S, Bertrand D, Weerasinghe A, et al. . Comprehensive characterization of cancer driver genes and mutations. Cell 2018;173:371–85.e18. - PMC - PubMed
    1. Campbell PJ, Getz G, Korbel JO, Stuart JM, Jennings JL, Stein LD, et al. . Pan-cancer analysis of whole genomes. Nature 2020;578:82–93. - PMC - PubMed
    1. Zhang YD, Hurson AN, Zhang H, Choudhury PP, Easton DF, Milne RL, et al. . Assessment of polygenic architecture and risk prediction based on common variants across fourteen cancers. Nat Commun 2020;11:3353. - PMC - PubMed
    1. Kachuri L, Graff RE, Smith-Byrne K, Meyers TJ, Rashkin SR, Ziv E, et al. . Pan-cancer analysis demonstrates that integrating polygenic risk scores with modifiable risk factors improves risk prediction. Nat Commun 2020;11:6084. - PMC - PubMed

Publication types