. 2022 Dec 21;10(6):e0229722.
doi: 10.1128/spectrum.02297-22. Epub 2022 Oct 26.

Multiplexed Target Enrichment Enables Efficient and In-Depth Analysis of Antimicrobial Resistome in Metagenomes

Affiliations

Multiplexed Target Enrichment Enables Efficient and In-Depth Analysis of Antimicrobial Resistome in Metagenomes

Yiming Li et al. Microbiol Spectr. .

Abstract

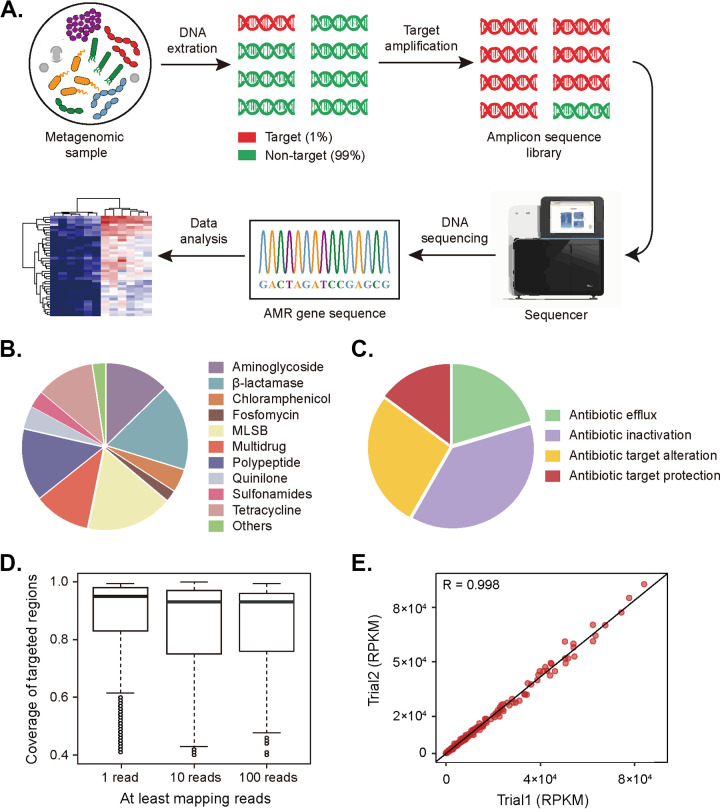
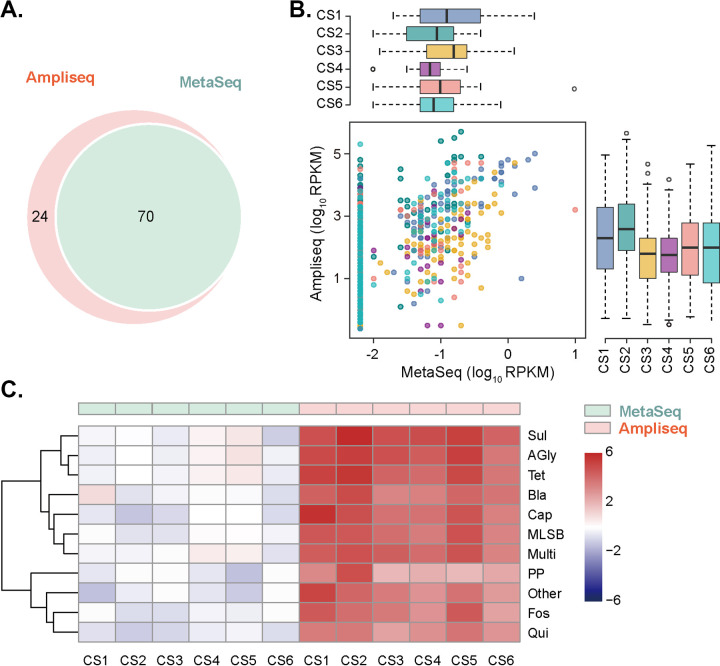
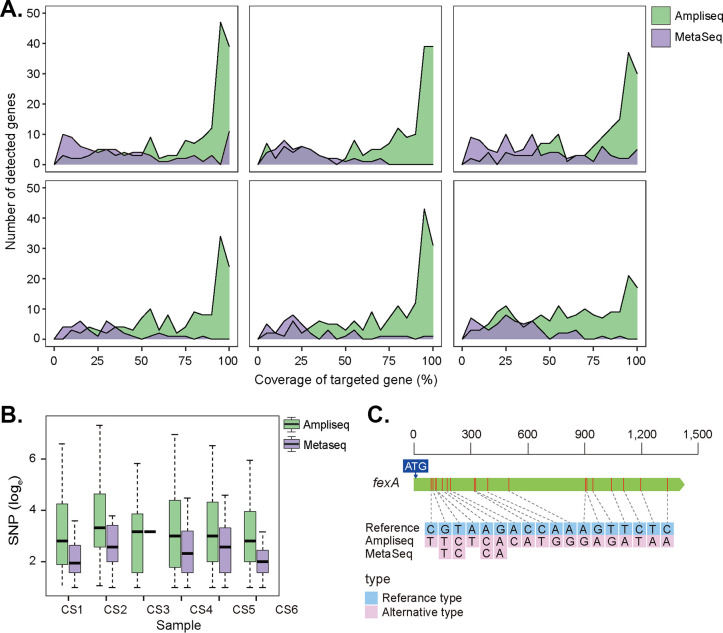
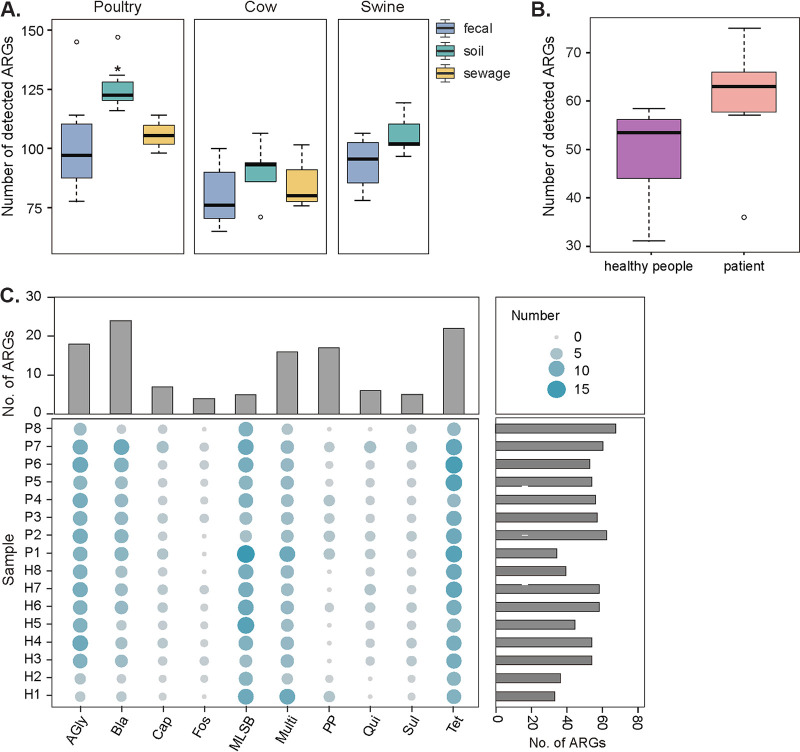
Antibiotic resistance genes (ARGs) pose a serious threat to public health and ecological security in the 21st century. However, the resistome only accounts for a tiny fraction of metagenomic content, which makes it difficult to investigate low-abundance ARGs in various environmental settings. Thus, a highly sensitive, accurate, and comprehensive method is needed to describe ARG profiles in complex metagenomic samples. In this study, we established a high-throughput sequencing method based on targeted amplification, which could simultaneously detect ARGs (n = 251), mobile genetic element genes (n = 8), and metal resistance genes (n = 19) in metagenomes. The performance of amplicon sequencing was compared with traditional metagenomic shotgun sequencing (MetaSeq). A total of 1421 primer pairs were designed, achieving extremely high coverage of target genes. The amplicon sequencing significantly improved the recovery of target ARGs (~9 × 10⁴-fold), with higher sensitivity and diversity, less cost, and computation burden. Furthermore, targeted enrichment allows deep scanning of single nucleotide polymorphisms (SNPs), and elevated SNPs detection was shown in this study. We further performed this approach for 48 environmental samples (37 feces, 20 soils, and 7 sewage) and 16 clinical samples. All samples tested in this study showed high diversity and recovery of targeted genes. Our results demonstrated that the approach could be applied to various metagenomic samples and served as an efficient tool in the surveillance and evolution assessment of ARGs. Access to the resistome using the enrichment method validated in this study enabled the capture of low-abundance resistomes while being less costly and time-consuming, which can greatly advance our understanding of local and global resistome dynamics. IMPORTANCE ARGs, an increasing global threat to human health, can be transferred into health-related microorganisms in the environment by horizontal gene transfer, posing a serious threat to public health. Advancing profiling methods are needed for monitoring and predicting the potential risks of ARGs in metagenomes. Our study described a customized amplicon sequencing assay that could enable a high-throughput, targeted, in-depth analysis of ARGs and detect a low-abundance portion of resistomes. This method could serve as an efficient tool to assess the variation and evolution of specific ARGs in the clinical and natural environment.

Keywords: SNPs; high-throughput sequencing; metagenomics; resistome; targeted amplification.


Conflict of interest statement

The authors declare no conflict of interest.

Figures

FIG 1
FIG 1
Characteristic of the designed approach. (A) The whole process of amplicon sequencing. The workflow begins with DNA exaction from a metagenomic sample. Targeted sequences only account for less than 1% of the total DNA. Targeted sequences are amplified and then prepared into a sequencing library. The amplified library was sequenced, and reads were analyzed for ARGs by aligning with the sequences in the custom database for further analysis. (B) Classification of ARG determinations selected from Resfinder, CARD, and AMRFinderPlus database (n = 251). MLSB, macrolide-lincosamide-streptogramin B. (C) Classification of resistance mechanisms of selected ARG determinations. (D) Percent length of coverage of targeted regions with reads from 6 tested samples (1 versus 10 versus 100 reads). (E) Consistency of methods in different trials. Reads from samples in Trail 2 were library prep and sequenced to the same depth as reads in Trial 1. The reads were mapped to target regions, filtered for mapping quality, and then the number of reads was normalized using reads per kilobase per million (RPKM). Pearson correlation coefficients are shown in the diagram.
FIG 2
FIG 2
Performance summary. (A) Venn diagrams between AmpliSeq and MetaSeq of differentially detected mapping gene clusters against the custom database in this study. Each mapping gene cluster refers to a set of alleles/genes detected by a set of reads. (B) Reads per kilobase per million (RPKM) of reads mapping to each detected gene between MetaSeq and AmpliSeq. Genes only screened by AmpliSeq are shown in the initial values of the abscissa axis. (C) Abundance (RPKM) of each ARG family between AmpliSeq and MetaSeq. ARGs were classified into 10 families (Sul, sulfonamides; AGly, aminoglycosides; Tet, tetracyclines; Bla, β-lactams; Cap, chloramphenicol; MLSB, macrolide-lincosamide-streptogramin B; Multi, multidrug; PP, polypeptide; Fos, fosfomycin; Qui, quinolone). RPKM was used to normalize read counts and log-transformed to produce the heat map.
FIG 3
FIG 3
Comparison of AmpliSeq and MetaSeq in gene diversity. (A) Diversity and coverage distribution of target genes. The figures show the comparison of the length coverage distribution of targeted genes between MetaSeq and AmpliSeq in each sample (n = 6). (B) Distribution was represented by the density parameter and expressed by the length coverage of each detected gene (abscissa) and the number of detected genes (ordinate). Comparison of single nucleotide polymorphisms (SNPs) distributions between MetaSeq and AmpliSeq in each sample (n = 6). Distributions were represented by the number of SNPs detected in each targeted gene in different samples. (C) Nucleotide variant depiction for the fexA gene (the full length of which is represented in the figure) across all 12 samples. SNPs identified in AmpliSeq (n = 6) and MetaSeq (n = 6) were combined, respectively, and exhibited in the figure.
FIG 4
FIG 4
Application of the method in environmental and clinical samples. (A) Diversity of ARGs among different environmental samples. Diversity was measured as the number of targeted genes detected in each sample. (B) Comparison of the diversity of ARGs between healthy individuals and patients. (C) Statistical combination diagrams of ARGs diversity of clinical samples. Balloon plot depicting the number of targeted ARGs detected in each sample (n = 16). The size of the circles represented the number of detected ARGs and the details were annotated in the legend. H1 to H8, healthy individuals. P1 to P8, patients.
FIG 5
FIG 5
Correlation (upper triangle) and co-occurrence of ARGs and MGEs (lower triangle) (n = 64). r, correlation coefficient, which was calculated by gene abundance (RPKM). Only correlations that were found to be statistically significant (the absolute value of r > 0.7 and P < 0.01) were shown (upper triangle). The low triangle exhibited a pairwise co-occurrence matrix of all ARGs and MGEs detected. The colors denote the cases when two genes coexisted.
FIG 6
FIG 6
Application of designed approach using AmpliSeq and ATOPlex platforms. The colors denote the counts of reads mapping to each detected gene between MetaSeq and AmpliSeq. RPKM was used to normalize read counts and log-transformed to produce the heat map.

References

    1. Ferri M, Ranucci E, Romagnoli P, Giaccone V. 2017. Antimicrobial resistance: a global emerging threat to public health systems. Crit Rev Food Sci Nutr 57:2857–2876. doi:10.1080/10408398.2015.1077192. - DOI - PubMed
    1. Boolchandani M, D'Souza AW, Dantas G. 2019. Sequencing-based methods and resources to study antimicrobial resistance. Nat Rev Genet 20:356–370. doi:10.1038/s41576-019-0108-4. - DOI - PMC - PubMed
    1. WHO. 2019. Ten threats to global health in 2019.
    1. Makkaew P, Kongprajug A, Chyerochana N, Sresung M, Precha N, Mongkolsuk S, Sirikanchana K. 2021. Persisting antibiotic resistance gene pollution and its association with human sewage sources in tropical marine beach waters. Int J Hyg Environ Health 238:113859. doi:10.1016/j.ijheh.2021.113859. - DOI - PubMed
    1. Zhang S, Abbas M, Rehman MU, Huang Y, Zhou R, Gong S, Yang H, Chen S, Wang M, Cheng A. 2020. Dissemination of antibiotic resistance genes (ARGs) via integrons in Escherichia coli: a risk to human health. Environ Pollut 266:115260. doi:10.1016/j.envpol.2020.115260. - DOI - PubMed

Publication types

LinkOut - more resources