. 2022 Dec 21;10(6):e0286622.
doi: 10.1128/spectrum.02866-22. Epub 2022 Oct 26.

Unraveling Capsule Biosynthesis and Signaling Networks in Cryptococcus neoformans

Affiliations

Unraveling Capsule Biosynthesis and Signaling Networks in Cryptococcus neoformans

Eun-Ha Jang et al. Microbiol Spectr. .

Abstract

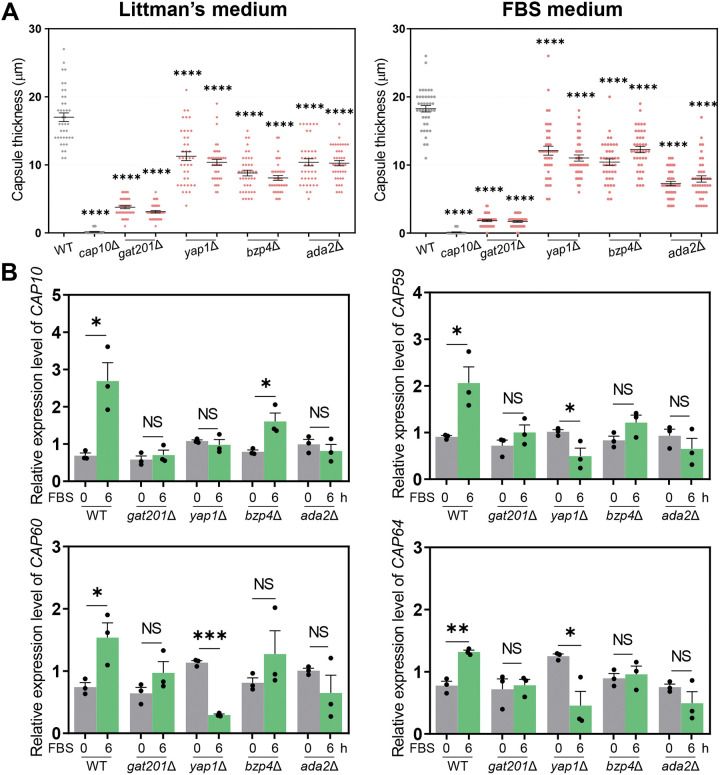
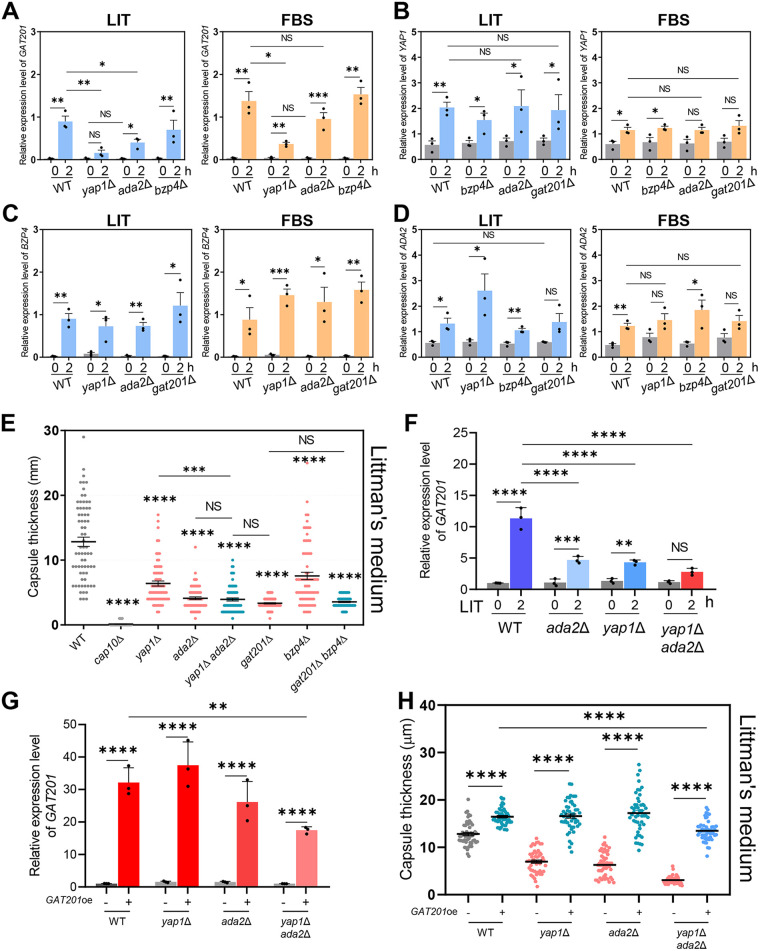
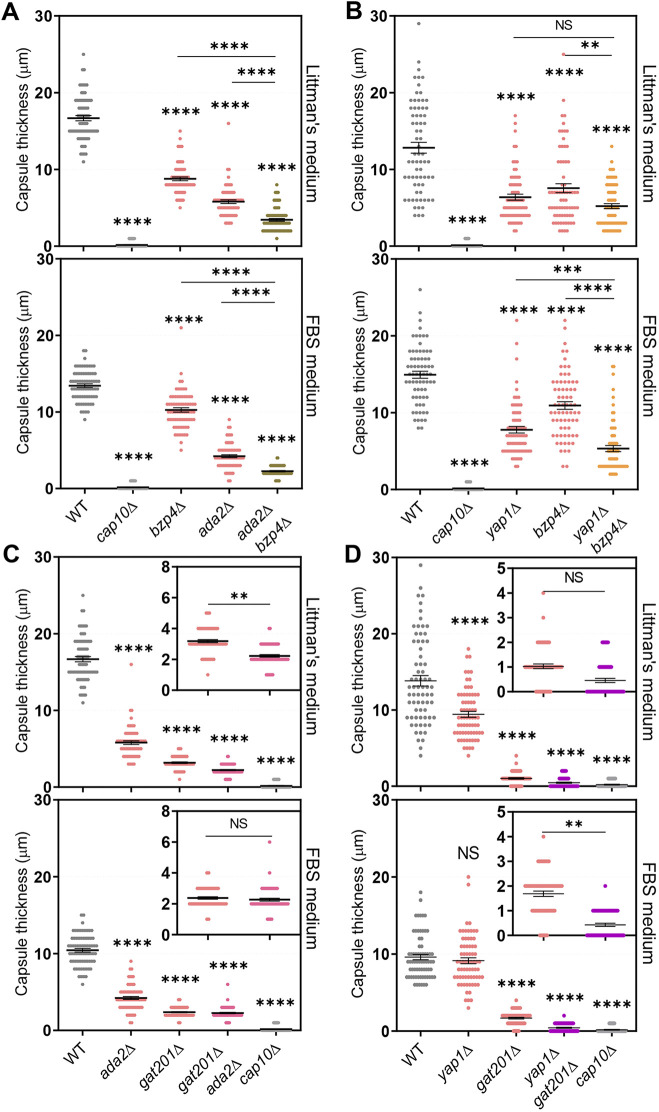
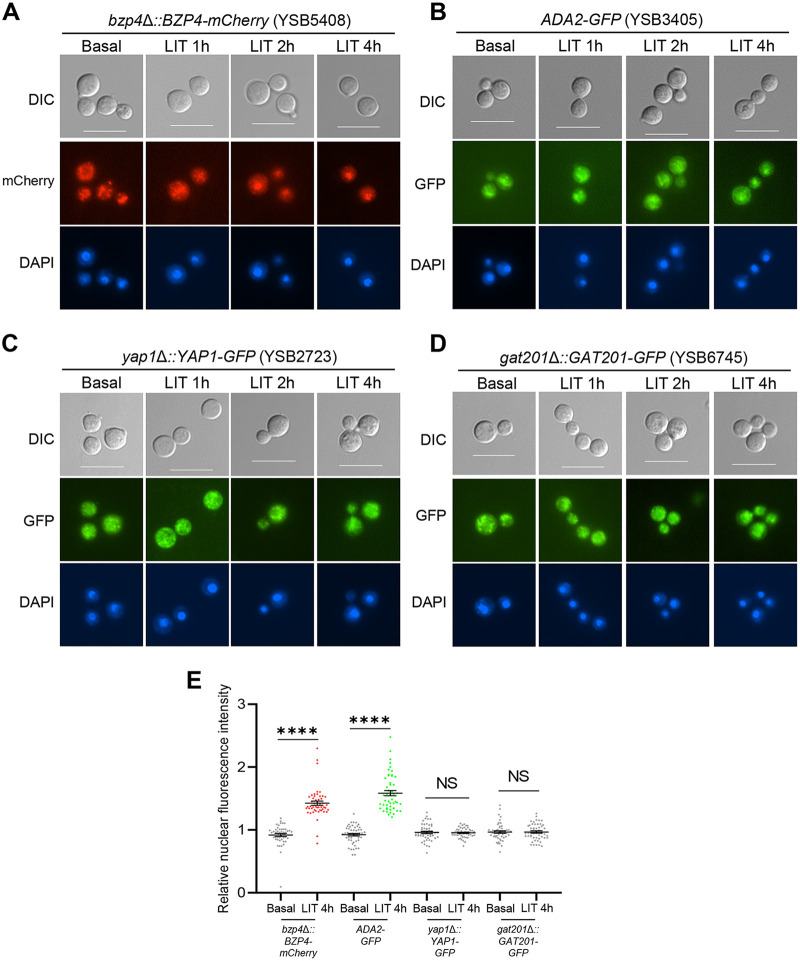
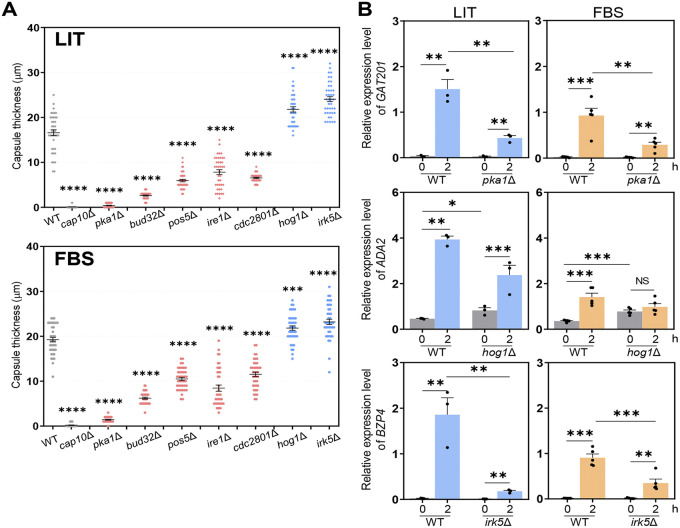
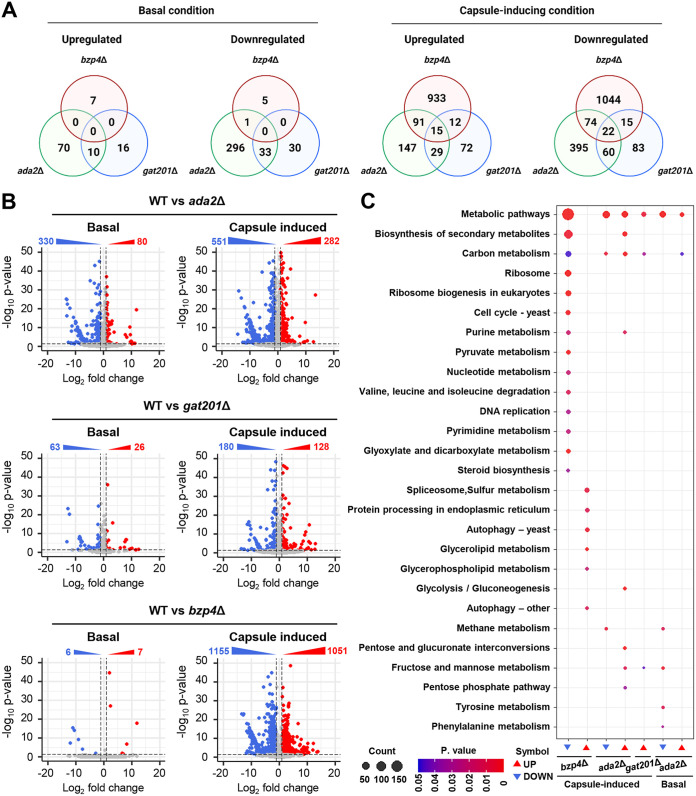
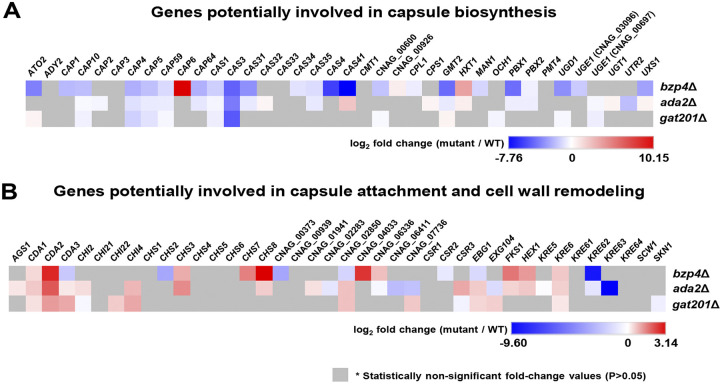
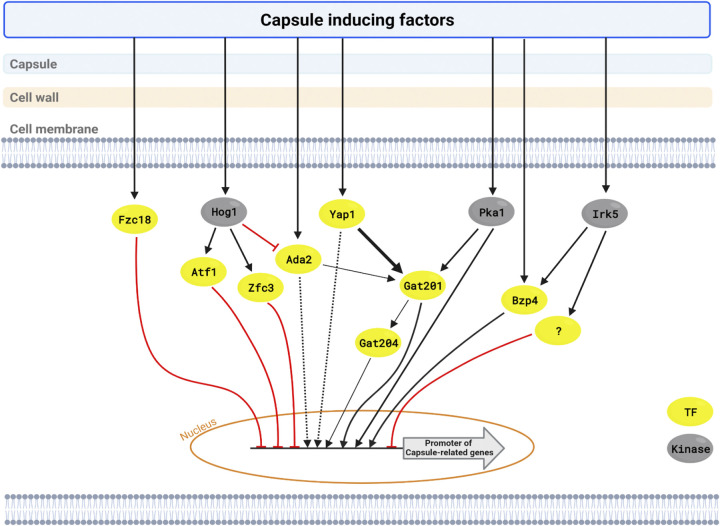
The polysaccharide capsule of Cryptococcus neoformans-an opportunistic basidiomycete pathogen and the major etiological agent of fungal meningoencephalitis-is a key virulence factor that prevents its phagocytosis by host innate immune cells. However, the complex signaling networks for their synthesis and attachment remain elusive. In this study, we systematically analyzed capsule biosynthesis and signaling networks using C. neoformans transcription factor (TF) and kinase mutant libraries under diverse capsule-inducing conditions. We found that deletion of GAT201, YAP1, BZP4, and ADA2 consistently caused capsule production defects in all tested media, indicating that they are capsule-regulating core TFs. Epistatic and expression analyses showed that Yap1 and Ada2 control Gat201 upstream, whereas Bzp4 and Gat201 independently regulate capsule production. Next, we searched for potential upstream kinases and found that mutants lacking PKA1, BUD32, POS5, IRE1, or CDC2801 showed reduced capsule production under all three capsule induction conditions, whereas mutants lacking HOG1 and IRK5 displayed enhanced capsule production. Pka1 and Irk5 controlled the induction of GAT201 and BZP4, respectively, under capsule induction conditions. Finally, we monitored the transcriptome profiles governed by Bzp4, Gat201, and Ada2 under capsule-inducing conditions and demonstrated that these TFs regulate redundant and unique sets of downstream target genes. Bzp4, Ada2, and Gat201 govern capsule formation in C. neoformans by regulating the expression of various capsule biosynthesis genes and chitin/chitosan synthesis genes in a positive and negative manner, respectively. In conclusion, this study provides further insights into the complex regulatory mechanisms of capsule production-related signaling pathways in C. neoformans. IMPORTANCE Over the past decades, human fungal pathogens, including C. neoformans, have emerged as a major public threat since the AIDS pandemic, only to gain more traction in connection to COVID-19. Polysaccharide capsules are rare fungal virulence factors that are critical for protecting C. neoformans from phagocytosis by macrophages. To date, more than 75 proteins involved in capsule synthesis and cell wall attachment have been reported in C. neoformans; however, their complex upstream signaling networks remain elusive. In this study, we demonstrated that Ada2, Yap1, Bzp4, and Gat201 were key capsule-inducing transcriptional regulators. Yap1 and Ada2 function upstream of Gat201, whereas Bzp4 and Gat201 function independently. Genome-wide transcriptome profiling revealed that Bzp4, Gat201, and Ada2 promote capsule production and attachment by positively and negatively regulating genes involved in capsule synthesis and chitin/chitosan synthesis, respectively. Thus, this study provides comprehensive insights into the complex capsule-regulating signaling pathway in C. neoformans.

Keywords: Ada2; Bzp4; Gat201; Yap1; kinase; transcription factor.


Conflict of interest statement

The authors declare no conflict of interest.

Figures

FIG 1
FIG 1
Core transcription factors involved in Cryptococcus neoformans capsule biosynthesis. (A) Wild-type (WT) (H99S), cap10Δ (YSB4081), gat201Δ (YSB3300, YSB3301), yap1Δ (YSB815, YSB1290), bzp4Δ (YSB1894, YSB1895), and ada2Δ (YSB2381, YSB2382) strains were grown in yeast extract-peptone-dextrose (YPD) liquid medium at 30°C shaking incubator for 16 h, washed with phosphate-buffered saline (PBS), and spotted onto a Littman’s (LIT) solid medium and 10% fetal bovine serum (FBS) solid medium. Cells were incubated for an additional 2 days at 37°C. Each graph indicates relative capsule size of two independent transcription factor mutants which exhibited statistically significant changes in capsule production (±30% difference relative to wild type as the cutoff). Three biologically independent experiments were performed, and representative data are shown here. Each measurement was repeated for 40 cells per condition. Error bars indicate standard deviation. Statistical analysis was performed using one-way analysis of variance (ANOVA) with Bonferroni’s multiple-comparison test. (*, P < 0.05; **, P < 0.01; ***, P < 0.001; ****, P < 0.0001). (B) The expression level of capsule-biosynthesis genes was determined using quantitative reverse transcription PCR (qRT-PCR) with cDNA from total RNA samples of WT (H99S), gat201Δ (YSB3300), yap1Δ (YSB815), bzp4Δ (YSB1895), and ada2Δ (YSB2382) strains grown in basal YPD medium and 10% FBS medium. CAP10, CAP59, CAP60, and CAP64 expression levels were normalized by actin gene (ACT1) expression. Each strain grown in YPD medium (time zero sample) were resuspended in 10% FBS liquid medium and further incubated for 6 h. Three biological replicate samples with three technical replicates were analyzed using qRT-PCR. Error bars indicate standard deviation. Statistical analysis was performed using Student’s t test (*, P < 0.05; **, P < 0.01; ***, P < 0.001; ****, P < 0.0001).
FIG 2
FIG 2
Yap1 and Ada2 coregulate GAT201 induction under capsule-inducing conditions. The expression levels of GAT201, YAP1, ADA2, and BZP4 were determined using qRT-PCR with cDNA from total RNA samples of WT (H99S), gat201Δ (YSB3300), yap1Δ (YSB815), bzp4Δ (YSB1895), and ada2Δ (YSB2382) strains grown in basal YPD, LIT, and 10% FBS liquid medium. (A) GAT201, (B) YAP1, (C) BZP4, and (D) ADA2 expression levels normalized to ACT1 expression. Each strain grown in YPD medium (time zero sample) was resuspended in LIT or FBS liquid medium and further incubated for 2 h. Three biological replicate samples with three technical replicates were analyzed using qRT-PCR. Error bars indicate standard deviation. Statistical analysis was performed using Student’s t test. (E) WT (H99S), cap10Δ (YSB4081), yap1Δ (YSB815), ada2Δ (YSB2382), yap1Δ ada2Δ (YSB6054), gat201Δ (YSB3300), bzp4Δ (YSB1895), and gat201Δ bzp4Δ (YSB6052) strains were grown in YPD liquid medium at 30°C for 16 h, washed with PBS, and spotted onto LIT solid medium. The cells were further incubated for 2 days at 37°C. Three biologically independent experiments were performed, and representative data are shown. Each measurement was repeated for 70 cells for each condition. Error bars indicate standard deviation. Statistical analysis was performed using one-way ANOVA with Bonferroni’s multiple-comparison test. (F) GAT201 expression levels were determined using qRT-PCR with cDNA from total RNA samples of WT (H99S), ada2Δ (YSB2382), yap1Δ (YSB815), and yap1Δ ada2Δ (YSB6054) strains grown in basal YPD and LIT medium. GAT201 expression levels were normalized to ACT1 expression. Each strain grown in YPD medium (time zero sample) was resuspended in LIT liquid medium and further incubated for 2 h. Three biological replicate samples with three technical replicates were analyzed using qRT-PCR. Error bars indicate standard deviation. Statistical analysis was performed using one-way ANOVA with Bonferroni’s multiple-comparison test. (G) GAT201 overexpression by the H3 promoter replacement was confirmed by qRT-PCR. Each strain was cultured in YPD liquid medium at 30°C for 16 h and subcultured in fresh YPD liquid medium until the OD600 reached 0.6 to 0.8. GAT201 expression levels were normalized to ACT1 expression. Total RNA extracted from three biological replicate samples was analyzed using qRT-PCR with three technical replicates. Mean values are shown, error bars indicate standard deviation. Statistical analyses were performed using Student’s t test. (H) GAT201 overexpression strains generated in wild-type, ada2Δ, yap1Δ, or yap1Δ ada2Δ strain backgrounds were grown in YPD liquid medium at 30°C for 16 h, washed with PBS, and spotted onto LIT solid medium. The cells were further incubated for 2 days at 37°C. Each measurement was repeated on 50 cells for each condition. Mean values are shown with error bars indicating standard deviation. Statistical analyses were performed using Student’s t test. *, P < 0.05; **, P < 0.01; ***, P < 0.001; ****, P < 0.0001 for all panels.
FIG 3
FIG 3
BZP4 regulates capsule production independently of Ada2 and Yap1. The following strains were grown in YPD liquid medium at 30°C for 16 h, washed with PBS, and spotted onto a Littman’s (LIT) solid medium and 10% fetal bovine serum (FBS) solid medium: (A) WT (H99S), cap10Δ (YSB4081), bzp4Δ (YSB1895), ada2Δ (YSB2382), and ada2Δ bzp4Δ (YSB6169), (B) WT (H99S), cap10Δ (YSB4081), yap1Δ (YSB815), bzp4Δ (YSB1895), and yap1Δ bzp4Δ (YSB6055), (C) WT (H99S), ada2Δ (YSB2382), gat201Δ (YSB3300), gat201Δ ada2Δ (YSB6167), and cap10Δ (YSB4081) (D) WT (H99S), yap1Δ (YSB815), gat201Δ (YSB3300), yap1Δ gat201Δ (YSB6695), and cap10Δ (YSB4081). (C and D) Small graphs indicate gat201Δ and double mutants. Cells were further incubated for 2 days at 37°C. Three biologically independent experiments were performed, and representative data are shown here. Each measurement was repeated for 70 cells per condition. Error bars indicate standard deviation. Statistical analysis was performed using one-way ANOVA with Bonferroni’s multiple-comparison test. *, P < 0.05; **, P < 0.01; ***, P < 0.001; ****, P < 0.0001.
FIG 4
FIG 4
Bzp4 and Ada2 are localized in nucleus under capsule-inducing conditions. (A) bzp4Δ::BZP4-mCherry (YSB5408), (B) ADA2-GFP (YSB3405), (C) yap1Δ::YAP1-GFP (YSB2723), and (D) gat201Δ::GAT201-GFP (YSB6745) were cultured in YPD liquid medium at 30°C for 16 h and subcultured in fresh YPD liquid medium until OD600 reached 0.6 to 0.8. Subcultured cells were washed with PBS and resuspended in 40 mL LIT medium. After suspension, cells were incubated at 37°C in a shaking incubator and a portion of them (1 mL) was sampled at each time point (1, 2, and 4 h) and fixed in paraformaldehyde. Fixed cells were stained with Hoechst for nuclear staining and observed through differential interference contrast (DIC) microscopy (scale bar = 10 μm). RFP and GFP indicate red and green fluorescent protein, respectively. (E) Quantification of nuclear-localized fluorescent proteins. Relative nuclear fluorescence intensity was calculated as a ratio of the average fluorescence intensity of the nucleus to the average fluorescence intensity of the entire cell. Each measurement was repeated on 50 cells for each condition. Mean values are shown, error bars indicate standard deviation. Statistical analyses were performed using Student’s t test. *, P < 0.05; **, P < 0.01; ***, P < 0.001; ****, P < 0.0001.
FIG 5
FIG 5
Core kinases involved in C. neoformans capsule biosynthesis. (A) WT (H99S), cap10Δ (YSB4081), pka1Δ (YSB188), bud32Δ (YSB1969), pos5Δ (YSB3714), ire1Δ (YSB552), cdc2801Δ (YSB3699), hog1Δ (YSB64), and irk5Δ (YSB2952) strains were grown in YPD liquid medium at 30°C in shaking incubator for 16 h, washed with PBS, and spotted onto LIT solid medium and 10% FBS solid medium. Cells were further incubated for 2 days at 37°C. Each graph indicates relative capsule size of transcription factor mutants which exhibited statistically significant changes in capsule production (±30% difference relative to the wild type as cutoff). Three biologically independent experiments were performed, and representative data are shown here. Each measurement was repeated for 40 cells per condition. Error bars indicate standard deviation. Statistical analysis was performed using one-way ANOVA with Bonferroni’s multiple-comparison test. Expression levels of (B) GAT201, ADA2, and BZP4 were determined using qRT-PCR with cDNA from total RNA samples of WT (H99S), pka1Δ (YSB188), hog1Δ (YSB64), and irk5Δ (YSB2952) strains grown in basal YPD and LIT. GAT201, ADA2, and BZP4 expression levels were normalized by ACT1 expression. Each strain grown in YPD medium (time zero sample) was resuspended in LIT liquid medium and further incubated for 2 h. Three biological replicate samples with three technical replicates were analyzed using qRT-PCR. Error bars indicate standard deviation. Statistical analysis was performed using Student’s t test. *, P < 0.05; **, P < 0.01; ***, P < 0.001; ****, P < 0.0001 for all panels.
FIG 6
FIG 6
Capsule-inducing condition affects gene expression patterns of wild-type strain, bzp4Δ, ada2Δ, and gat201Δ mutants. (A) Transcriptome profiles governed by Bzp4, Ada2, and Gat201 under basal (YPD) and capsule-inducing (LIT) conditions. The numbers of genes whose expression was significantly up- or downregulated at least 2-fold in the bzp4Δ, ada2Δ, and gat201Δ mutants compared with the WT strain under basal (YPD) or capsule-inducing conditions (LIT) are indicated in Venn diagrams. (B) The cutoff ranges of the fold change were 2 with a P value of <0.05 calculated by each set. A volcano plot of the RNA data was created using DESeq2 and plotted using R package. (C) Significant differences in KEGG pathway analysis are shown between basal and capsule-inducing conditions. Mutants which have no significant pathway are not shown.
FIG 7
FIG 7
Heatmap of known capsule-regulating and cell wall-remodeling genes in bzp4Δ, ada2Δ, and gat201Δ mutants. Heatmap showing transcriptome gene expression values for genes already known to be involved in capsule biosynthesis (A), capsule attachment, and cell wall remodeling (B). The heatmap was constructed using Morpheus (Broad Institute, Cambridge, MA).
FIG 8
FIG 8
Putative epistatic model of capsule production pathways in C. neoformans. Capsule-inducing conditions control various transcription factors and kinases. Core capsule-regulating transcription factors are regulated by several kinases involved in capsule formation. Yellow circle, TF; silver circle, kinase; black arrow, expression; red arrow, inhibition.

References

    1. Paton JC, Trappetti C. 2019. Streptococcus pneumoniae capsular polysaccharide. Microbiol Spectr 7:e0019-18. doi:10.1128/microbiolspec.GPP3-0019-2018. - DOI - PMC - PubMed
    1. Tzeng YL, Thomas J, Stephens DS. 2016. Regulation of capsule in Neisseria meningitidis. Crit Rev Microbiol 42:759–772. doi:10.3109/1040841X.2015.1022507. - DOI - PMC - PubMed
    1. Kalscheuer R, Palacios A, Anso I, Cifuente J, Anguita J, Jacobs WR, Jr, Guerin ME, Prados-Rosales R. 2019. The Mycobacterium tuberculosis capsule: a cell structure with key implications in pathogenesis. Biochem J 476:1995–2016. doi:10.1042/BCJ20190324. - DOI - PMC - PubMed
    1. O’Meara TR, Alspaugh JA. 2012. The Cryptococcus neoformans capsule: a sword and a shield. Clin Microbiol Rev 25:387–408. doi:10.1128/CMR.00001-12. - DOI - PMC - PubMed
    1. Zaragoza O, Rodrigues ML, De Jesus M, Frases S, Dadachova E, Casadevall A. 2009. The capsule of the fungal pathogen Cryptococcus neoformans. Adv Appl Microbiol 68:133–216. doi:10.1016/S0065-2164(09)01204-0. - DOI - PMC - PubMed

Publication types

MeSH terms