. 2022 Dec 1;132(23):e159800.
doi: 10.1172/JCI159800.

Macrophage depletion blocks congenital SARM1-dependent neuropathy

Affiliations

Macrophage depletion blocks congenital SARM1-dependent neuropathy

Caitlin B Dingwall et al. J Clin Invest. .

Abstract

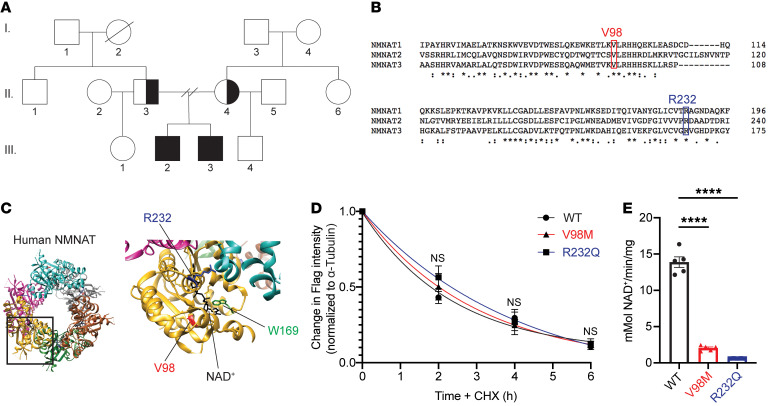
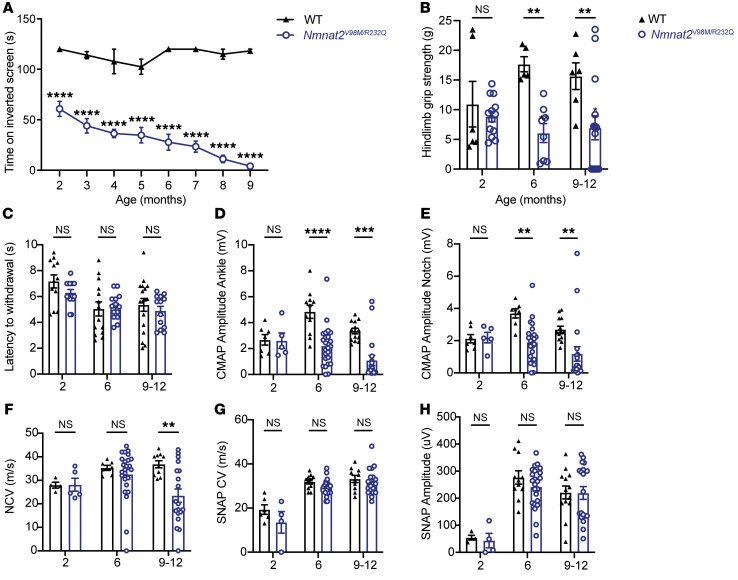
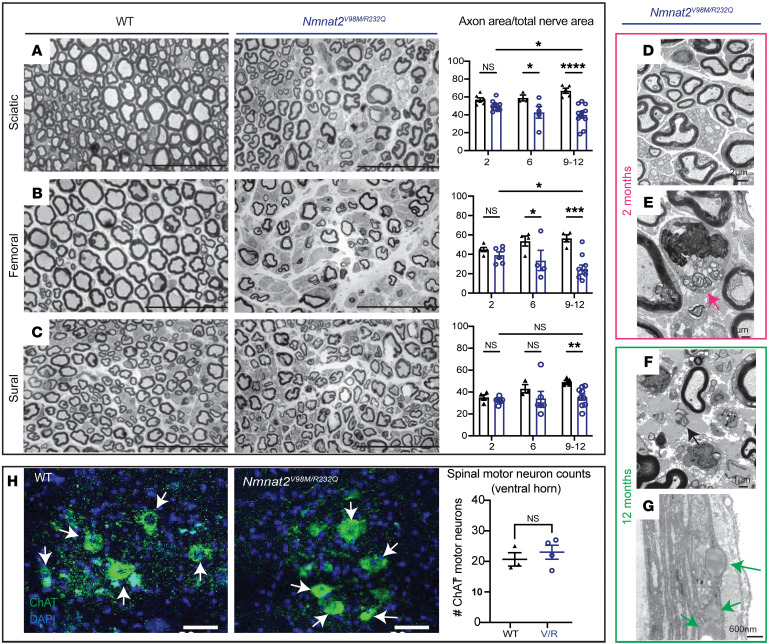
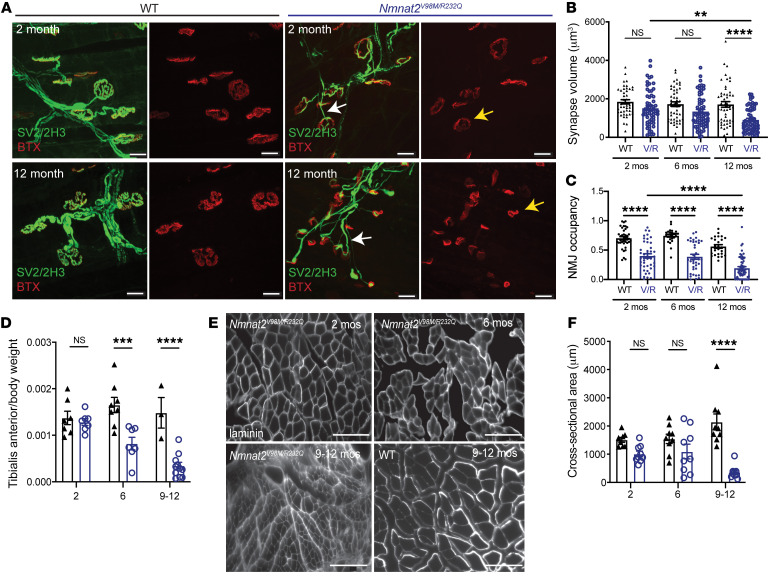
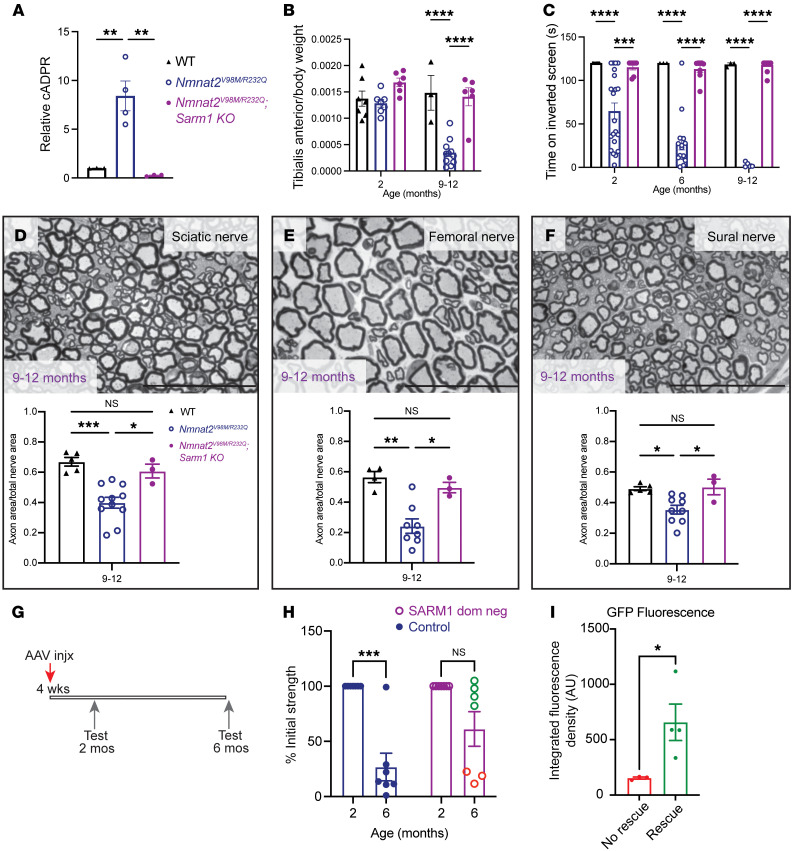
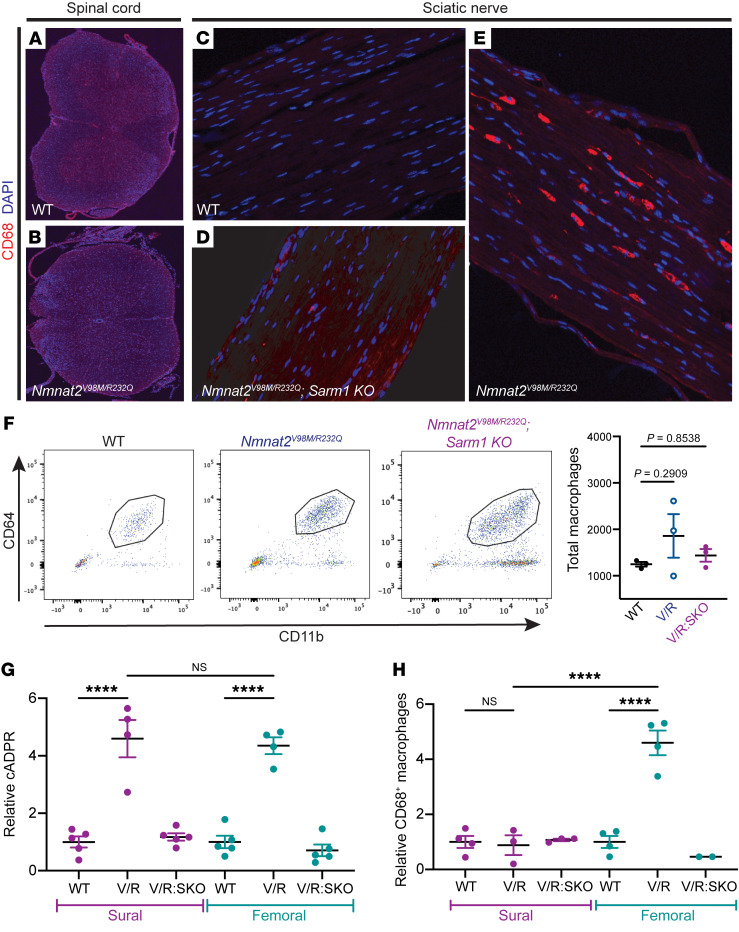
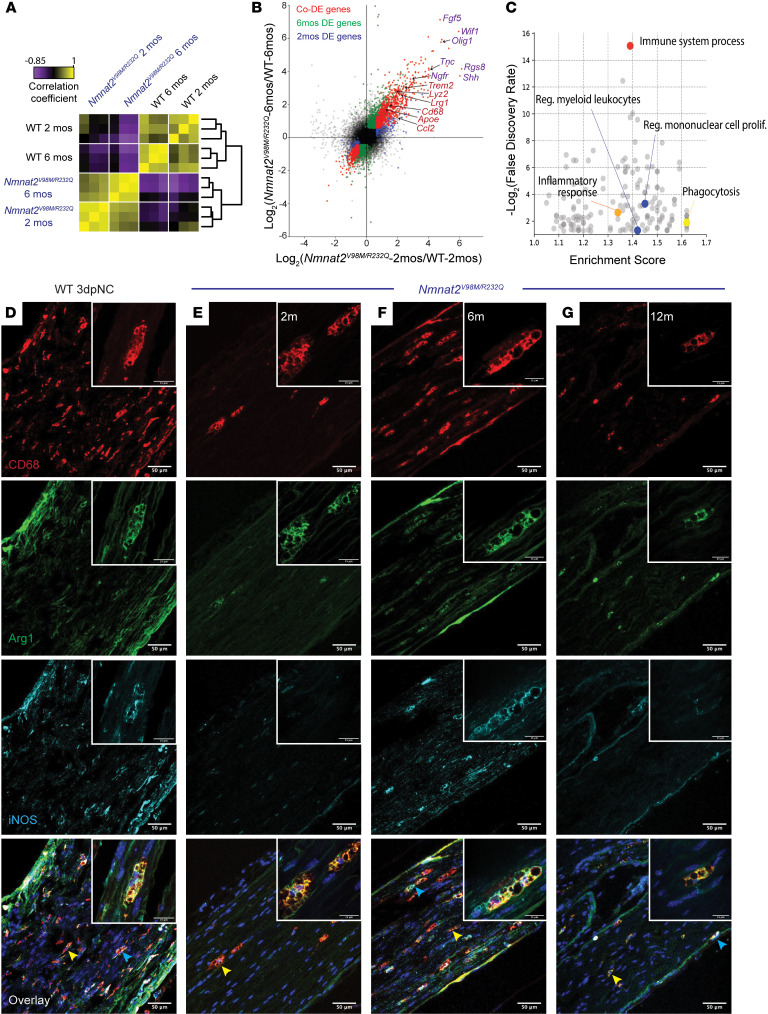
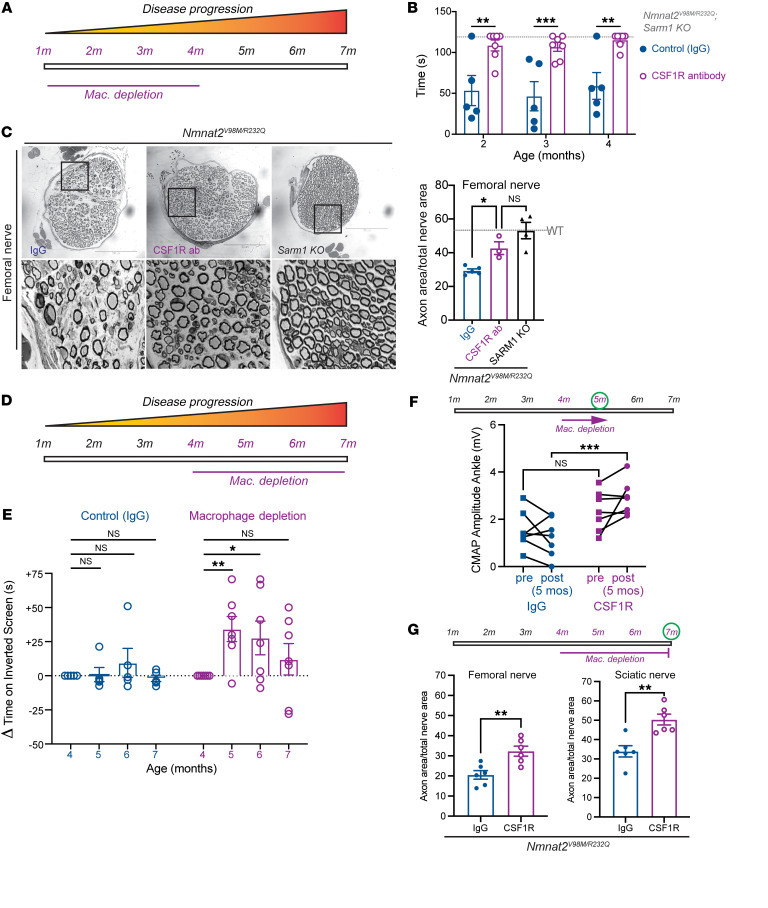
Axon loss contributes to many common neurodegenerative disorders. In healthy axons, the axon survival factor NMNAT2 inhibits SARM1, the central executioner of programmed axon degeneration. We identified 2 rare NMNAT2 missense variants in 2 brothers afflicted with a progressive neuropathy syndrome. The polymorphisms resulted in amino acid substitutions V98M and R232Q, which reduced NMNAT2 NAD+-synthetase activity. We generated a mouse model to mirror the human syndrome and found that Nmnat2V98M/R232Q compound-heterozygous CRISPR mice survived to adulthood but developed progressive motor dysfunction, peripheral axon loss, and macrophage infiltration. These disease phenotypes were all SARM1-dependent. Remarkably, macrophage depletion therapy blocked and reversed neuropathic phenotypes in Nmnat2V98M/R232Q mice, identifying a SARM1-dependent neuroimmune mechanism as a key driver of disease pathogenesis. These findings demonstrate that SARM1 induced inflammatory neuropathy and highlight the potential of immune therapy as a treatment for this rare syndrome and other neurodegenerative conditions associated with NMNAT2 loss and SARM1 activation.

Keywords: Macrophages; Mouse models; Neurodegeneration; Neuroscience.


Conflict of interest statement

Conflict of interest: AD and JM are cofounders, scientific advisory board members, and shareholders of Disarm Therapeutics, a wholly owned subsidiary of Eli Lilly. AJB and YS are consultants for Disarm Therapeutics.

Figures

Figure 1
Figure 1. Identification of compound heterozygous NMNAT2 variants in 2 brothers with relapsing-remitting neuropathy.
(A) Both brothers carry 2 extremely rare missense mutations in the NMNAT2 gene (c.292G>A. c.695G>A), each inherited from 1 of their parents. Half-shaded represents heterozygous, unaffected. Fully-shaded represents compound heterozygous, affected. (B) V98 and R232 residues are conserved in all 3 human NMNAT isoforms. (C) Schematic of NMNAT structure. Patients’ missense variants noted in red (V98) and blue (R232). W169 (green) is the catalytic residue. (D) Relative turnover rates for Flag-NMNAT2 (WT, V98M, R232Q) after cycloheximide (CHX) addition. 1-phase decay curves were fitted to the data using nonlinear regression. (E) NMNAT activity assay. NAD+ production at steady state (10 minutes) was used to calculate the NMNAT activity. All data are presented as mean ± SEM from n = 5 independent experiments. Statistical significance determined by 2-way ANOVA with multiple comparisons. ****P < 0.0001.
Figure 2
Figure 2. Nmnat2V98M/R232Q mice have behavioral and electrophysiologic features consistent with a motor neuropathy.
(A) Average time suspended from an inverted screen (max. 120 seconds) for WT (n = 3–7) or Nmnat2V98M/R232Q (n = 3–21) mice. (B) Hindlimb grip strength for WT (n = 5–6) or Nmnat2V98M/R232Q (n = 8–15) male mice at 2, 6, and 9–12 months. (C) Average time it takes for WT (n = 12–17) or Nmnat2V98M/R232Q (n = 13–15) mice to remove their tails from a 55°C hot water bath at 2, 6, and 9–12 months. (D and E) CMAP amplitude of WT (n = 7–13) and Nmnat2V98M/R232Q (n = 5–25) mice at the ankle (D) and sciatic notch (E) at 2, 6, and 9–12 months. (F) NCV (m/s) of sciatic nerves of WT (n = 4–10) or Nmnat2V98M/R232Q (n = 5–25) mice at 2, 6, and 9–12 months (G) SNAP CV (m/s) of sciatic nerves of WT (n = 6–11) or Nmnat2V98M/R232Q (n = 4–24) mice at 2, 6, and 9–12 months. (H) SNAP amplitude (μV) of sciatic nerves of WT (n = 6–11) and Nmnat2V98M/R232Q (n = 4–24) mice at 2, 6, and 9–12 months. All data are presented as mean ± SEM. Statistical significance determined by 2-way ANOVA with multiple comparisons. **P < 0.01, ***P < 0.001, ****P < 0.0001.
Figure 3
Figure 3. Nmnat2 variants cause progressive axon loss in mice.
(AC) Representative images of sciatic (A), femoral (B), and sural (C) nerves in 9–12-month-old Nmnat2V98M/R232Q (n = 9) or WT (n = 5) mice. Percent axonal area/total nerve area are indicated to the right (n = 4–11 mice per age cohort, per genotype). Scale bars: 50 μm. (D) Nmnat2V98M/R232Q sciatic nerve (2 months): dense population of large and small myelinated axons with little intervening extracellular space. (E) Nmnat2V98M/R232Q sciatic nerve (2 months): macrophage containing axonal and myelin debris in the endoneurial. (F) Nmnat2V98M/R232Q sciatic nerve (12 months): patches of marked axon loss with increased collagen and wispy processes of SC. Scattered macrophages with axonal and myelin debris were identified. (G) Nmnat2V98M/R232Q sciatic nerve (12 months): presence of large perineurial droplets of neutral fat. (H) Representative images of ChAT immunostaining in 12-month-old Nmnat2V98M/R232Q (n = 4) or WT (n = 3) spinal cord (ventral horn), scale bars: 50 μm. Quantification of number of ChAT+ motor neuron cell bodies in the ventral horn to the right. All data are presented as mean ± SEM. Statistical significance determined by Student’s unpaired, 2-tailed t test or 2-way ANOVA with multiple comparisons. *P < 0.05, **P < 0.01, ***P < 0.001, ****P < 0.0001.
Figure 4
Figure 4. Nmnat2 variants cause NMJ dysfunction and muscle wasting in mice.
(A) Representative images of 2- and-12 month-old mouse NMJs stained for synaptic vesicle 2/neurofilament (green) and bungarotoxin (red). Scale bars: 20 μm. (B) Synapse volume quantification for NMJs from WT (n = 44–62 synapses) and Nmnat2V98M/R232Q (V/R; n = 48–63 synapses) mice. (C) NMJ occupancy quantification for NMJs from WT (n = 25–43 synapses) and Nmnat2V98M/R232Q (n = 25–55 synapses) mice at 2, 6, and 12 months. (D) Average tibialis anterior weight/body weight for WT and Nmnat2V98M/R232Q mice at 2, 6, and 9–12 months (n = 3–11 mice per age cohort, per genotype). (E) Representative images of laminin immunofluorescence in Nmnat2V98M/R232Q mouse tibialis anterior muscles at 2, 6, and 9–12 months. WT mouse tibialis anterior muscle at 12 months shown for comparison. The apparent fuzziness shown in the representative image of Nmnat2V98M/R232Q 9–12-month-old mouse muscle was a consistent genotype-dependent finding reflecting diffuse laminin staining. (F) Quantification of muscle fiber cross-sectional area (n = 3 mice per genotype, per age cohort). Scale bars: 150 μm. All data are presented as mean ± SEM. Statistical significance determined by Student’s unpaired, 2-tailed t test or 2-way ANOVA with multiple comparisons. **P < 0.01, ***P < 0.001, ****P < 0.0001.
Figure 5
Figure 5. Neuronal SARM1 is required for Nmnat2V98M/R232Q neuropathy.
(A) Relative cADPR levels in sciatic nerves of 2-month-old WT (n = 3), Nmnat2V98M/R232Q (n = 4), and Nmnat2V98M/R232Q; Sarm1-KO (n = 3) mice. Values normalized to WT cADPR levels (set to 1). Statistical significance determined by a Student’s unpaired t test. (B) Average tibialis anterior weight by body weight for WT, Nmnat2V98M/R232Q, and Nmnat2V98M/R232Q; Sarm1-KO mice in 2- and 9–12-month-old mice (n = 3–11 mice per age cohort, per genotype). (C) Average time suspended from an inverted screen (max. 120 seconds) for WT (n = 3–7), Nmnat2V98M/R232Q (n = 3–21), and Nmnat2V98M/R232Q; Sarm1-KO (n = 7–13) mice. (DF) Representative images of sciatic (D), femoral (E), and sural (F) nerves in 9–12-month-old Nmnat2V98M/R232Q; Sarm1-KO mice. Scale bars: 50 μm. Percent axonal area/total nerve area is calculated below each corresponding nerve (n = 3–11 mice per age cohort, per genotype). Statistical significance was determined by 2-way ANOVA with multiple comparisons. (G) Schematic of AAV-SARM1-DN gene therapy experiment. (H) Percent initial performance on inverted screen test at 2 months and 6 months for EGFP (control) (n = 6) or SARM1-DN–injected (n = 7) Nmnat2V98M/R232Q mice. (I) Quantification of GFP fluorescence in the spinal cord of SARM1-DN injected Nmnat2V98M/R232Q mice, stratified by rescue (Rescue was determined as an endpoint performance (6m) greater than the mean control arm endpoint performance.) All data are presented as mean ± SEM. Statistical significance within treatment group was determined by a Student’s paired, 2-tailed t test. Statistical significance between treatment groups determined by a Student’s unpaired, 2-tailed t test.*P < 0.05, **P < 0.01, ***P < 0.001, ****P < 0.0001.
Figure 6
Figure 6. Activated macrophages accumulate in the peripheral nervous system of Nmnat2V98M/R232Q mice.
(AE) Representative images of CD68 immunofluorescence and DAPI signal in the spinal cord, original magnification, ×10 (A and B) and sciatic nerves, original magnification, ×20 (CE) of 2-month-old WT, Nmnat2V98M/R232Q, and Nmnat2V98M/R232Q; Sarm1-KO mice. (F) Representative scatter plots and quantification of fluorescence-activated cell sorting of total sciatic nerve macrophages (CD64+ CD11b+) in 2-month-old WT (n = 3), Nmnat2V98M/R232Q (n = 3), and Nmnat2V98M/R232Q; Sarm1-KO (n = 3) mice. (G) Relative cADPR levels in sural and femoral nerves of 4-month-old WT (n = 5), Nmnat2V98M/R232Q (n = 4), and Nmnat2V98M/R232Q; Sarm1-KO (n = 5) mice. Values normalized to WT cADPR levels (set to 1). (H) Relative levels of CD68+ macrophages in sural and femoral nerves of 4-month-old WT (n = 4), Nmnat2V98M/R232Q (n = 3-4) and Nmnat2V98M/R232Q; Sarm1-KO (n = 2-3) mice. Values normalized to WT CD68+ macrophage levels (set to 1). All data are presented as mean ± SEM. Statistical significance determined by 1-way ANOVA with multiple comparisons, ****P < 0.0001.
Figure 7
Figure 7. Macrophages are activated throughout disease and express markers of M1 and M2 polarization.
(A) Sample correlation plot showing global transcriptomic analysis and hierarchical clustering of sciatic nerve macrophages from WT and Nmnat2V98M/R232Q mice. Each box represents 1 replicate (n = 3). (B) Volcano plot of significant codifferentially expressed (DE) genes in sciatic nerves of 2 month and 6 month Nmnat2V98M/R232Q old mice, highlighting activated macrophage markers (red) and repair SC signatures (purple). (C) GO analysis of genes enriched in sciatic nerves of 6-month-old Nmnat2V98M/R232Q mice. (DG) Representative images of CD68, Arg1, and iNOS immunofluorescence in the sciatic nerves of (D) WT mice 3 days after nerve crush (3dpNC) and (EG) Nmnat2V98M/R232Q sciatic nerves at 2, 6, and 12 months. Scale bars: 50 μm, 15 μm (insets). Yellow arrows indicate Arg1/CD68 colocalization and blue arrows represent Arg1/iNOS/CD68 colocalization. Inset depicts a magnified image of a polarized macrophage. All data are presented as mean ± SEM. Statistical significance determined by 1-way ANOVA with multiple comparisons.
Figure 8
Figure 8. Macrophage depletion rescues motor defects and axon loss in Nmnat2V98M/R232Q mice.
(A) Schematic of CSF1R antibody-mediated macrophage depletion in young (beginning at 1-month-old) Nmnat2V98M/R232Q mice. (B) Average time suspended from an inverted screen (max. 120 seconds) for IgG control (n = 5) and CSF1R-treated Nmnat2V98M/R232Q (n = 7) mice. Statistical significance was determined by 2-way ANOVA with multiple comparisons. (C) Representative images of femoral nerve from IgG (control) (n = 5), CSF1R (n = 3), or Sarm1-KO Nmnat2V98M/R232Q (n = 4) mice at 4 months. Scale bars: 150 μm. Percent axonal area/total nerve area for femoral nerve calculated to the right. (D) Schematic of CSF1R antibody-mediated macrophage depletion in aged (beginning at 4-month-old Nmnat2V98M/R232Q mice. (E) Change in inverted screen time (s) from pre-treatment (4 months) measured at 5, 6, and months, comparing CSF1R treatment (n = 7) and IgG (control) (n = 5). Statistical significance was determined by 2-way ANOVA with multiple comparisons. (F) CMAP amplitude (ankle) of Nmnat2V98M/R232Q mice before and after 1 month of CSF1R treatment (n = 7) or IgG treatment (n = 5). (G) Percent axonal area/total nerve area for femoral nerve and sciatic nerve calculated at 7 months (3 months of macrophage depletion (n = 6) or treatment with isotype control IgG (n = 6). All data are presented as mean ± SEM. Statistical significance determined by Student’s unpaired t test. *P < 0.05, **P < 0.01, ***P < 0.001.

References

    1. Figley MD, DiAntonio A. The SARM1 axon degeneration pathway: control of the NAD+ metabolome regulates axon survival in health and disease. Curr Opin Neurobiol. 2020;63:59–66. doi: 10.1016/j.conb.2020.02.012. - DOI - PMC - PubMed
    1. Coleman MP, Höke A. Programmed axon degeneration: from mouse to mechanism to medicine. Nat Rev Neurosci. 2020;21(4):183–196. doi: 10.1038/s41583-020-0269-3. - DOI - PMC - PubMed
    1. Krauss R, et al. Axons matter: the promise of treating neurodegenerative disorders by targeting SARM1-mediated axonal degeneration. Trends Pharmacol Sci. 2020;41(4):281–293. doi: 10.1016/j.tips.2020.01.006. - DOI - PubMed
    1. Gerdts J, et al. SARM1 activation triggers axon degeneration locally via NAD + destruction. Science. 2015;348(453):453–458. - PMC - PubMed
    1. Osterloh JM, et al. dSarm/Sarm1 is required for activation of an injury-induced axon death pathway. Science. 2012;337(6093):481–484. doi: 10.1126/science.1223899. - DOI - PMC - PubMed

Publication types

Substances