. 2023 Mar;44(4):1389-1406.
doi: 10.1002/hbm.26123. Epub 2022 Oct 26.

Seeing and extrapolating motion trajectories share common informative activation patterns in primary visual cortex

Affiliations

Seeing and extrapolating motion trajectories share common informative activation patterns in primary visual cortex

Camila Silveira Agostino et al. Hum Brain Mapp. 2023 Mar.

Abstract

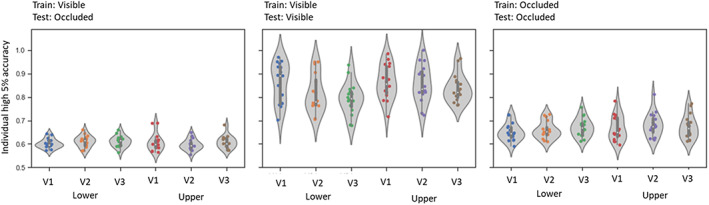
The natural environment is dynamic and moving objects become constantly occluded, engaging the brain in a challenging completion process to estimate where and when the object might reappear. Although motion extrapolation is critical in daily life-imagine crossing the street while an approaching car is occluded by a larger standing vehicle-its neural underpinnings are still not well understood. While the engagement of low-level visual cortex during dynamic occlusion has been postulated, most of the previous group-level fMRI-studies failed to find evidence for an involvement of low-level visual areas during occlusion. In this fMRI-study, we therefore used individually defined retinotopic maps and multivariate pattern analysis to characterize the neural basis of visible and occluded changes in motion direction in humans. To this end, participants learned velocity-direction change pairings (slow motion-upwards; fast motion-downwards or vice versa) during a training phase without occlusion and judged the change in stimulus direction, based on its velocity, during a following test phase with occlusion. We find that occluded motion direction can be predicted from the activity patterns during visible motion within low-level visual areas, supporting the notion of a mental representation of motion trajectory in these regions during occlusion.

Keywords: MVPA; V1; dynamic occlusion; fMRI; retinotopic mapping.


Conflict of interest statement

The authors declare no conflict of interest.

Figures

FIGURE 1
FIGURE 1
Display of the visual stimulation of the main experiment. (a) Visible phase: Sequence of two trials observed by the participants. A white dot moved from the left side of the screen to the Centre, then upwards or downwards as indicated by the arrows. The direction of the trajectory depended on the velocity of the dot here indicated by different types of line (solid and dashed). The full line represents fast movement and dashed line, slow movement. The lines are put here for illustrative purposes only, but were not displayed during the task. (b) Occluded phase: The horizontal trajectories remained visible while vertical trajectories were occluded by a grey rectangle present during the whole trial. The “X” marks represented the stimulus final positions presented in the visible phase. Participants judged when and at which position the stimulus would end using the velocity information during the visible horizontal movement. Trials of two conditions (up‐fast/down‐slow or vice versa) were presented in a randomised order on 1 day and the inverted pairings (down‐fast/up‐slow or vice versa) were presented on the second day. Order of pairings was counterbalanced across participants
FIGURE 2
FIGURE 2
Behavioural results: In all bar graphs (from left to right), light green bar (1st bar) depicts fast condition, darker green (2nd bar) slow condition in upward direction, light blue bar (3rd bar) depicts fast condition and dark blue bar (4th bar) slow condition in downward direction. Red dots superimposed on each bar represent behavioural results of all individual subjects. (a) Group average accuracy for spatial estimation. (b) Group average reaction times for temporal estimations. (c) Group average reaction times for temporal estimation error (difference between physical stimulus displacement time and estimated time)
FIGURE 3
FIGURE 3
Univariate results of an exemplary participant during (a) visible phase and (b) occluded phase, for contrast between upward (warm colours) vs. downward (cold colours) projected on the individual flat map. Retinotopic map delimitations are indicated by stars (central visual field), plus white and black full and dashed lines indicating borders between visual fields (Abdollahi et al., 2014)
FIGURE 4
FIGURE 4
Univariate beta weights (proportional to percent signal change) during visible phase (upper row) and occluded phase (lower row). Green bars depict average beta weights for downward trajectories, while purple bars average beta weights for upward trajectories. Stars indicate significance between conditions inside each region on interest
FIGURE 5
FIGURE 5
Decoding accuracies for all classification analyses in upper and lower V1–V3. Dashed line depicts the theoretical chance level, though note that the chance level used for statistical testing was derived from permutations tests. Purple bars show average accuracies for the classification analysis trained on visible data and tested on occluded data (train visible‐test occluded). Blue bars show the accuracies for the classification analysis with training and testing the visible phase only (train‐test visible only) and green bars depict average accuracies for the analysis using occluded data (train‐test occluded only) also during both training and testing
FIGURE 6
FIGURE 6
Violin plots of accuracy distribution. Average decoding accuracies of each participant are represented by the coloured dots, in each of the 6 ROIs. The left plot depicts the results of the classification analysis trained on visible data and tested on occluded data (train visible‐ test occluded), middle plot shows the classification analysis with training and testing on the visible phase data only and right plot depicts the analysis using occluded data also during both training and testing phases
FIGURE 7
FIGURE 7
Significant decoding accuracy maps projected onto retinotopic maps and derived visual field maps of one exemplary subject. Top: Visual fields of lower V1 and upper V1. Black curvatures and dots depict the localization of the vertices with significant accuracies for the visible‐occluded (train in visible and test in occluded phase) classification. Blue and red curvatures and dots represent the localization of the vertices with significant accuracies for the visible (train and test in visible phase) and occluded (train and test in occluded phase) classifications, respectively. Green lines and dots represent the same, but here results from the univariate functional localizer was used. Dots which spread to other quadrants could indicate scattered representations, but might be partly reflect the quality of retinotopic mapping itself. Bottom: Significant decoding accuracy maps overlaid on flattened anatomical maps of occipital cortex (right), the retinotopic eccentricity (middle) and polarity maps (left). This figure suggests that occluded motion prediction and visual motion perception) processes converge in similar parts of those low‐level visual areas of the brain which represent the motion trajectory

References

    1. Abdollahi, R. O. , Kolster, H. , Glasser, M. F. , Robinson, E. C. , Coalson, T. S. , Dierker, D. , Jenkinson, M. , Van Essen, D. C. , & Orban, G. A. (2014). Correspondences between retinotopic areas and myelin maps in human visual cortex. NeuroImage, 99(100), 509–524. 10.1016/j.neuroimage.2014.06.042 - DOI - PMC - PubMed
    1. Albers, A. M. , Kok, P. , Toni, I. , Dijkerman, H. C. , & de Lange, F. P. (2013). Shared representations for working memory and mental imagery in early visual cortex. Current Biology, 23(15), 1427–1431. - PubMed
    1. Alink, A. , Schwiedrzik, C. M. , Kohler, A. , Singer, W. , & Muckli, L. (2010). Stimulus predictability reduces responses in primary visual cortex. The Journal of Neuroscience: The Official Journal of the Society for Neuroscience, 30(8), 2960–2966. 10.1523/JNEUROSCI.3730-10.2010 - DOI - PMC - PubMed
    1. Amunts, K. , Malikovic, A. , Mohlberg, H. , Schormann, T. , & Zilles, K. (2000). Brodmann's areas 17 and 18 brought into stereotaxic space‐where and how variable? NeuroImage, 11(1), 66–84. 10.1006/nimg.1999.0516 - DOI - PubMed
    1. Anzellotti, S. , & Coutanche, M. N. (2018). Beyond functional connectivity: Investigating networks of multivariate representations. Trends in Cognitive Sciences, 22(3), 258–269. 10.1016/j.tics.2017.12.002 - DOI - PubMed

Publication types