. 2022 Oct 26;14(668):eabn5166.
doi: 10.1126/scitranslmed.abn5166. Epub 2022 Oct 26.

Clonal IgA and IgG autoantibodies from individuals at risk for rheumatoid arthritis identify an arthritogenic strain of Subdoligranulum

Affiliations

Clonal IgA and IgG autoantibodies from individuals at risk for rheumatoid arthritis identify an arthritogenic strain of Subdoligranulum

Meagan E Chriswell et al. Sci Transl Med. .

Abstract

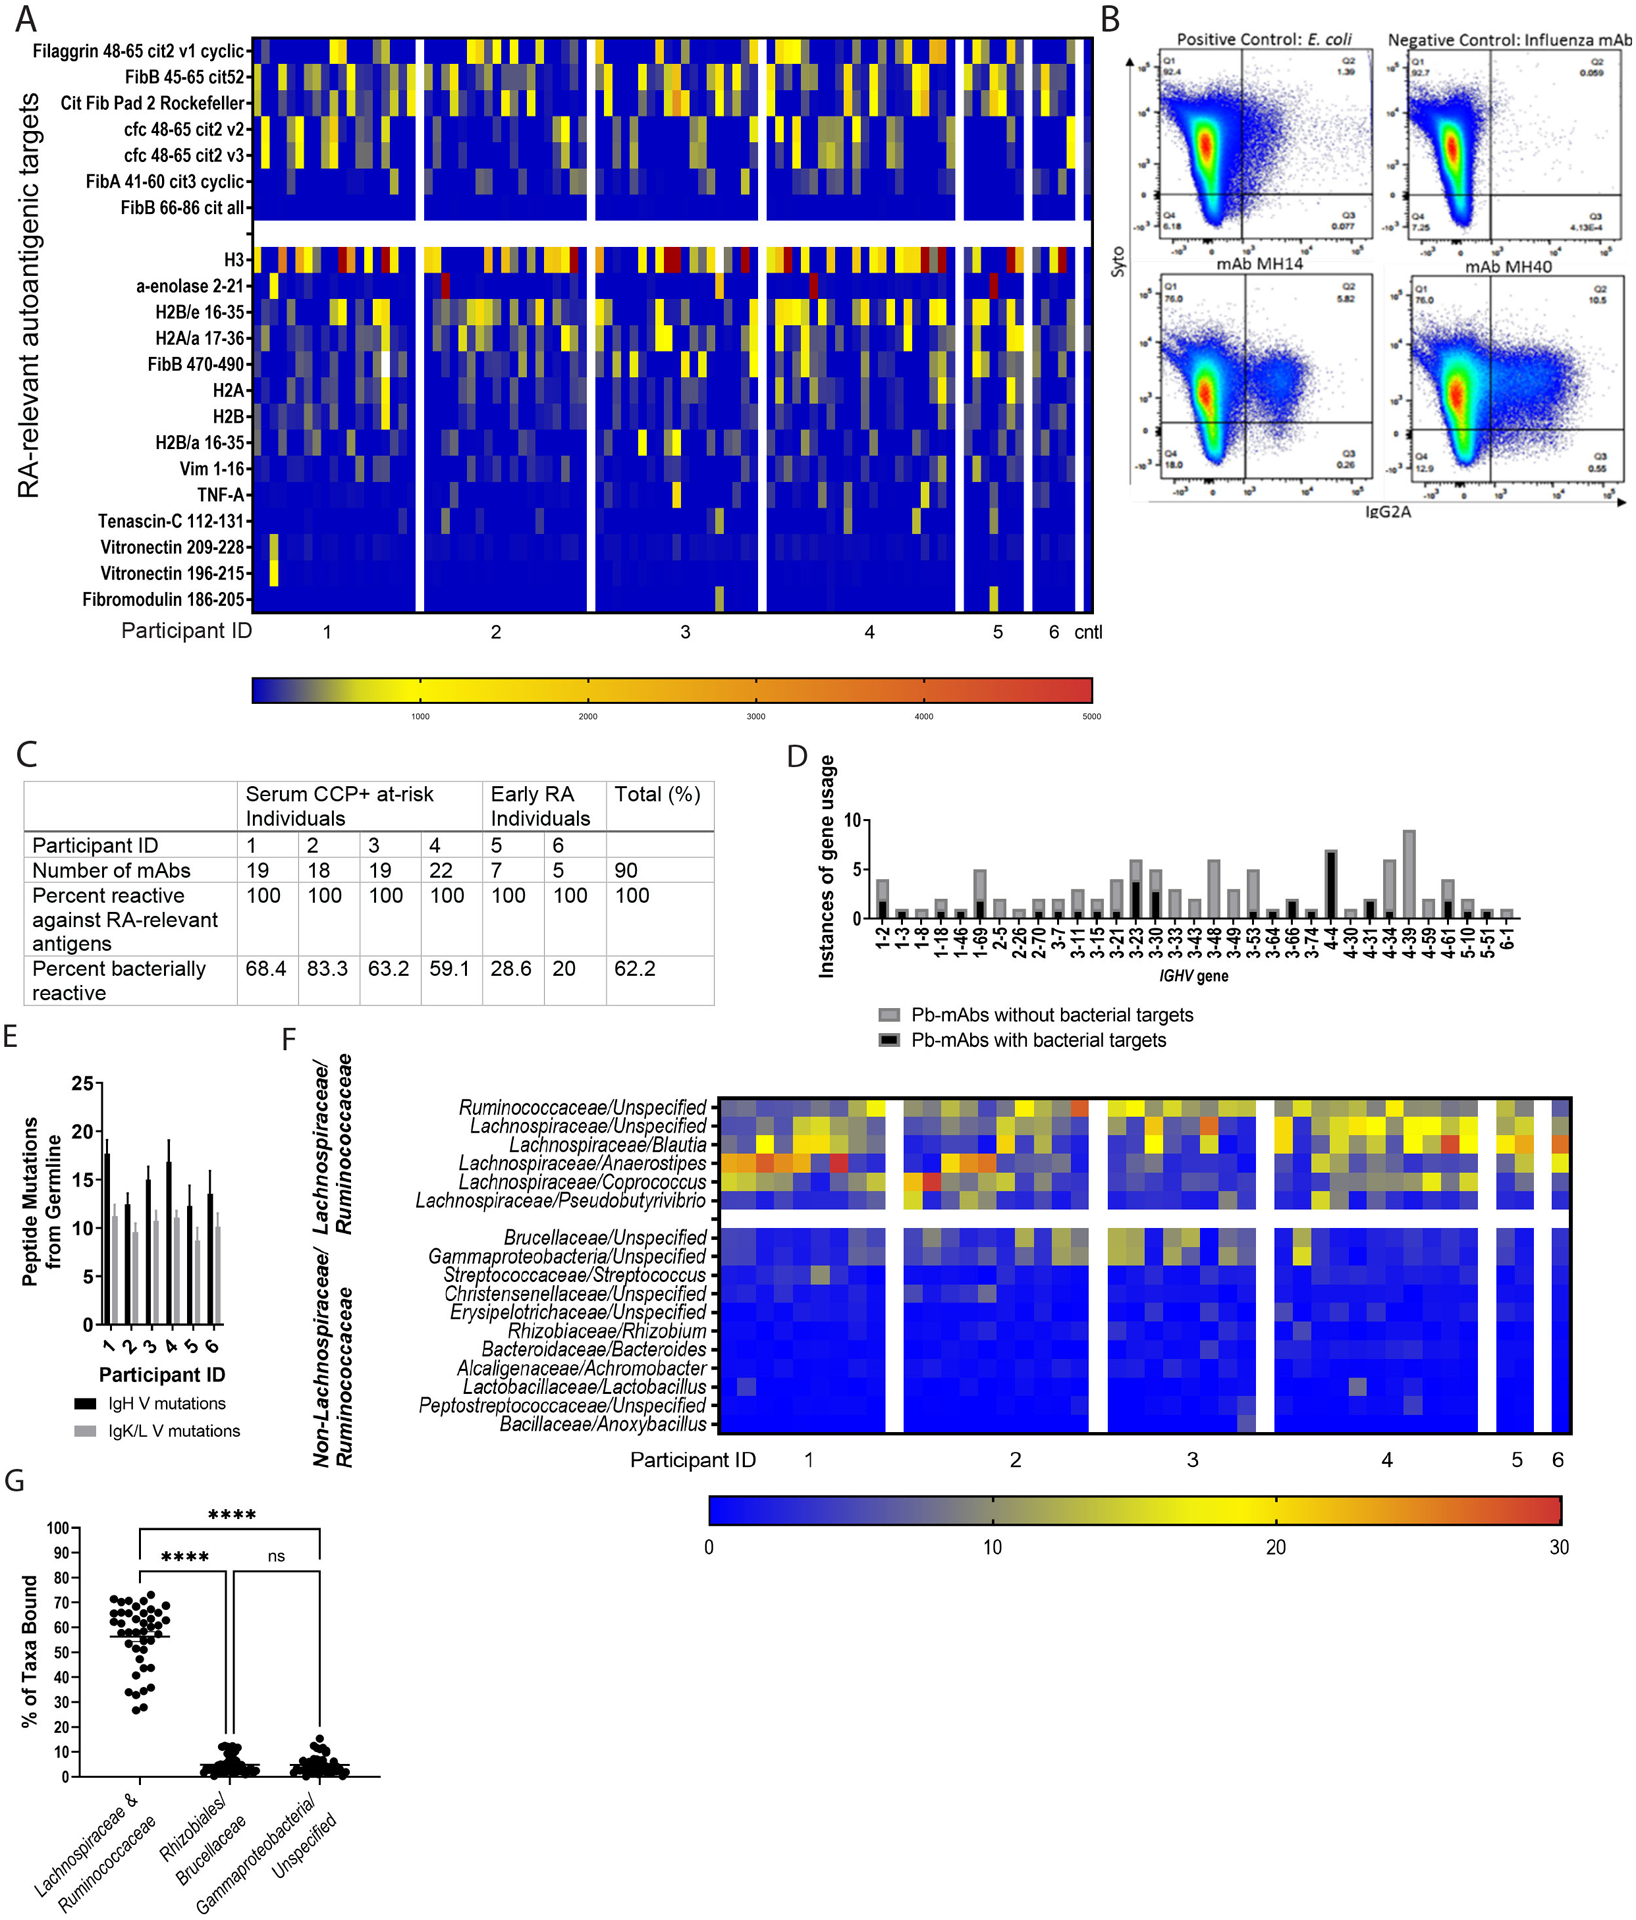
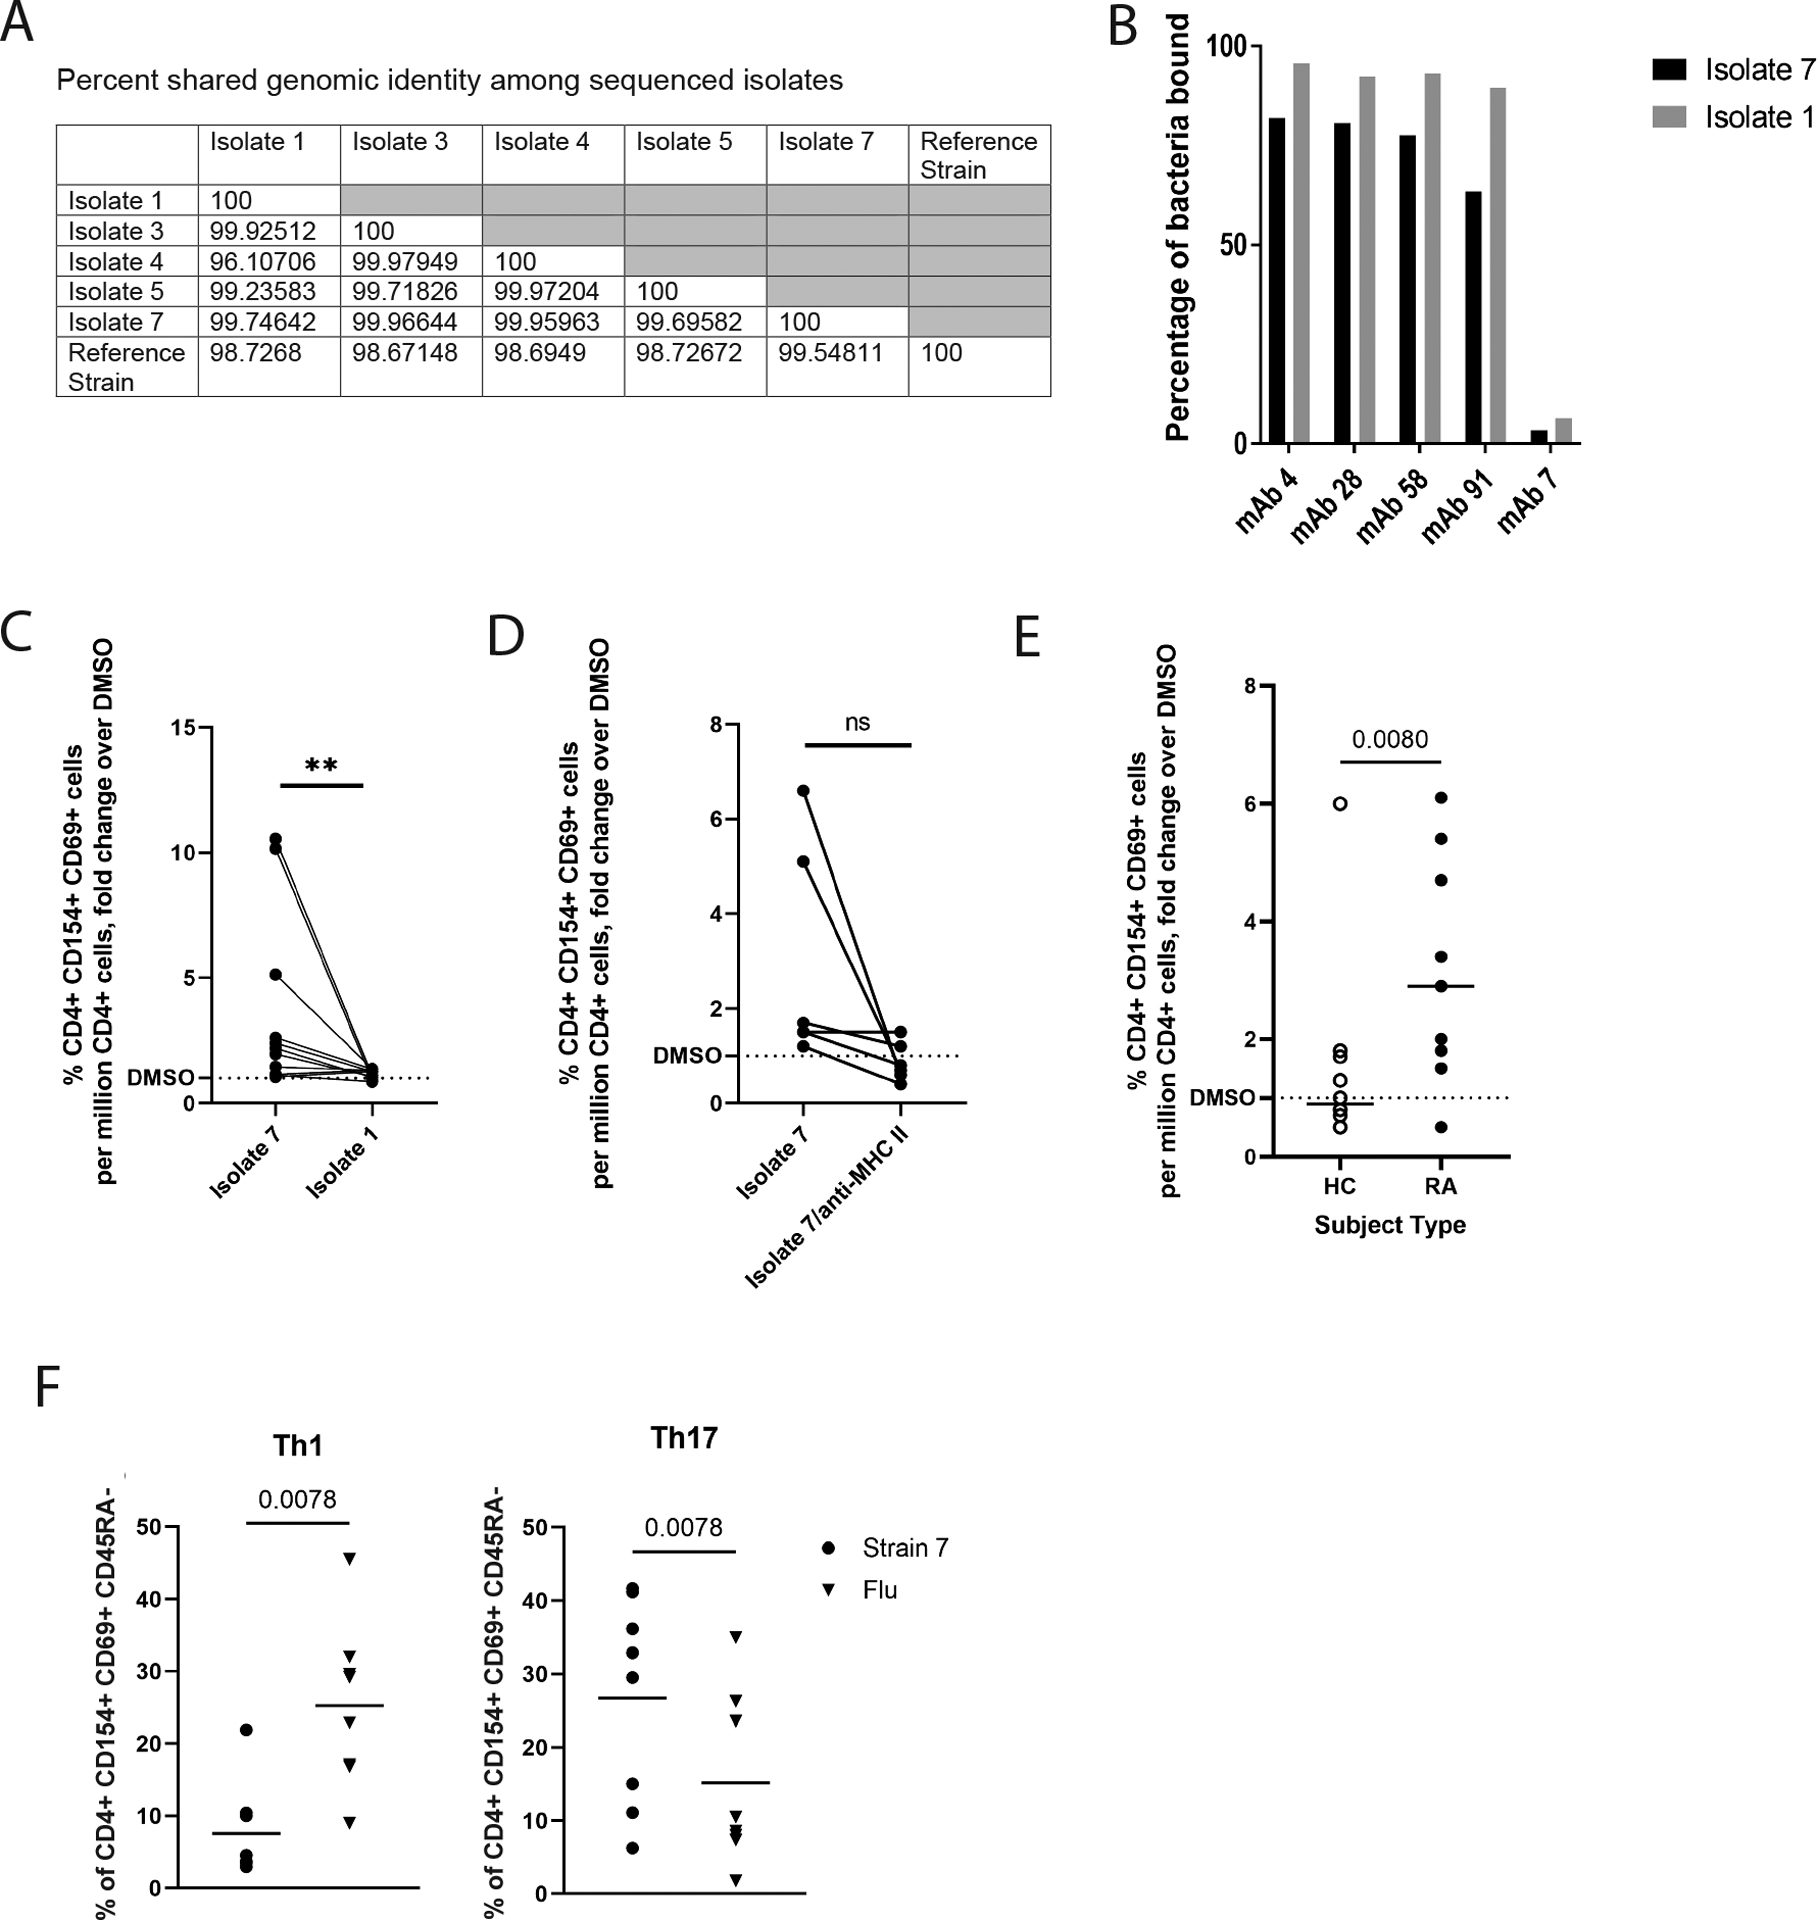
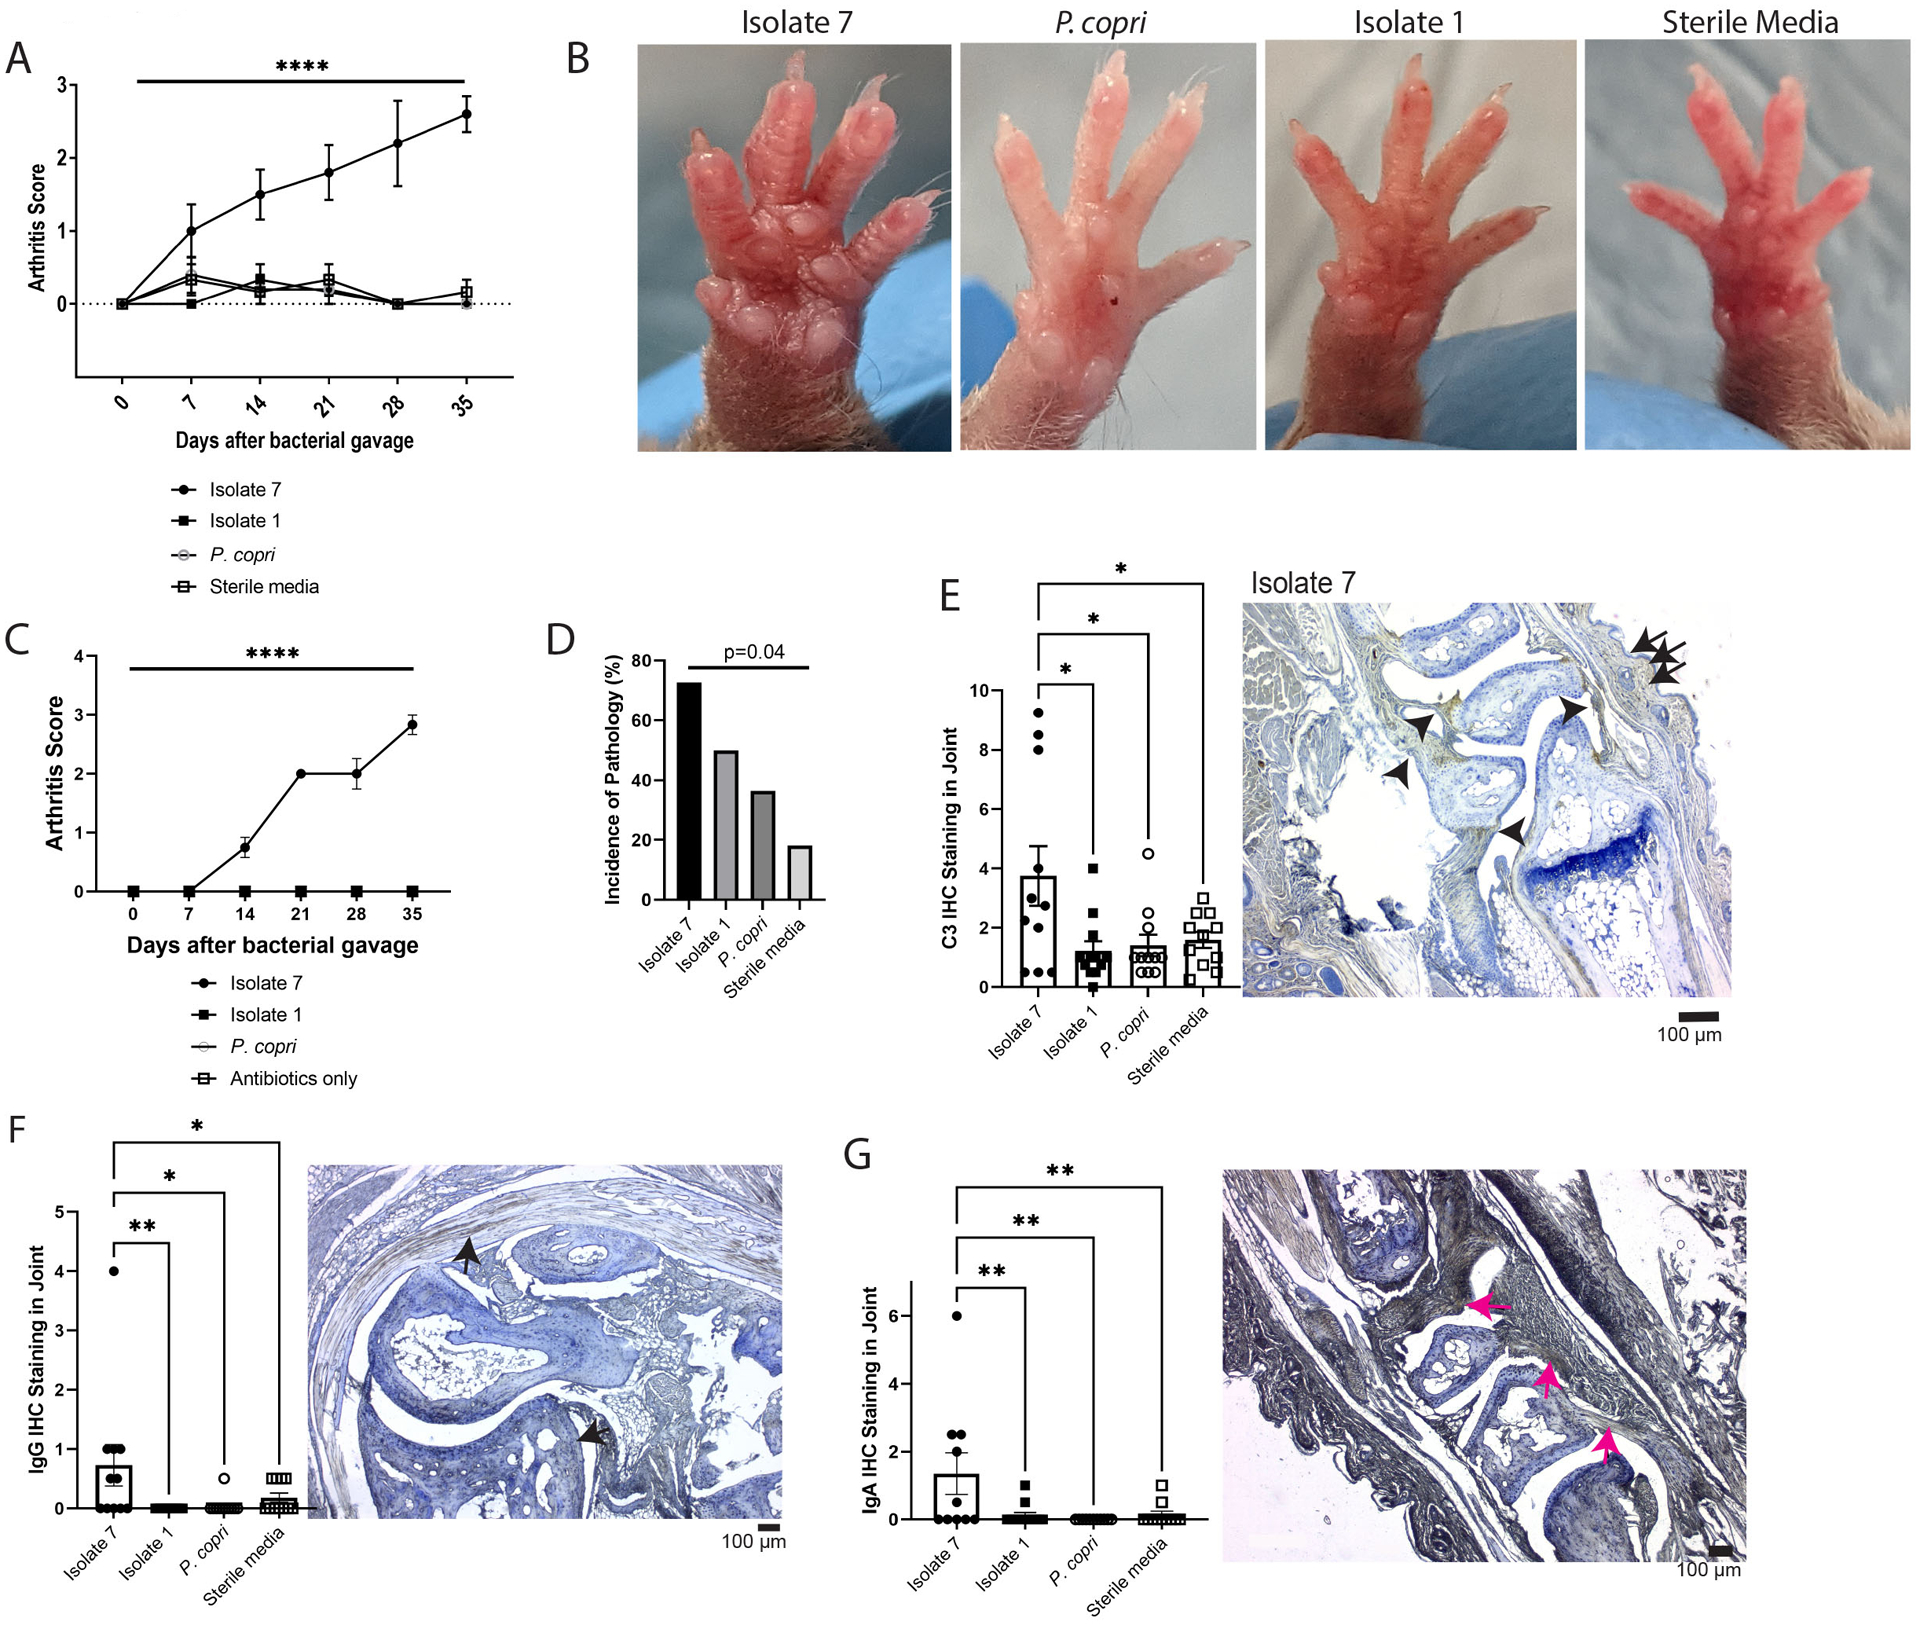
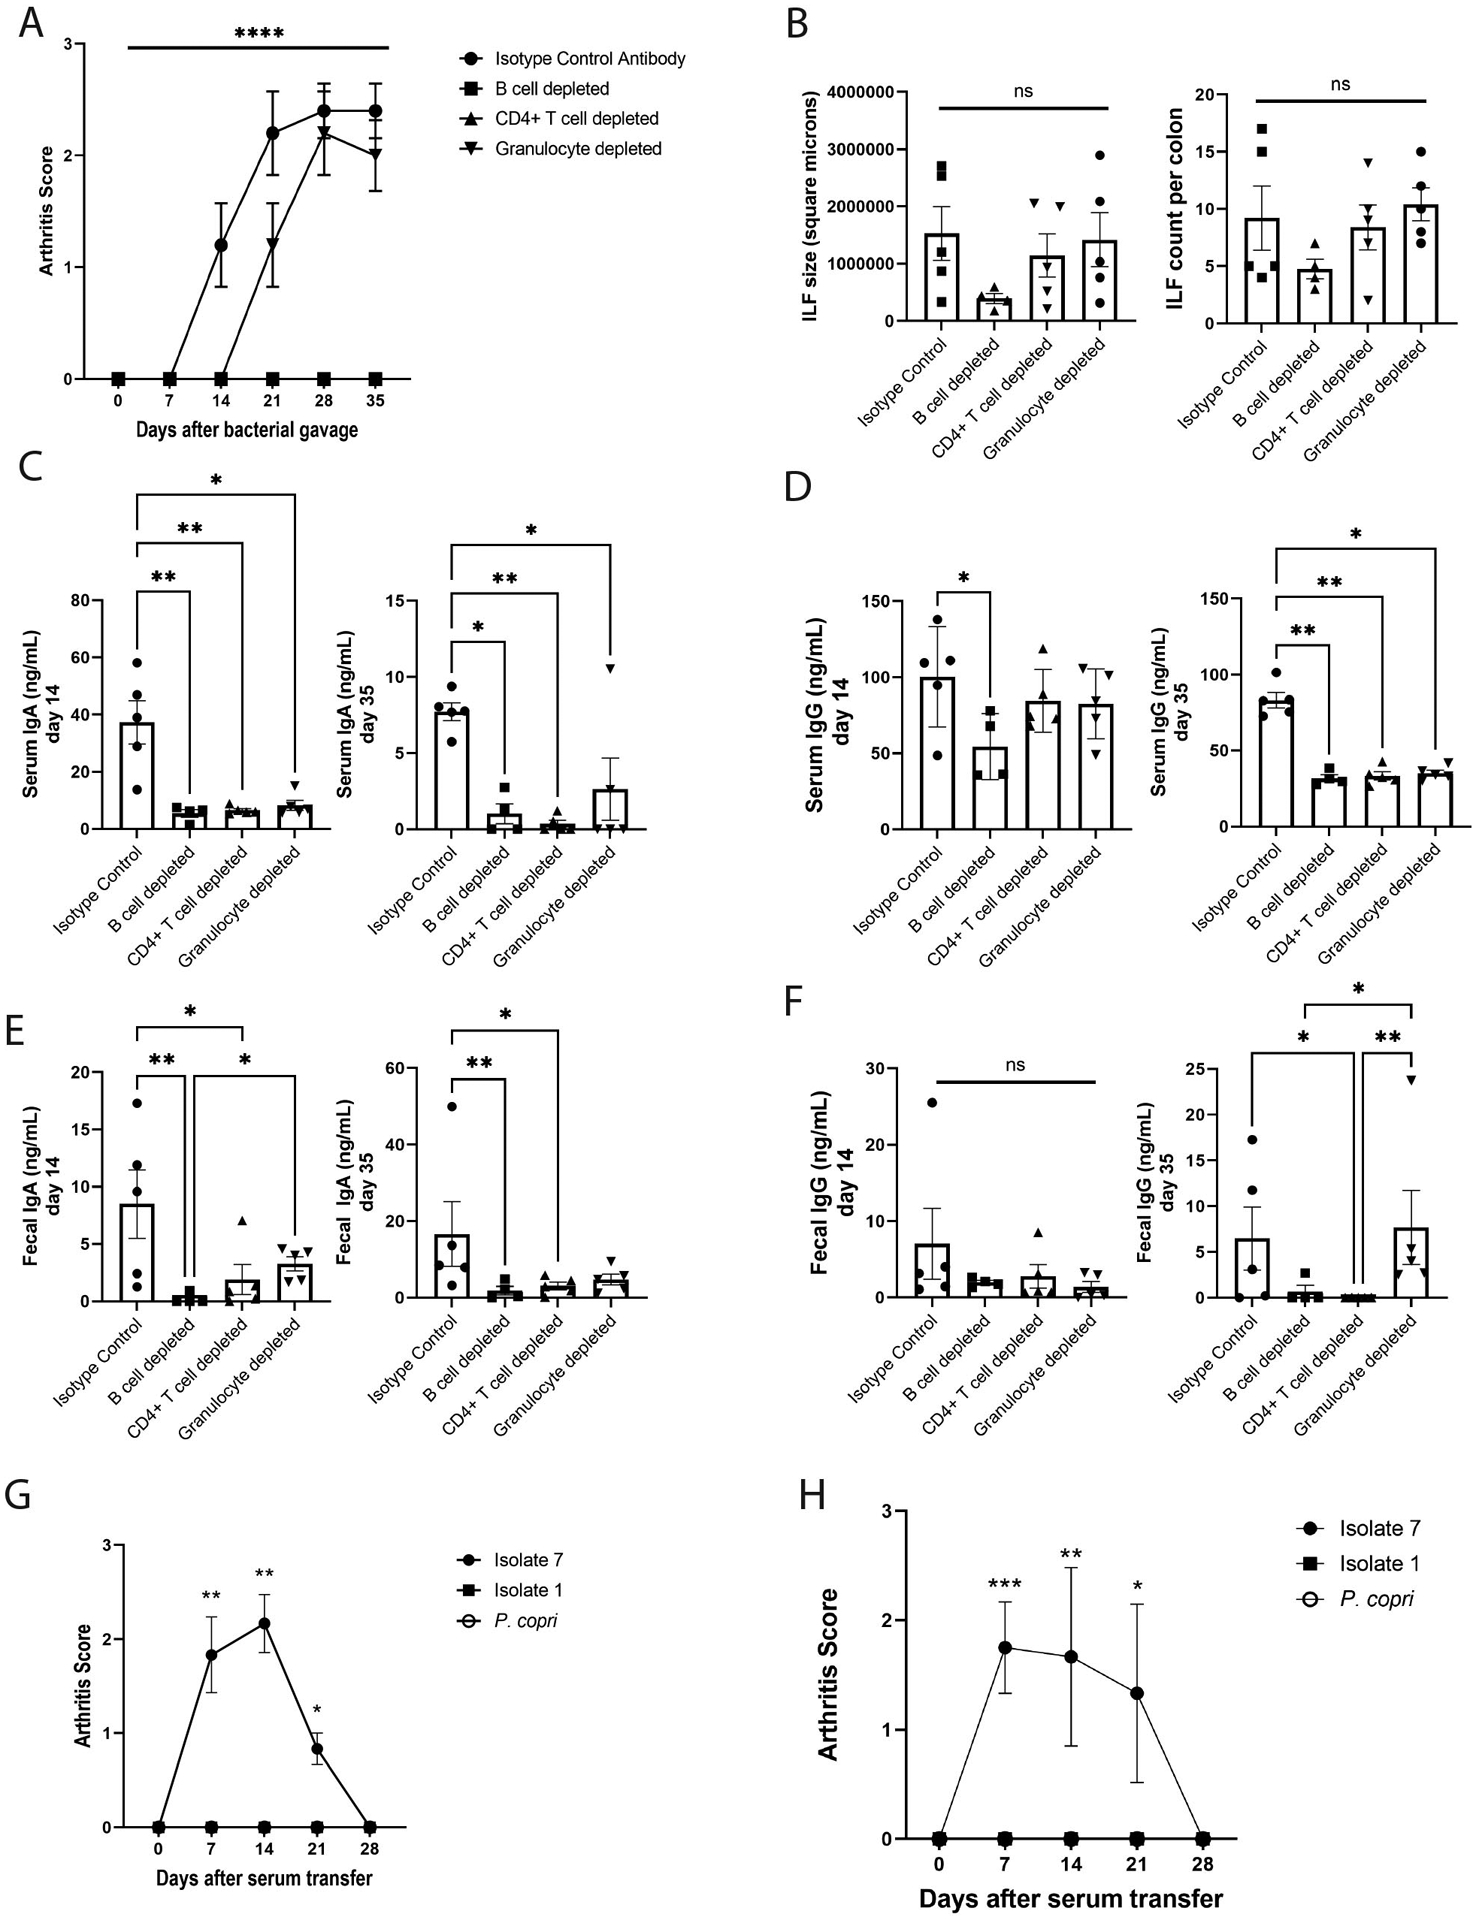
The mucosal origins hypothesis of rheumatoid arthritis (RA) proposes a central role for mucosal immune responses in the initiation or perpetuation of the systemic autoimmunity that occurs with disease. However, the connection between the mucosa and systemic autoimmunity in RA remains unclear. Using dual immunoglobulin A (IgA) and IgG family plasmablast-derived monoclonal autoantibodies obtained from peripheral blood of individuals at risk for RA, we identified cross-reactivity between RA-relevant autoantigens and bacterial taxa in the closely related families Lachnospiraceae and Ruminococcaceae. After generating bacterial isolates within the Lachnospiraceae/Ruminococcaceae genus Subdoligranulum from the feces of an individual, we confirmed monoclonal antibody binding and CD4+ T cell activation in individuals with RA compared to control individuals. In addition, when Subdoligranulum isolate 7 but not isolate 1 colonized germ-free mice, it stimulated TH17 cell expansion, serum RA-relevant IgG autoantibodies, and joint swelling reminiscent of early RA, with histopathology characterized by antibody deposition and complement activation. Systemic immune responses were likely due to mucosal invasion along with the generation of colon-isolated lymphoid follicles driving increased fecal and serum IgA by isolate 7, because B and CD4+ T cell depletion not only halted intestinal immune responses but also eliminated detectable clinical disease. In aggregate, these findings demonstrate a mechanism of RA pathogenesis through which a specific intestinal strain of bacteria can drive systemic autoantibody generation and joint-centered antibody deposition and immune activation.


Conflict of interest statement

Competing Interests: The authors have no conflicts of interests to declare.

Figures

Figure 1:
Figure 1:. A subset of dual IgA/IgG family plasmablast-derived monoclonal antibodies cross-react with RA-relevant antigens and predominantly bind families Lachnospiraceae and Ruminococcaceae.
(A) 94 plasmablast-derived mAbs (PB-mAbs) from at-risk (n=4) and early RA (n=2) individuals belonging to shared IgG and IgA clonal families were applied to a planar array containing 346 different citrullinated and native peptide targets. The heatmap demonstrates degree of reactivity between individual PB-mAbs (columns, x-axis) with specific antigens (rows, y-axis). Cntl, control. (B and C) These PB-mAbs were screened for cross-reactivity against a broadly representative pool of fecal bacteria created from feces from individuals with early RA (n=5), at-risk (n=8) and healthy controls (n=5). The fecal pool was exposed to each antibody and analyzed by flow cytometry. The samples that were greater than two standard deviations above background staining were considered to be positive for bacterial binding. (B) Representative flow plots demonstrating binding to Syto9Green (a nucleic acid stain, y-axis) and IgG2A-PE (representing mAb binding, x-axis) are shown. The top left displays binding to E. coli (positive control), the top right to an influenza mAb (negative control). The bottom two graphs are representative binding plots of two of the positive mAbs (14 and 40). (C) The table summarizes PB-mAb reactivity against RA-relevant antigens and bacteria, separated by individual. (D) PB-mAbs with and without bacterial targets were analyzed for IGHV gene usage. The count of mAbs expressing each IGHV gene is displayed (y-axis) against represented IGHV gene segments (x-axis). mAbs with bacterial targets are displayed in gray and mAbs without bacterial targets are displayed in black. (E) The amino acid mutations from germline (y-axis) are demonstrated for each individual (x-axis). The number of IgH V mutations are displayed in black and the number of IgL/K mutations are displayed in gray. (F) The mAb-bound bacterial fraction underwent 16S rRNA sequencing and taxonomic identification. The heatmap displays percentage of total bacteria bound represented by each taxa displayed; the top taxa bound for all mAbs are shown. Each mAb is shown (x-axis), segregated by the individual from whom it was derived. Bacteria are segregated by either belonging to families Lachnospiraceae or Ruminococcaceae (top of y-axis) or not belonging to either Lachnospiraceae or Ruminococcaceae (bottom of y-axis). (G) The three most bound taxa from each PB-mAb are represented out of the total bacteria bound (x-axis). The percent of total bacteria bound is quantified for each mAb (y-axis) and shown as round symbols for the individual mAbs and mean ± SEM as bars. P<0.0001; ns, not significant, by one-way ANOVA with Tukey’s post-test.
Figure 2:
Figure 2:. Ruminococcaceae Subdoligranulum strains isolated from a human sample are targeted by PB-mAbs and stimulate CD4+ T cells from patients with RA.
(A) Seven primary strains of Ruminococcaceae Subdoligranulum were isolated from the feces of an individual. Five isolates were selected for short read genome sequencing based on taxonomic identification by 16S rRNA sequencing. The table represents percent genomic shared identity among the 5 isolates as well as against a reference genome found to be genetically aligned (MGYG-HGUT02424; unidentified genus in Order Clostridiales, which includes Lachnospiraceae and Ruminococcaceae). (B) Isolates 1 and 7 were matched against four selected PB-mAbs (numbers 4, 28, 58, and 91) that bound highly to other various patterns of Ruminococcaceae and Lachnospiraceae species to verify that they targeted the strains. They were also matched against a control mAb (number 7) that was previously found to not bind bacteria. The percent of bacteria bound to mAb is displayed (y-axis) against each selected mAb (x-axis). Binding by isolate 7 is shown in black, and binding to isolate 1 is shown in gray. (C) Human peripheral blood mononuclear cells (PBMCs) from individuals with RA (n=11) were stimulated with 50ng/ml isolates 1 or 7. Fold change of the CD4+ T cell response relative to DMSO (horizontal dotted line) is displayed against binding to isolates 1 and 7 (x-axis). **P<0.01, non-parametric Wilcoxon matched-pairs signed rank test. (D) A Class II HLA-DR (clone L243) blocking antibody or an equal volume of phosphate-buffered saline was applied at 20μg/mL for 30 minutes prior to stimulation of PBMCs from individuals with RA (n=5) with isolate 7. Fold change of the CD4+ T cell response relative to DMSO (horizontal dotted line) is displayed against binding to isolate 7 versus isolate 7 blocked with L243 (x-axis). ns, not significant by non-parametric Wilcoxon matched-pairs signed rank test. (E) Isolate 7 specific responses among CD4+ T cells was tested comparing CD4+ T cells isolated from individuals with RA (n=11) to CD4+ T cells isolated from healthy controls (n=12). Fold change of the CD4+ T cell response relative to DMSO (y-axis) is displayed (x-axis). Data were analyzed using a nonparametric Mann-Whitney test. (F) Left: using CD45RA−/CXCR3+/CCR4−/CCR6− as a defining marker combination, we compared the relative proportion of Th1-like cells for Isolate 7-specific (circles) or influenza-specific (inverted triangles) memory CD4+ T cell responses in CD4+ T cells from individuals with RA, observing a higher proportion of Th1-like influenza specific cells (p=0.0078, nonparametric Mann-Whitney test). Right: using CD45RA-/CXCR3-/CCR4+/CCR6+ as a defining marker combination, we compared the relative proportion of Th17-like cells for Isolate 7-specific (circles) or influenza-specific (inverted triangles) memory CD4+ T cell responses, observing a significantly higher proportion of Th17-like isolate 7-specific cells (p=0.0078, nonparametric Mann-Whitney test). Horizontal bars indicate mean.
Figure 3:
Figure 3:. A specific Subdoligranulum strain stimulates joint swelling and inflammation in mono-colonized mice that is characterized by IgG, IgA, and complement C3 deposition in joints.
(A and B) Subdoligranulum isolates 1 and 7 as well as Prevotella copri or sterile media were gavaged separately into germ-free DBA/1 mice (n=6 isolate 1, n=6 isolate 7, n=5 P. copri, and n=6 sterile media). Mice were observed weekly for 35 days for the development of joint swelling and assessed a score based on the number of joints affected. (A) The mean ± SEM score is shown (y-axis) over time after bacterial gavage (x-axis). ****P<0.0001, repeated measures ANOVA. (B) Representative photographs of paws from the treatment groups are shown to demonstrate the swelling observed in mice mono-colonized with isolate 7. (C) SPF DBA/1j mice were treated with oral broad-spectrum antibiotics (neomycin, ampicillin, metronidazole, and vancomycin) for 5 days to deplete the microbiome. After antibiotic treatment, mice were gavaged with either Subdoligranulum isolates 1 and 7 or P. copri (n=6 isolate 7, n=6 isolate 1, n=6 P. copri, n=5 antibiotics only). Mice were observed weekly for 35 days for the development of joint swelling and assessed a score based on the number of joints affected. The mean ± SEM score is shown (y-axis) over time after bacterial gavage (x-axis). ****P<0.0001, repeated measures ANOVA. (D) Paw histology was assessed by a pathologist in a blinded fashion. Displayed is the incidence of pathology (y-axis) separated by treatment group (x-axis). Data were analyzed using Fisher’s exact test. (E) IHC for the C3 component of complement was performed on decalcified paw sections. C3 staining intensity scores are displayed (y-axis) separated by treatment group (x-axis). Symbols represent individual mice and bars indicate the mean ± SEM. *P<0.05, one-way ANOVA with Tukey’s post-test. A representative section for isolate 7 is displayed, with deposition indicated by arrows; the scale bar represents 100μm. (F) IgG deposition in decalcified paw sections was assessed by IHC. Intensity scores with symbols as individual mice and bars as mean ± SEM are displayed (y-axis), separated by treatment group (x-axis). *P≤0.05 and **P<0.01, one-way ANOVA with Tukey’s post-test. A representative section is displayed, with deposition indicated by arrows; the scale bar represents 100μm. (G) IgA deposition in decalcified paw sections was assessed by IHC and intensity scores are displayed (y-axis), separated by treatment group (x-axis). Symbols represent individual mice and bars indicate the mean ± SEM. **P≤0.01, one-way ANOVA with Tukey’s post-test. A representative section is displayed, with deposition indicated by arrows; the scale bar represents 100μm. Data are from n=12 isolate 1-gavaged, n=11 isolate 7-gavaged, n=11 P. copri-gavaged, and n=11 sterile media-gavaged animals across two experiments.
Figure 4:
Figure 4:. Subdoligranulum isolate 7 causes development of increased serum IgA, systemic RA-related autoantibodies, and expanded splenic Th17 populations.
(A to C) Serum from mice mono-colonized with either isolate 1 (n=12), isolate 7 (n=12), or P. copri (n=10), or given sterile media (n=10) was collected at days 14 and 35 after gavage. (A) The total serum IgA at 14 days after gavage was determined by ELISA; serum IgA is displayed (y-axis) against treatment group (x-axis). Symbols represent individual mice and bars indicate the mean ± SEM. *P<0.05 and ****P<0.0001, Kruskal-Wallis test with Dunn’s post-test. (B) Serum was analyzed on a planar array containing about 350 citrullinated and native peptides for autoantigens relevant in RA. A cutoff for positivity was established at the 80th percentile of autoantibody reactivity for individual samples on this assay (1.5 relative units) and the proportion of murine samples meeting or exceeding this threshold (11 antigens as displayed) at each timepoint is shown (y-axis). Each treatment group is shown from left to right. (C) Mean ± SD values for serum reactivity from each treatment group with specific RA-relevant autoantigens shown in panel (B) are shown in the table, comparing the four groups. P-values were determined by Kruskal-Wallis test with Dunn’s post-test. (D) Serum was analyzed at days 14 and 35 after bacterial gavage for the presence of murine collagen type II (CII) autoantibodies by ELISA. Mean ± SEM relative values are shown (y-axis) comparing groups (x-axis), including mice with collagen-induced arthritis (CIA). *P<0.05, **P<0.01 by Kruskal-Wallis test with Dunn’s post-test. n=6 CIA mice, n=6 isolate 7-gavaged mice, n=6 isolate 1-gavaged mice, n=6 P. copri-gavaged mice, n=6 sterile media-gavaged mice. (E) Spleens were collected from each mouse at 35 days post gavage and CD4+ T cell populations were analyzed by flow cytometry (n=7 isolate 7, n=7 isolate 1, n=6 P. copri, n=8 sterile media). The percentage (left) and absolute number (middle) of Roryt+ Th17 cells, as well as the Th17 to Treg ratio (right) is displayed. Symbols represent individual mice and bars indicate the mean ± SEM. *P<0.05 and **P<0.01 using Kruskal-Wallis test with Dunn’s post-test. (F and G) Splenocytes were collected from mice gavaged with Subdoligranulum isolate 1 or isolate 7 at 35 days after gavage and CD4+ T cells were isolated. CD4+ T cells were cocultured with bone marrow dendritic cells (BMDCs) loaded with either isolate 1, isolate 7, or no bacterial antigen for 14 hours. (F) The percentage of CD154+ CD69+ CD4+ cells is shown (y-axis) compared by treatment group (x-axis). (G) The percentage of Rorγt+ CD4+ T cells is shown (y-axis) compared by treatment group (x-axis). *P<0.05, **P<0.01 using Kruskal-Wallis test with Dunn’s post-test. n=6 isolate 7-gavaged mice, n=6 isolate 1-gavaged mice. The CD4+ T cell stimulation assay was performed in technical triplicate for each mouse and condition in vitro.
Figure 5:
Figure 5:. Subdoligranulum isolate 7 promotes development of intestinal isolated lymphoid follicles, increased mucosal IgA, and Th17 skewing in mucosal lymphoid tissues.
(A) FITC-Dextran was orally gavaged into mice mono-colonized with isolate 1 (n=5), isolate 7 (n=7), P. copri (n=6) or sterile media (n=6) 4 hours before euthanasia. At the time of euthanasia, serum was collected and tested for the presence of FITC-Dextran. Concentration of serum FITC-dextran is displayed (y=axis) against each treatment group (x-axis). Symbols represent individual mice and bars indicate the mean ± SEM.*P<0.05, one-way ANOVA with Tukey’s post-test. (B and C) Colon histology from each group was analyzed. (B) The number (left) and size in area (right) of isolated lymphoid follicles (ILFs) per colon (y-axis) separated by treatment group (x-axis) is shown. Symbols represent individual mice and bars indicate the mean ± SEM. *P<0.05, one-way ANOVA with Tukey’s post-test. (C) Representative colon histology containing ILFs in each group are shown. Scale bars represent 100μm. (D) Feces from mono-colonized mice at day 14 after gavage were tested for total IgA by ELISA (n=11 isolate 7-gavaged, n=12 isolate 1-gavaged, n=6 P. copri-gavaged, n=12 sterile media-gavaged). Symbols represent individual mice and bars indicate the mean ± SEM. *P<0.05; ****P<0.0001; and ns, not significant by Kruskal-Wallis test with Dunn’s post-test. (E) Representative colon immunofluorescence containing an ILF in an isolate 7-gavaged mouse is shown at 200x magnification. In red is IgA staining, in green is B220 staining, and in blue is DAPI. The arrows point to representative B220+ IgA+ B cells. (F) Mesenteric lymph nodes (MLNs) and Peyer’s patches (PPs) were evaluated at 14 days post-gavage for Th17 and activated Treg subpopulations by flow cytometry (n=7 isolate 7-gavaged, n=7 isolate 1-gavaged, n=7 P. copri-gavaged, n=8 sterile media-gavaged). The ratio of Th17:Treg cells is displayed with individual mice shown as symbols and bars indicate the mean ± SEM.. *P<0.05by Kruskal-Wallis test with Dunn’s post-test. (G and H) Bacterial presence in the host colonic epithelium was evaluated by fluorescence in situ hybridization (FISH) at 35 days post-gavage. (G) The total amount of bacteria in the epithelium across 10 fields of view is shown (y-axis), compared to treatment group (x-axis). *P<0.05, **P<0.01, ***P<0.001 by Kruskal-Wallis test with Dunn’s post-test (n=6 isolate 7-gavaged mice, n=5 isolate 1-gavaged mice, n=5 P. copri-gavaged mice, n=6 sterile media-gavaged mice). (H) Representative colon FISH images are shown at 200x magnification demonstrating bacteria (red, arrows), host mucus (green) and nuclei (blue) for each group. Dotted white lines highlight the mucosal layer as well as the colonic crypts in each image.
Figure 6:
Figure 6:. Joint swelling is dependent on T and B cells but not granulocytes.
(A) Mice were selectively depleted of their B cells (n=4), CD4+ T cells (n=5), or granulocytes (n=5) through administration of depleting mAbs (n=5 isotype control). Joint swelling was assessed as previously and the mean ± SEM score (y-axis) is shown over time (x-axis). ****P<0.0001 by repeated measures ANOVA. (B) ILF area in square microns (left) and numbers (right) was assessed in colon histology from isotype control and cell-depleted mice at day 35 after bacterial gavage. Symbols represent individual mice and bars indicate the mean ± SEM. P-values were determined by one-way ANOVA with Tukey’s post-test; ns, not significant. (C to F) Total IgA and IgG in serum (C and D) and feces (E and F) at days 14 and 35 post-bacterial gavage were determined by ELISA. Symbols represent individual mice and bars indicate the mean ± SEM. *P<0.05; **P<0.01; and ns, not significant as determined by Kruskal-Wallis test with Dunn’s post-test. (G and H) Pooled day 35 serum from mice mono-colonized with isolate 1, isolate 7, and P. copri was injected into healthy germ-free DBA/1 mice or SPF DBA/1j mice, and these mice were monitored for the development of joint swelling. (G) The mean clinical score ± SEM (n=6 isolate 7 serum transfer, n=6 isolate 1 serum transfer, n=7 P. copri serum transfer) is shown relative to time after-serum transfer (x-axis) for germ-free mice. *P<0.05; **P<0.01, Kruskal-Wallis test with Dunn’s post-test. (H) The mean clinical score ± SEM (n=6 isolate 7 serum transfer, n=6 isolate 1 serum transfer, n=6 P. copri serum transfer) is shown relative to time after-serum transfer (x-axis) for SPF mice. *P<0.05; **P<0.01; ***P<0.001, Kruskal-Wallis test with Dunn’s post-test.
Figure 7:
Figure 7:. Subdoligranulum isolate 7 is detectable in the feces of individuals in the at-risk period and early stages of RA.
(A) Known quantities (CFU/ml) of Subdoligranulum isolate 7 were spiked into a human fecal sample to create a standard curve. The curve ranges from 1×10⁹ CFU of isolate 7 per 100 mg of feces to 0 CFU of isolate 7, with a limit of detection set at 1×10⁵ CFU per 100 mg of feces. A line of best fit was set for regression analysis (R2=0.9982). (B) Feces from healthy controls (n=12), individuals at-risk for RA (n=12), individuals with early RA (n=12), or SPF mice (n=12) were analyzed by qPCR for presence of isolate 7. The number and percentage of samples above the limit of detection for the assay is displayed by group. ***P<0.001, Chi-square test. (C) Regression analysis was performed utilizing the line of best fit for the assay to determine the estimated CFUs of isolate 7 in the positive samples. The mean CFUs per 100mg feces is displayed ± SEM for all positive samples (n=4), for positive samples from individuals at-risk for RA (n=2), and for positive samples for individuals with early RA (n=2).

Comment in

References

    1. Nielen MM, van Schaardenburg D, Reesink HW, van de Stadt RJ, van der Horst-Bruinsma IE, de Koning MH, Habibuw MR, Vandenbroucke JP, Dijkmans BA, Specific autoantibodies precede the symptoms of rheumatoid arthritis: a study of serial measurements in blood donors. Arthritis Rheum 50, 380386 (2004); published online Epub Feb (10.1002/art.20018). - DOI - PubMed
    1. Arlestig L, Mullazehi M, Kokkonen H, Rocklov J, Ronnelid J, Dahlqvist SR, Antibodies against cyclic citrullinated peptides of IgG, IgA and IgM isotype and rheumatoid factor of IgM and IgA isotype are increased in unaffected members of multicase rheumatoid arthritis families from northern Sweden. Ann Rheum Dis 71, 825–829 (2012); published online Epub Jun (10.1136/annrheumdis-2011-200668). - DOI - PMC - PubMed
    1. Sokolove J, Bromberg R, Deane KD, Lahey LJ, Derber LA, Chandra PE, Edison JD, Gilliland WR, Tibshirani RJ, Norris JM, Holers VM, Robinson WH, Autoantibody epitope spreading in the pre-clinical phase predicts progression to rheumatoid arthritis. PLoS One 7, e35296 (2012)10.1371/journal.pone.0035296). - DOI - PMC - PubMed
    1. Kelmenson LB, Wagner BD, McNair BK, Frazer-Abel A, Demoruelle MK, Bergstedt DT, Feser ML, Moss LK, Parish MC, Mewshaw EA, Mikuls TR, Edison JD, Holers VM, Deane KD, Timing of Elevations of Autoantibody Isotypes Prior to Diagnosis of Rheumatoid Arthritis. Arthritis Rheumatol 72, 251–261 (2020); published online Epub Feb (10.1002/art.41091). - DOI - PMC - PubMed
    1. Gerlag DM, Raza K, van Baarsen LG, Brouwer E, Buckley CD, Burmester GR, Gabay C, Catrina AI, Cope AP, Cornelis F, Dahlqvist SR, Emery P, Eyre S, Finckh A, Gay S, Hazes JM, van der Helm-van Mil A, Huizinga TW, Klareskog L, Kvien TK, Lewis C, Machold KP, Ronnelid J, van Schaardenburg D, Schett G, Smolen JS, Thomas S, Worthington J, Tak PP, EULAR recommendations for terminology and research in individuals at risk of rheumatoid arthritis: report from the Study Group for Risk Factors for Rheumatoid Arthritis. Ann Rheum Dis 71, 6382013641 (2012); published online Epub May (10.1136/annrheumdis-2011-200990). - DOI - PMC - PubMed

Publication types