. 2022 Nov;119(44):e2209852119.
doi: 10.1073/pnas.2209852119. Epub 2022 Oct 26.

Epigenetic analysis of cell-free DNA by fragmentomic profiling

Affiliations

Epigenetic analysis of cell-free DNA by fragmentomic profiling

Qing Zhou et al. Proc Natl Acad Sci U S A. 2022 Nov.

Abstract

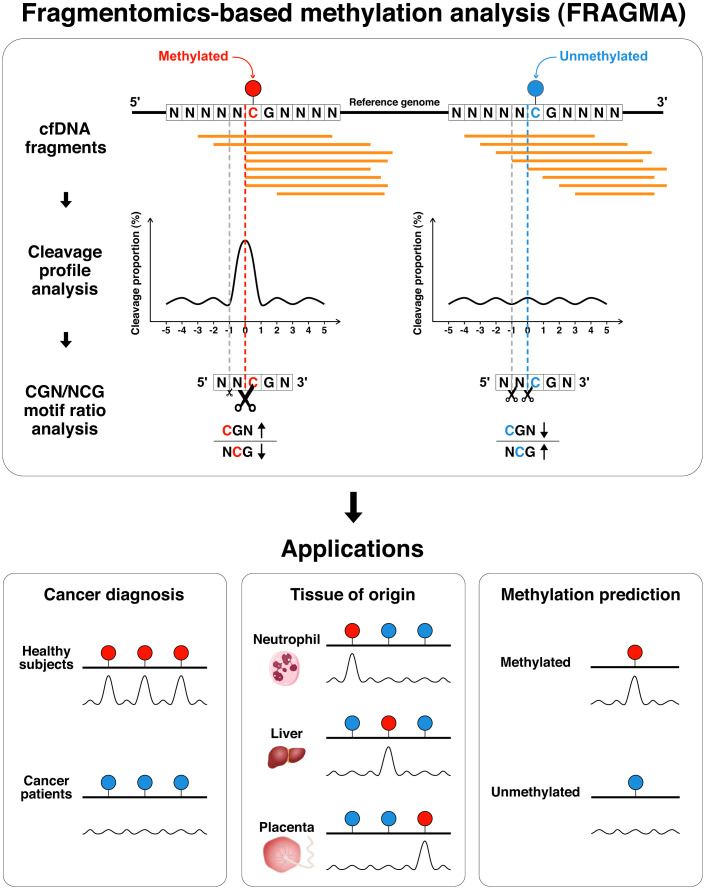
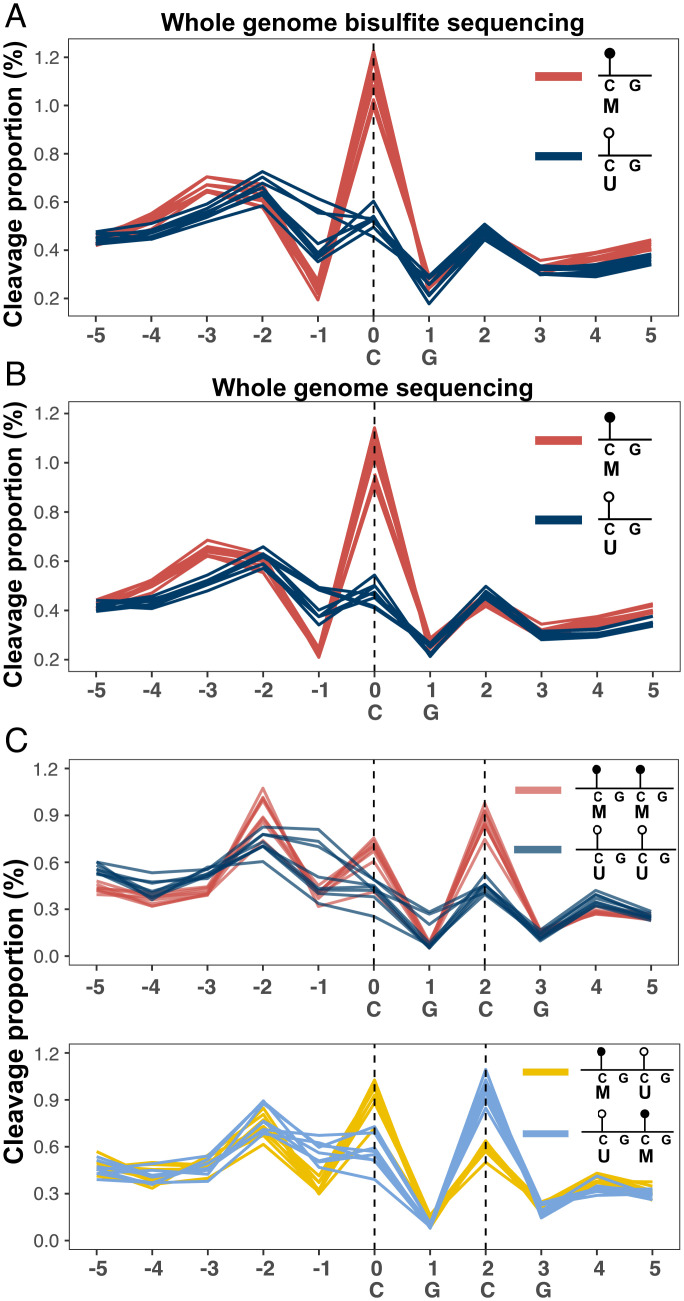
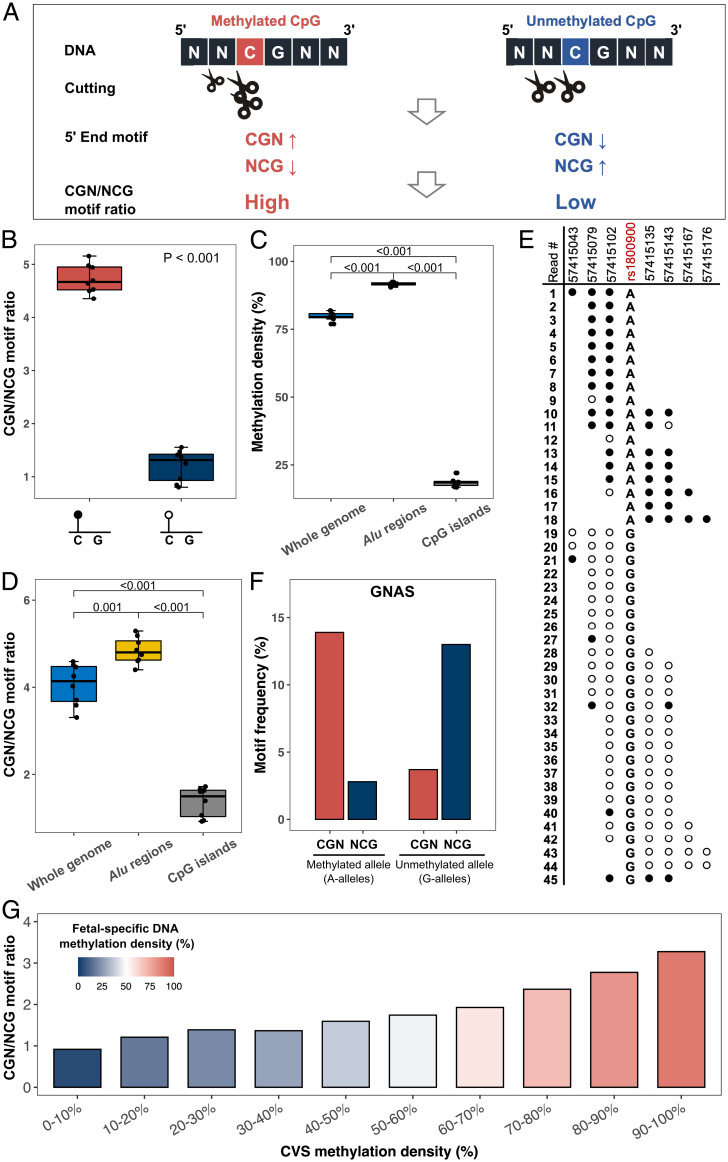
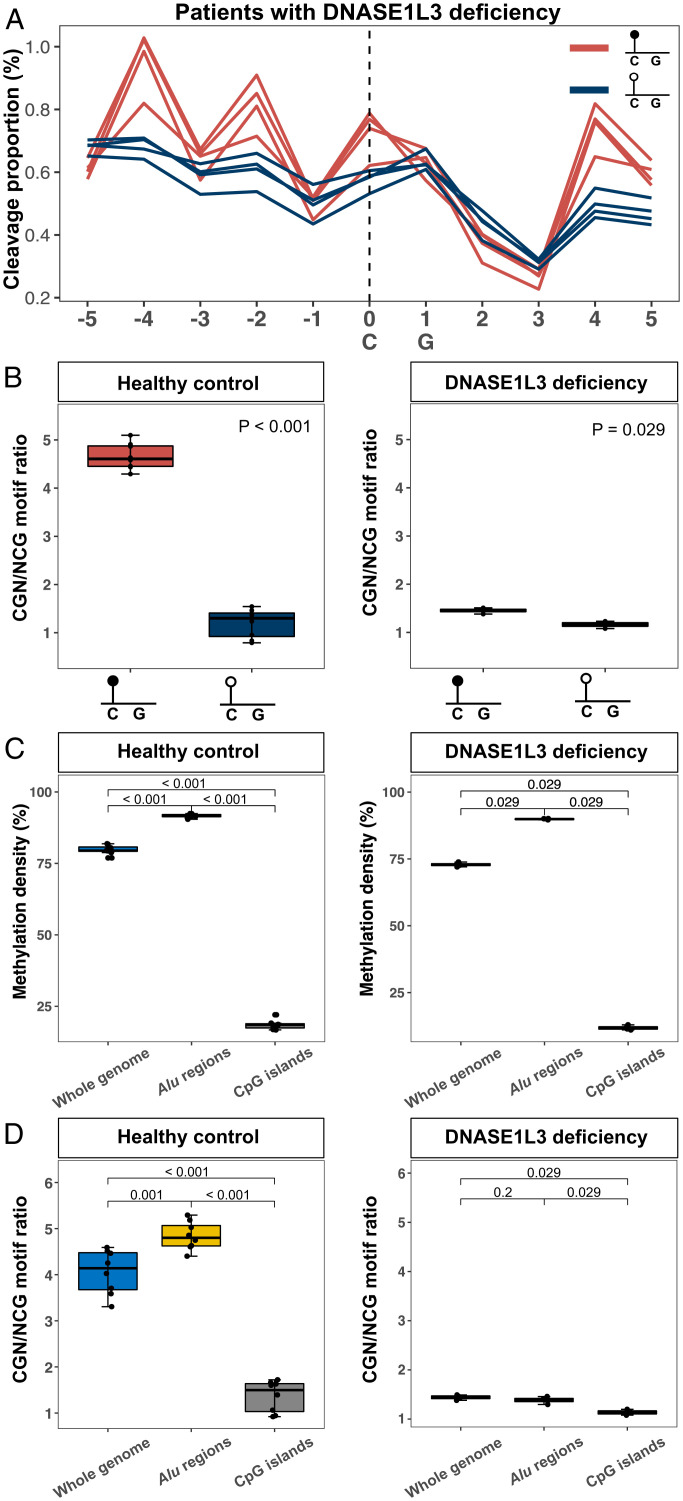
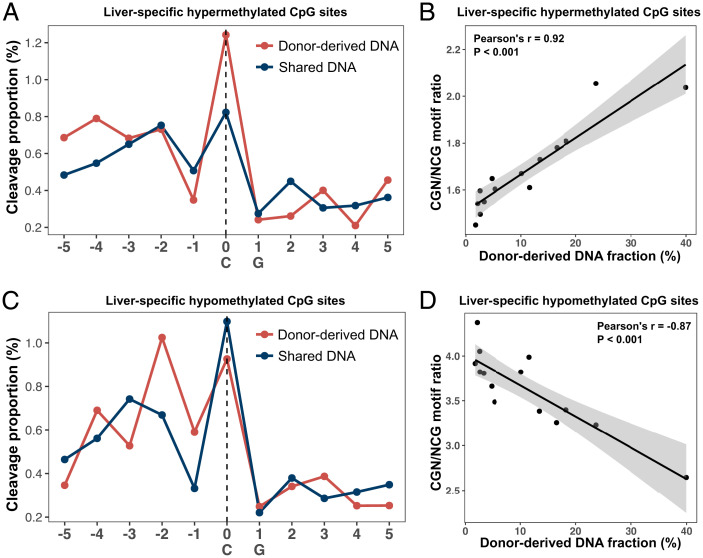
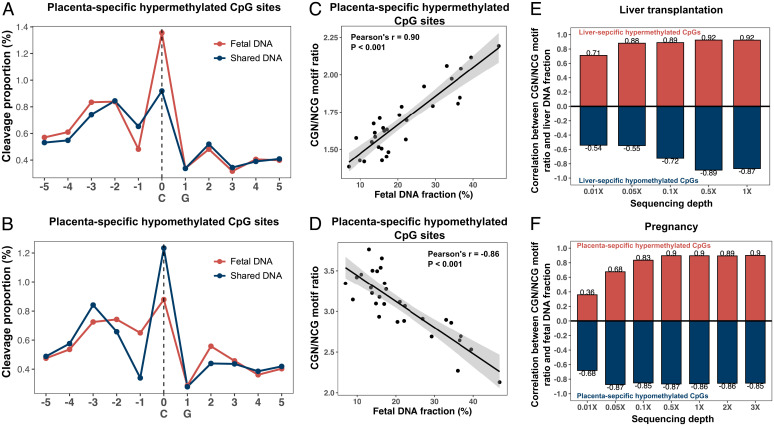
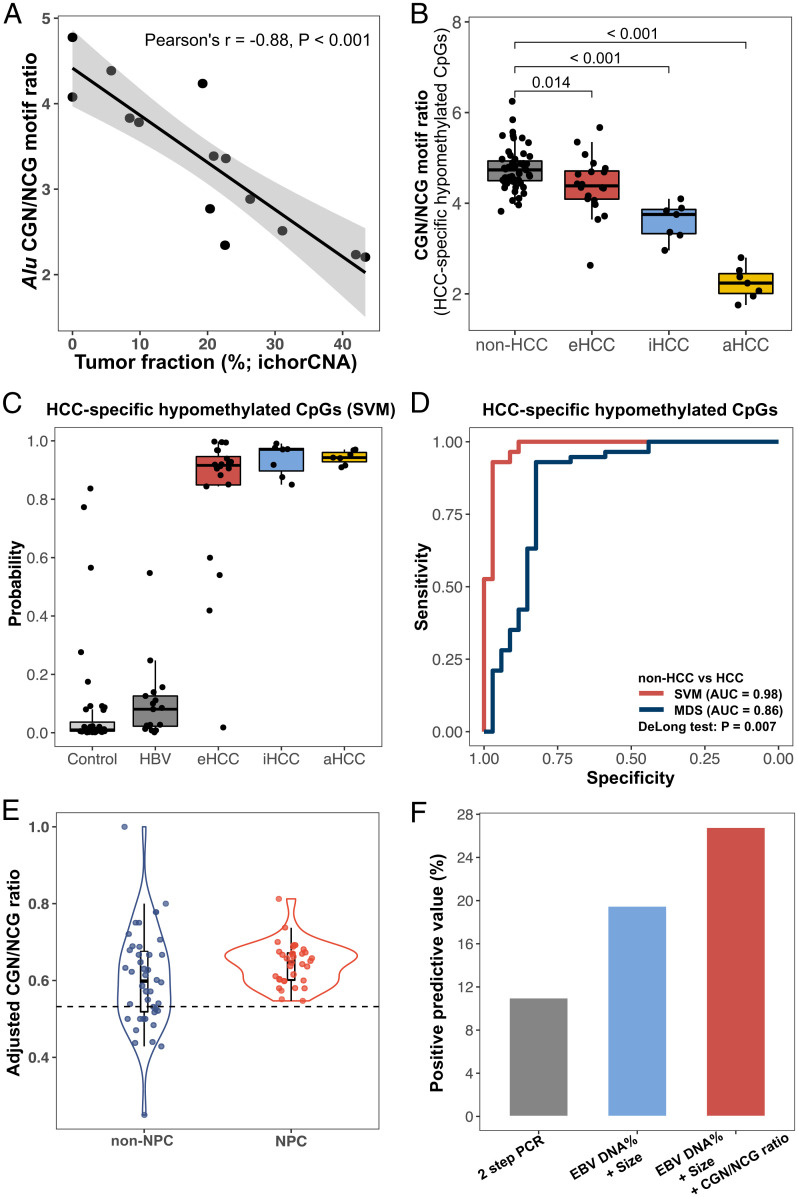
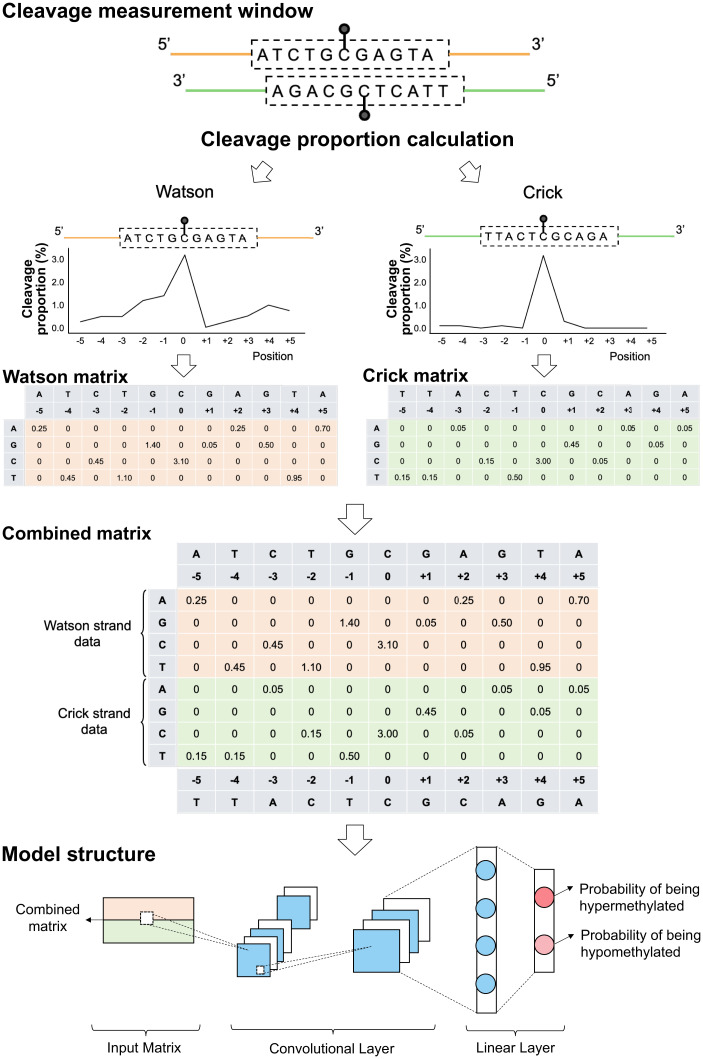
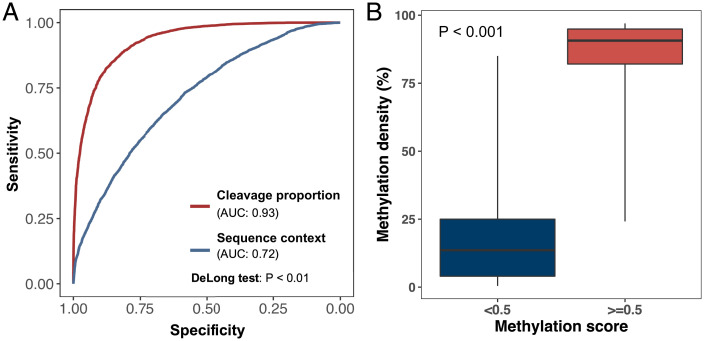
Cell-free DNA (cfDNA) fragmentation patterns contain important molecular information linked to tissues of origin. We explored the possibility of using fragmentation patterns to predict cytosine-phosphate-guanine (CpG) methylation of cfDNA, obviating the use of bisulfite treatment and associated risks of DNA degradation. This study investigated the cfDNA cleavage profile surrounding a CpG (i.e., within an 11-nucleotide [nt] window) to analyze cfDNA methylation. The cfDNA cleavage proportion across positions within the window appeared nonrandom and exhibited correlation with methylation status. The mean cleavage proportion was ∼twofold higher at the cytosine of methylated CpGs than unmethylated ones in healthy controls. In contrast, the mean cleavage proportion rapidly decreased at the 1-nt position immediately preceding methylated CpGs. Such differential cleavages resulted in a characteristic change in relative presentations of CGN and NCG motifs at 5' ends, where N represented any nucleotide. CGN/NCG motif ratios were correlated with methylation levels at tissue-specific methylated CpGs (e.g., placenta or liver) (Pearson's absolute r > 0.86). cfDNA cleavage profiles were thus informative for cfDNA methylation and tissue-of-origin analyses. Using CG-containing end motifs, we achieved an area under a receiver operating characteristic curve (AUC) of 0.98 in differentiating patients with and without hepatocellular carcinoma and enhanced the positive predictive value of nasopharyngeal carcinoma screening (from 19.6 to 26.8%). Furthermore, we elucidated the feasibility of using cfDNA cleavage patterns to deduce CpG methylation at single CpG resolution using a deep learning algorithm and achieved an AUC of 0.93. FRAGmentomics-based Methylation Analysis (FRAGMA) presents many possibilities for noninvasive prenatal, cancer, and organ transplantation assessment.

Keywords: cancer detection; epigenetics; fragmentomics; liquid biopsy; noninvasive prenatal testing.


Conflict of interest statement

Competing interest statement: A patent application on the described technology has been filed by Q.Z., G.K., P.J., R.Q., L.J., R.W.K.C., K.C.A.C., and Y.M.D.L.

Figures

Fig. 1.
Fig. 1.
Schematic for FRAGMA of cfDNA molecules. cfDNA molecules were sequenced by massively parallel sequencing and aligned to the human reference genome. The cleavage proportion within an 11-nt window (the cleavage measurement window) was used to measure the cutting preference of cfDNA molecules. The patterns of cleavage proportion within a window (the cleavage profile) depended on the methylation status of one or more CpG sites associated with that window. For example, a methylated CpG site might confer a higher probability of cfDNA cutting at the cytosine in the CpG context, but an unmethylated site might not. Such methylation-dependent differential fragmentation within a cleavage measurement window resulted in the change in CGN/NCG motif ratio. Thus, the CGN/NCG motif ratio provided a simplified version for reflecting CpG methylation, allowing cfDNA tissue-of-origin analysis of cfDNA and cancer detection. Furthermore, the great number of cleavage profiles derived from cfDNA molecules might provide an opportunity to train a deep learning model for methylation prediction at the single CpG resolution.
Fig. 2.
Fig. 2.
Cleavage proportion depending on CpG methylation status. (A) Cleavage profiles related to hypermethylated (red lines) and hypomethylated (blue lines) CpGs in plasma DNA of eight healthy controls based on whole-genome bisulfite sequencing data. Each line represents one sample. (B) Cleavage profiles related to hypermethylated (red lines) and hypomethylated (blue lines) CpGs in plasma DNA of eight healthy controls based on whole-genome nonbisulfite sequencing data. Each line represents one sample. (C) Cleavage profiles in windows each containing two tandem CpG dinucleotides spanning positions 0, 1, 2, and 3 (i.e., CGCG subsequence) in plasma DNA of eight healthy controls. Red, dark blue, yellow, and light blue lines correspond to the cleavage profiles with different methylation configurations of two immediately adjacent CpG sites: “MM,” “UU,” “MU,” and “UM,” where M and U represent hypermethylated and hypomethylated states, respectively.
Fig. 3.
Fig. 3.
CGN/NCG motif ratio analysis. (A) Illustration of the biological principle for CGN/NCG motif ratio. A methylated CpG confers a higher cleavage probability at the cytosine of the CpG context but a lower cleavage probability at one base before the CpG context, compared with an unmethylated CpG. Such differential cutting leads to an increase of CGN motifs but a decrease of NCG motifs. Therefore, we expected to observe higher CGN/NCG motif ratios on hypermethylated CpG sites compared to those on hypomethylated CpGs. (B) Box plot of CGN/NCG motif ratio between hypermethylated and hypomethylated CpGs from plasma DNA of eight healthy control samples. (C) Methylation density of cfDNA molecules measured by bisulfite sequencing across the whole genome, Alu regions, and CpG islands from eight healthy control samples, respectively. (D) CGN/NCG motif ratios of whole genome, Alu regions, and CpG islands, respectively. (E) Methylation status of sequenced fragments mapped to an imprinting region (GNAS gene, located at chr20:57,415,043–57,415,176). Each row with the back (methylated) and white (unmethylated) dots represents one plasma DNA molecule. Each dot represents one CpG site. Two groups of sequenced fragments carried A alleles and G alleles, respectively, at an SNP (rs1800900). cfDNA molecules carrying A-alleles are methylated while those with G-alleles are unmethylated. (F) The frequencies of CGN and NCG motifs related to the imprinting region. (G) The CGN/NCG motif ratios from fetal-specific cfDNA in maternal plasma DNA (first trimester) correlated with the methylation levels in the paired chorionic villus sampling (CVS) biopsy. CpGs were grouped into 10 groups according to the methylation levels from the paired CVS biopsy. The y axis represents the CGN/NCG motif ratio of fetal-specific cfDNA, and the graded colors in the bars represent the different methylation densities of fetal-specific cfDNA.
Fig. 4.
Fig. 4.
DNASE1L3 activity affecting cfDNA cleavage profile. (A) Cleavage profiles associated with hypermethylated (red lines) and hypomethylated (blue lines) CpGs for four patients with DNASE1L3 deficiency. (B) CGN/NCG motif ratios between hypermethylated and hypomethylated CpGs in plasma DNA of healthy controls (Left) and patients with DNASE1L3 deficiency (Right). (C) Methylation density of the whole genome, Alu regions, and CpG islands for plasma DNA samples from healthy controls (Left) and patients with DNASE1L3 deficiency (Right). (D) CGN/NCG motif ratios across the whole genome, Alu regions, and CpG islands in healthy controls (Left) and patients with DNASE1L3 deficiency (Right).
Fig. 5.
Fig. 5.
Liver-specific cleavage profile readily used for deducing liver DNA contribution in plasma DNA of liver transplant patients. (A) Cleavage profiles associated with liver-specific hypermethylated CpGs deduced from donor-derived DNA (red line) and shared DNA (blue line). Donor-derived DNA was defined as cfDNA carrying donor-specific alleles that were absent in recipient genomes, while the shared DNA was defined as cfDNA molecules carrying the alleles existing in both the donor and recipient genomes. For the cleavage profile analysis, donor-derived and shared DNA were pooled together from 14 liver transplant samples. (B) The CGN/NCG motif ratio associated with liver-specific hypermethylated CpGs was positively correlated with the donor-derived DNA fraction. (C) Cleavage profiles associated with liver-specific hypomethylated CpGs were analyzed in a similar way as liver-specific hypermethylated CpGs. (D) The CGN/NCG motif ratio associated with liver-specific hypomethylated CpGs was negatively correlated with the donor-derived DNA fraction.
Fig. 6.
Fig. 6.
Tissue-specific cleavage profiled used for tissue-of-origin analysis. Cleavage profiles of placenta-specific hypermethylated (A) and hypomethylated (B) CpGs in fetal-specific DNA (red line) and shared DNA (blue line) were determined, respectively. Fetal-specific and shared DNA molecules in maternal plasma were pooled together from 30 pregnant women. The CGN/NCG motif ratios associated with placenta-specific hypermethylated (C) and hypomethylated CpGs (D) were positively and negatively correlated with fetal DNA fractions, respectively. (E) and (F) Impact of the sequencing depth on the performance of tissue-of-origin analysis. Pearson’s correlation coefficient between the CGN/NCG motif ratio from liver-specific hypermethylated (red) and hypomethylated (blue) CpGs and liver DNA fraction (E). Pearson’s correlation coefficient between the CGN/NCG motif ratio from placenta-specific hypermethylated (red) and hypomethylated (blue) CpGs and fetal DNA fraction. X-axis represents different sequencing depths (F).
Fig. 7.
Fig. 7.
The use of end motifs resulting from the differential cutting within the cleavage measurement window for cancer detection. (A) The correlation between CGN/NCG motif ratio originating from Alu regions and tumor DNA fraction determined by copy number aberrations in patients with HCC. (B) The CGN/NCG motif ratio concerning HCC-specific hypomethylated CpGs in plasma DNA among non-HCC patients (healthy controls and HBV carriers) and HCC patients with early (eHCC), intermediate (iHCC), and advanced (aHCC) stages. (C) HCC probability determined by SVM models using CG-containing motifs (i.e., CGA, CGT, CGC, CGG, ACG, TCG, CCG, and GCG). (D) ROC (receiver operating characteristic curve) analysis between CG-containing motifs and motif diversity scores. (E) The adjusted CGN/NCG motif ratios of informative CpGs between non-NPC and NPC patients. (F) PPVs archived by PCR-based assay, the approach based on EBV DNA proportion and size ratio, and the approach based on the combined EBV DNA proportion, size ratio, and cleavage motifs.
Fig. 8.
Fig. 8.
Schematic for methylation status prediction at single CpG resolution using a CNN model based on cleavage profiles. For illustration purposes, the 5 nt upstream (e.g., ATCTG) and 5 nt downstream (e.g., GAGTA) of the cytosine at a CpG site (i.e., the cleavage measurement window) being analyzed were presented as 5′-[ATCTG]C[GAGTA]-3′ for the Watson strand. The relative positions of this sequence corresponded to −5, −4, −3, −2, −1, 0, +1, +2, +3, +4, and +5, respectively. The central position 0 corresponded to the cytosine at the CpG site that was subjected to the methylation analysis. The cleavage proportion for each position was constructed into a 2-D matrix according to the sequence context. For instance, for a position of −1 corresponding to the base of guanine (G), the cleavage proportion associated with G (1.40) was filled in the corresponding cell between a column of −1 and a row of G. The remaining rows corresponding to A, C, and T in the Watson strand were filled by 0. The cleavage profiles and sequence context originating from the Crick strand (‘5-[TTACT]C[GCAGA]-3′) were processed similarly. The data matrices from the Watson and Crick strand were put together into a combined matrix to train and test a CNN model.
Fig. 9.
Fig. 9.
Evaluation for CNN model for methylation analysis using cleavage measurement windows. (A) ROC analysis for the performance of the CNN model by using cleavage measurement windows (red line) and sequence context (blue line) in a testing dataset. (B) The box plot illustrated the CpG methylation density detected by bisulfite sequencing between two CpG groups with a methylation score < 0.5 or ≥ 0.5 in a testing dataset.

References

    1. Lo Y. M. D., Han D. S. C., Jiang P., Chiu R. W. K., Epigenetics, fragmentomics, and topology of cell-free DNA in liquid biopsies. Science 372, eaaw3616 (2021). - PubMed
    1. Lui Y. Y., et al. , Predominant hematopoietic origin of cell-free DNA in plasma and serum after sex-mismatched bone marrow transplantation. Clin. Chem. 48, 421–427 (2002). - PubMed
    1. Moss J., et al. , Comprehensive human cell-type methylation atlas reveals origins of circulating cell-free DNA in health and disease. Nat. Commun. 9, 5068 (2018). - PMC - PubMed
    1. Jiang P., et al. , Lengthening and shortening of plasma DNA in hepatocellular carcinoma patients. Proc. Natl. Acad. Sci. U.S.A. 112, E1317–E1325 (2015). - PMC - PubMed
    1. Lo Y. M., et al. , Maternal plasma DNA sequencing reveals the genome-wide genetic and mutational profile of the fetus. Sci. Transl. Med. 2, 61ra91 (2010). - PubMed

Publication types