. 2023 Apr 1;207(7):908-920.
doi: 10.1164/rccm.202205-0893OC.

Microbial Dysregulation of the Gut-Lung Axis in Bronchiectasis

Affiliations

Microbial Dysregulation of the Gut-Lung Axis in Bronchiectasis

Jayanth Kumar Narayana et al. Am J Respir Crit Care Med. .

Abstract

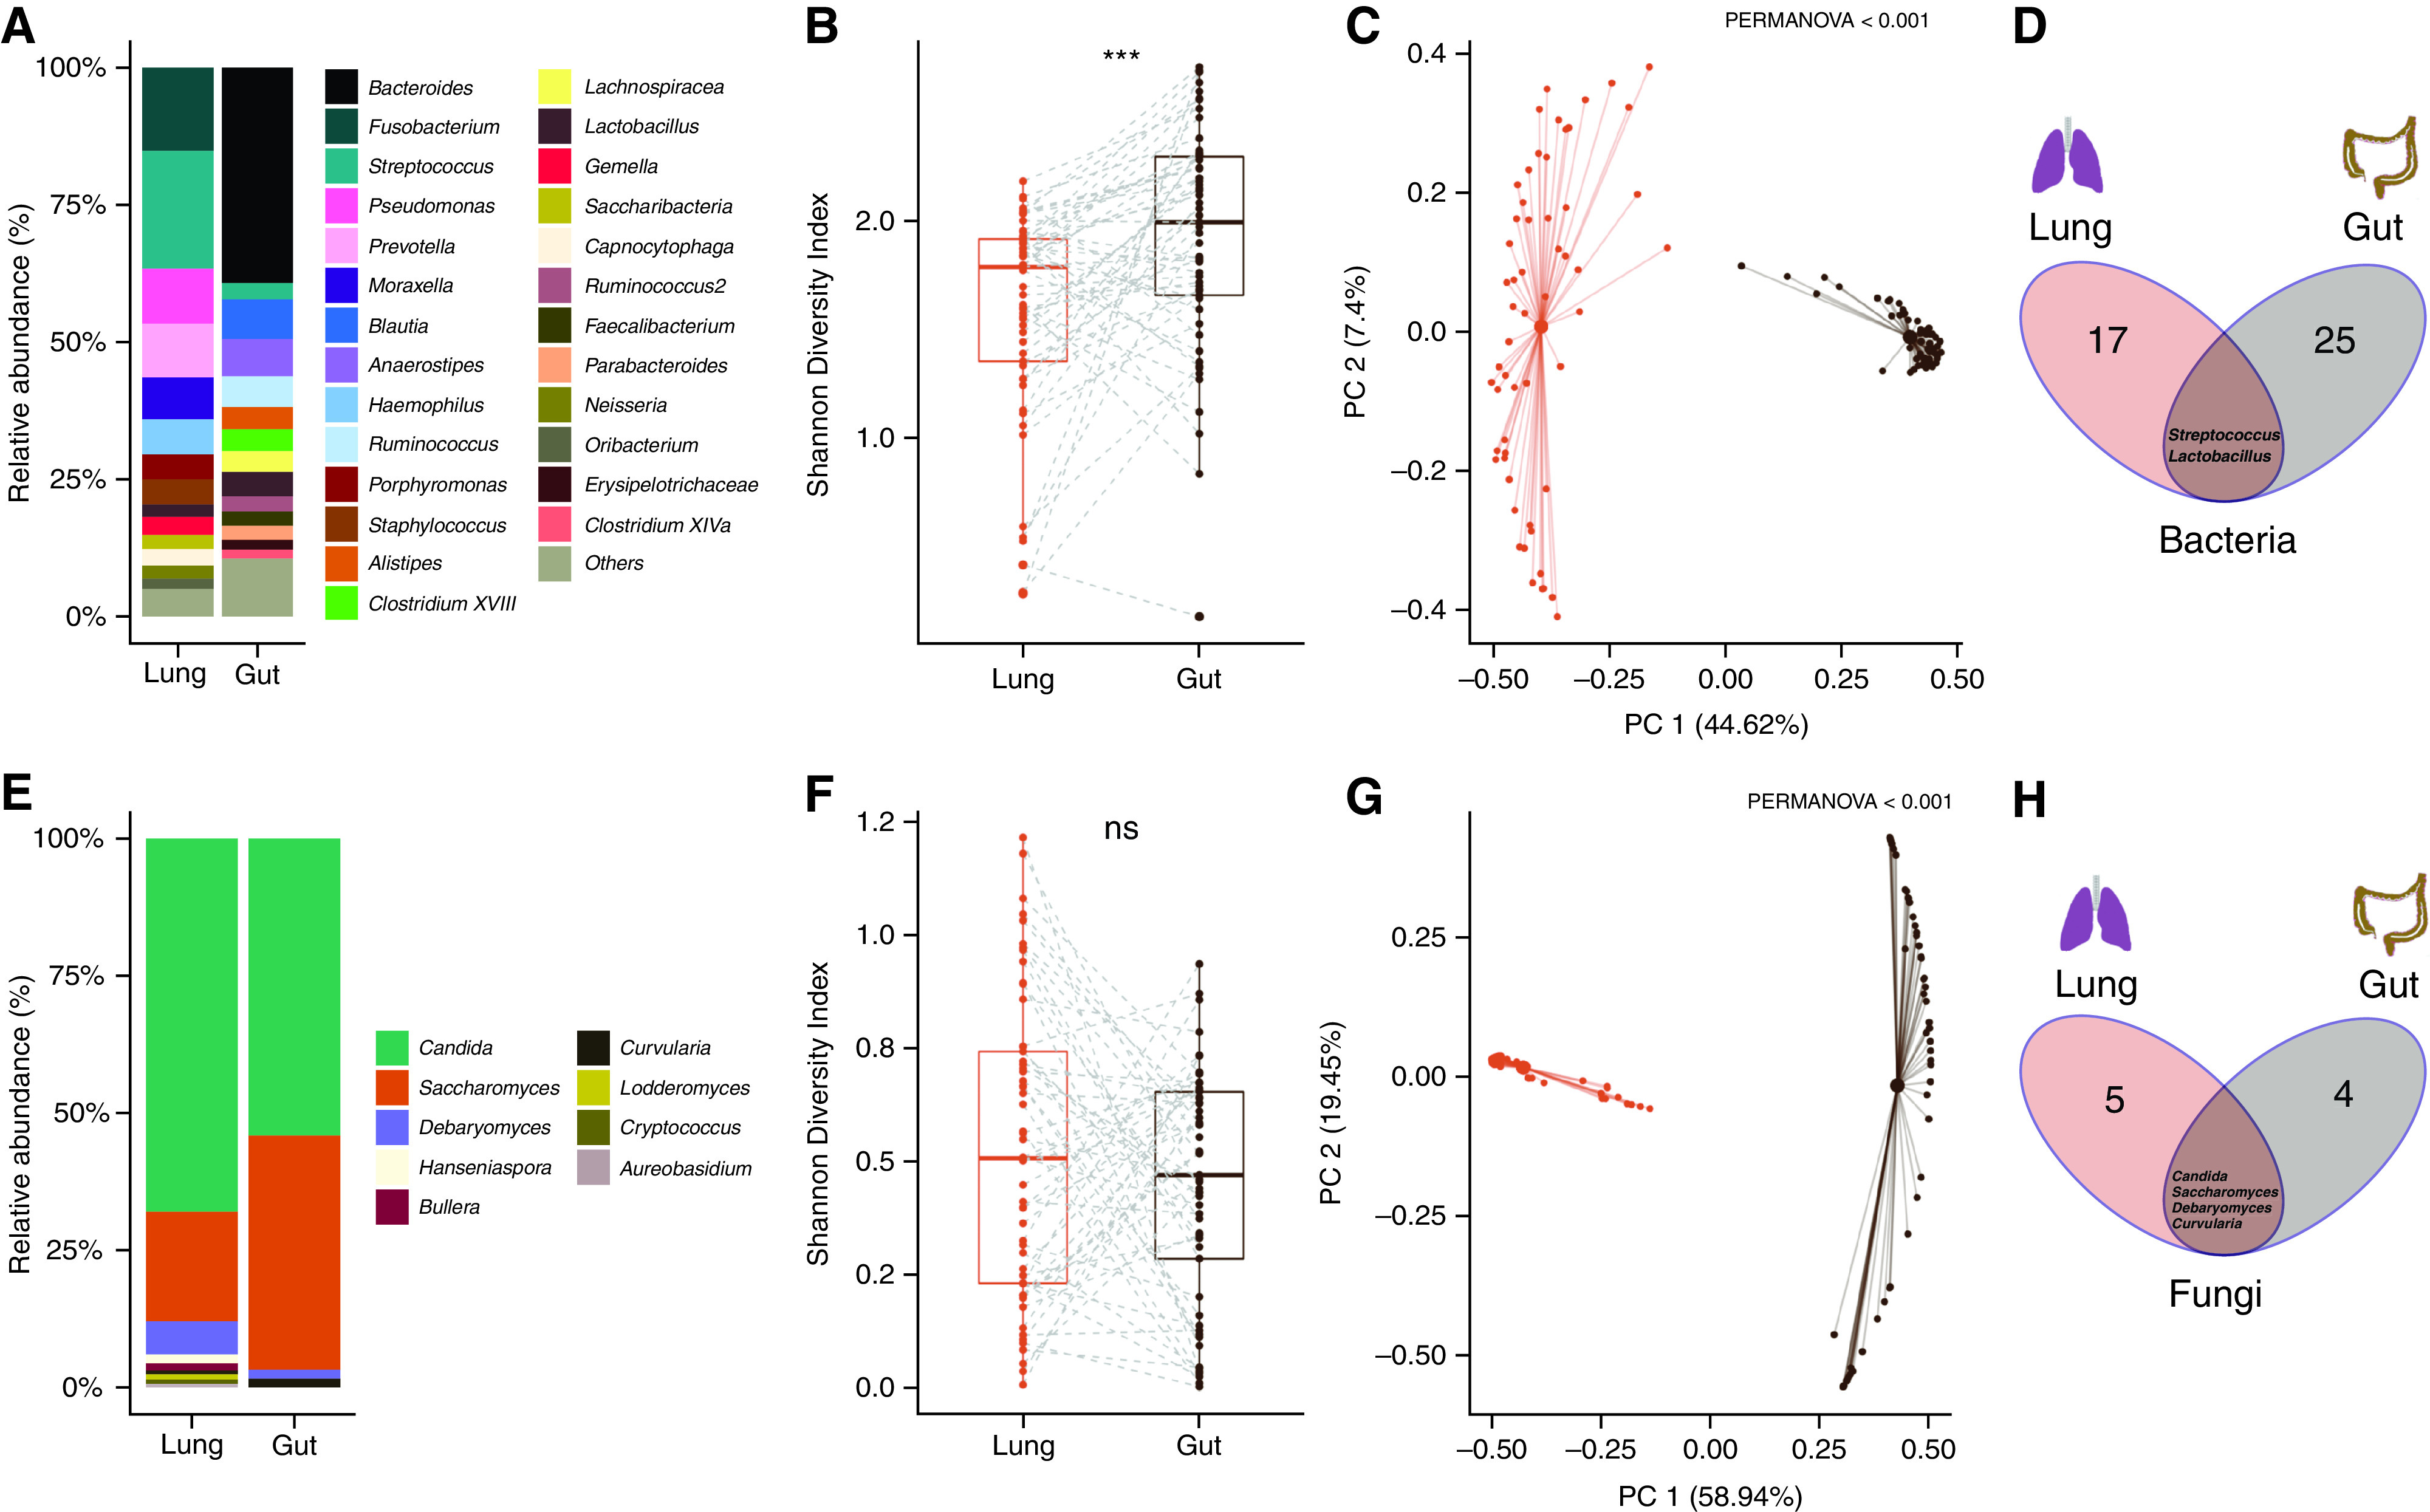
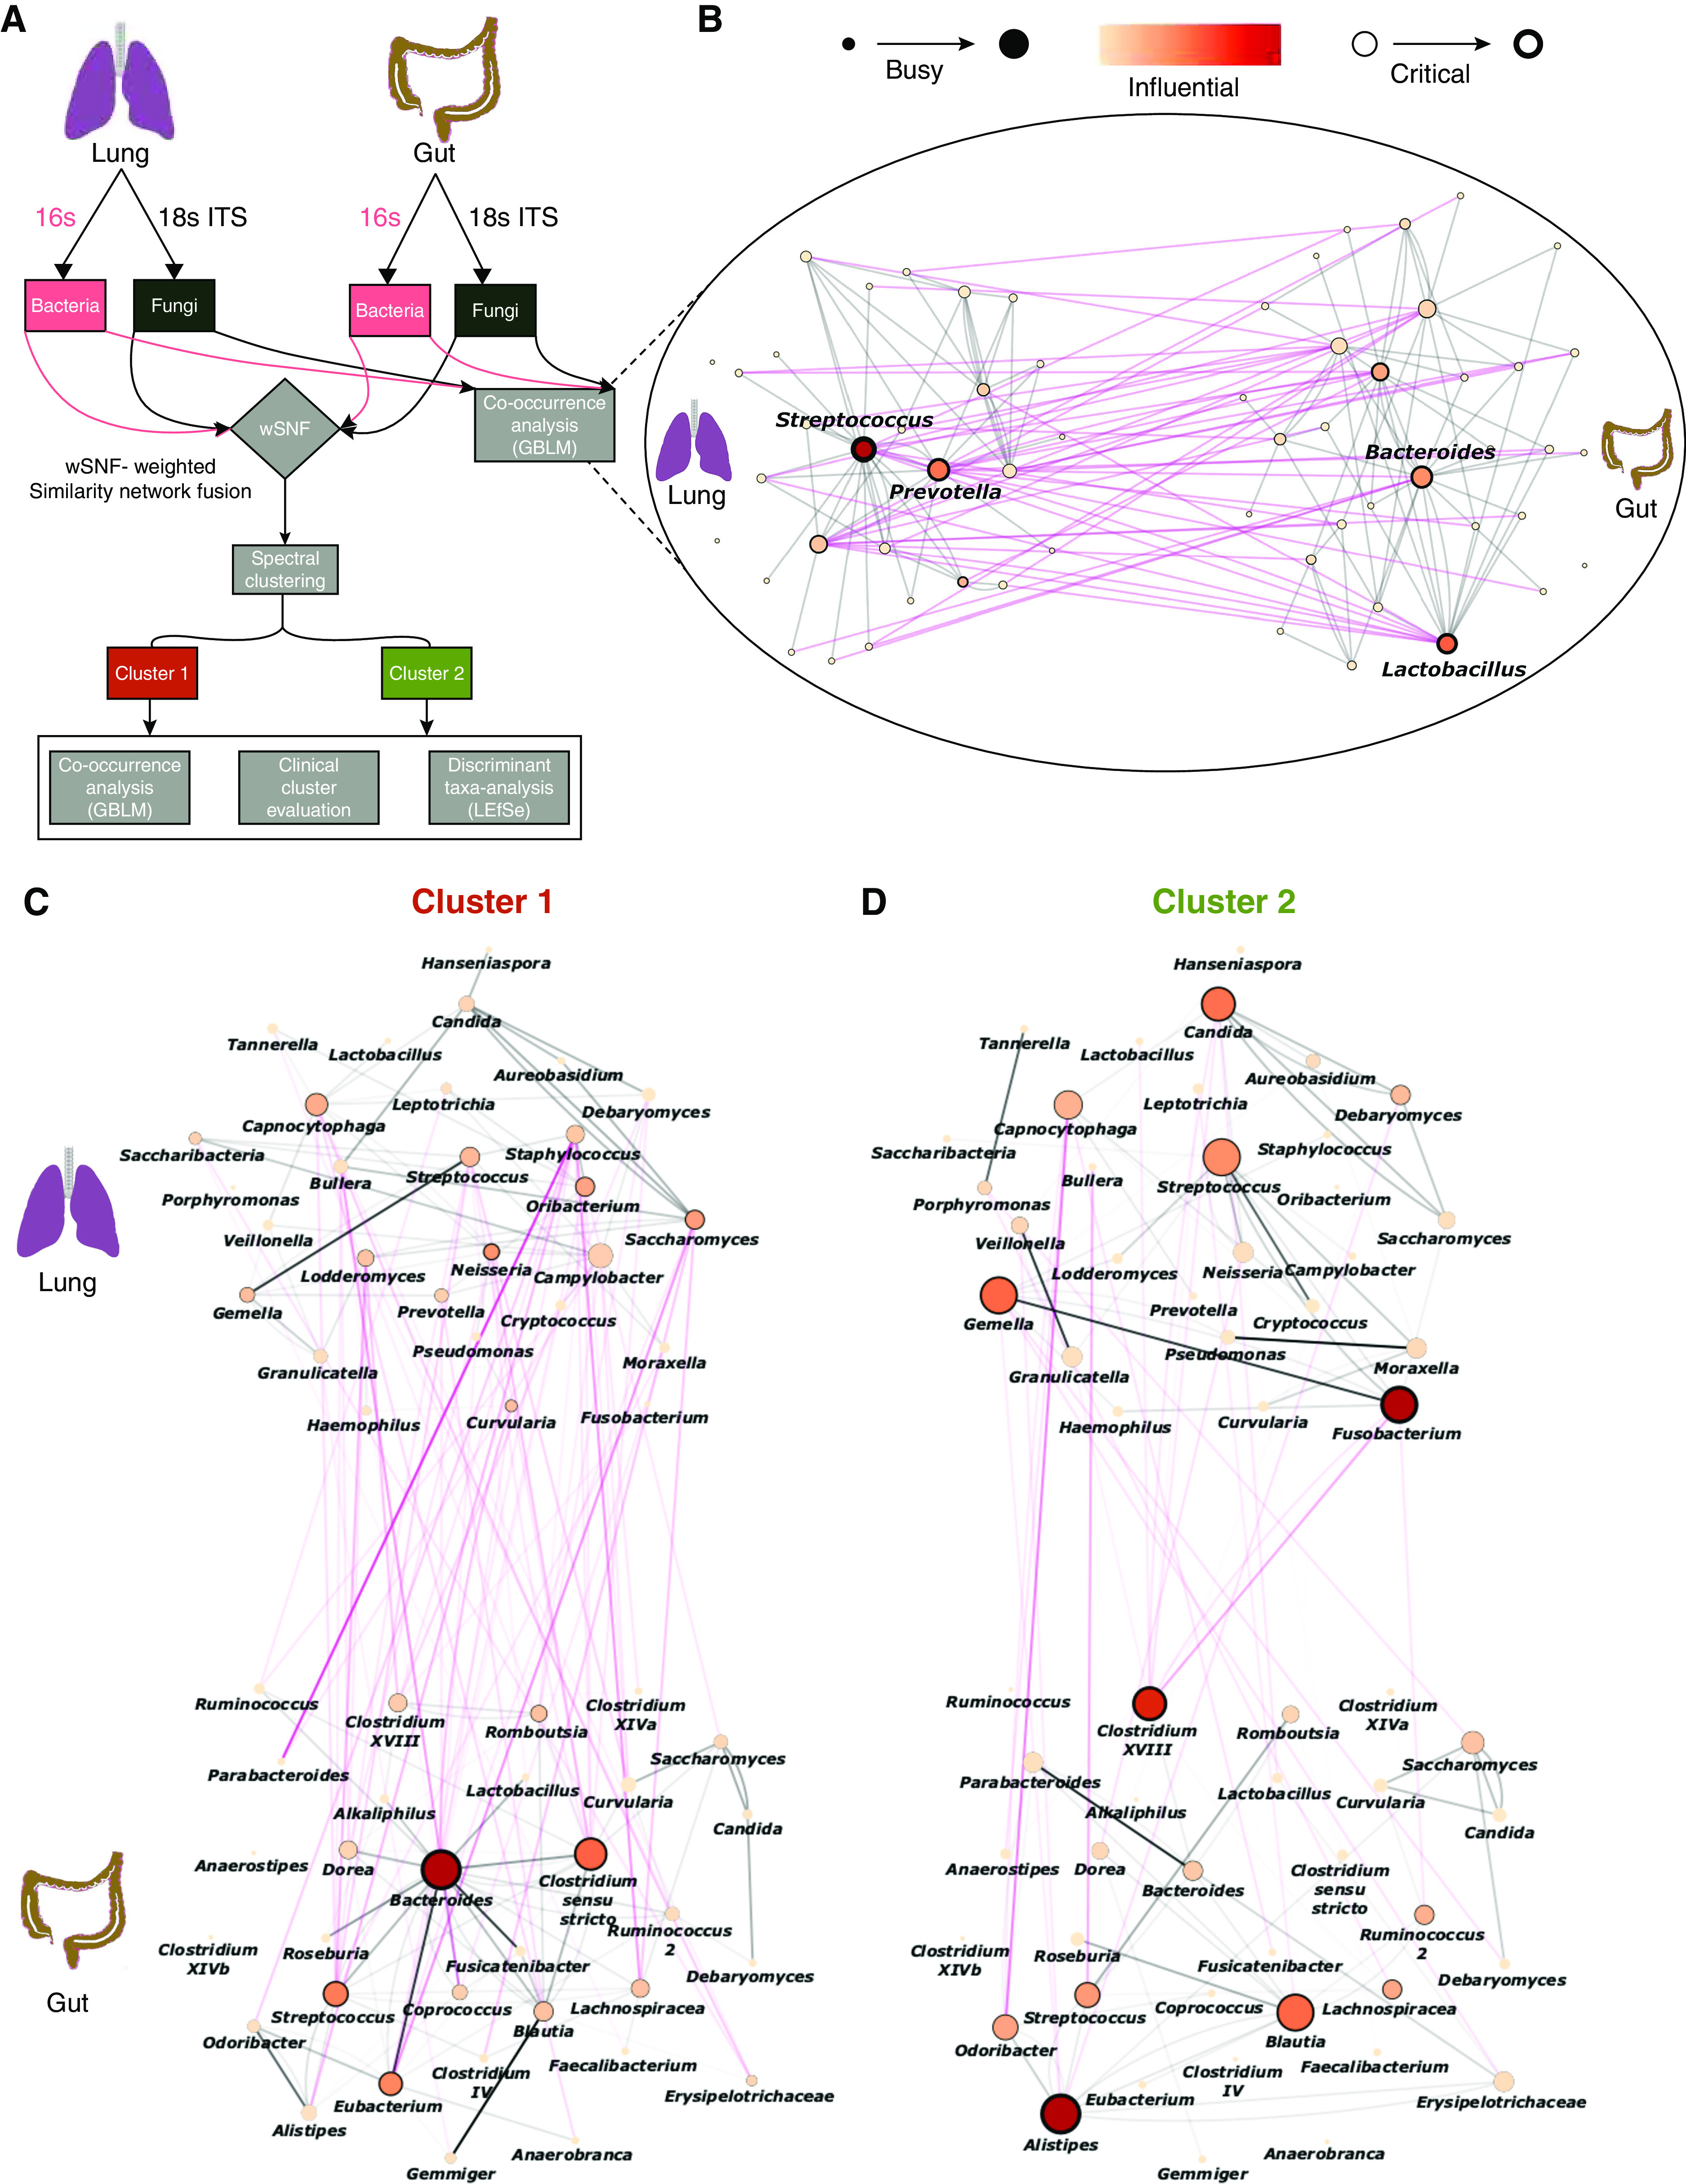
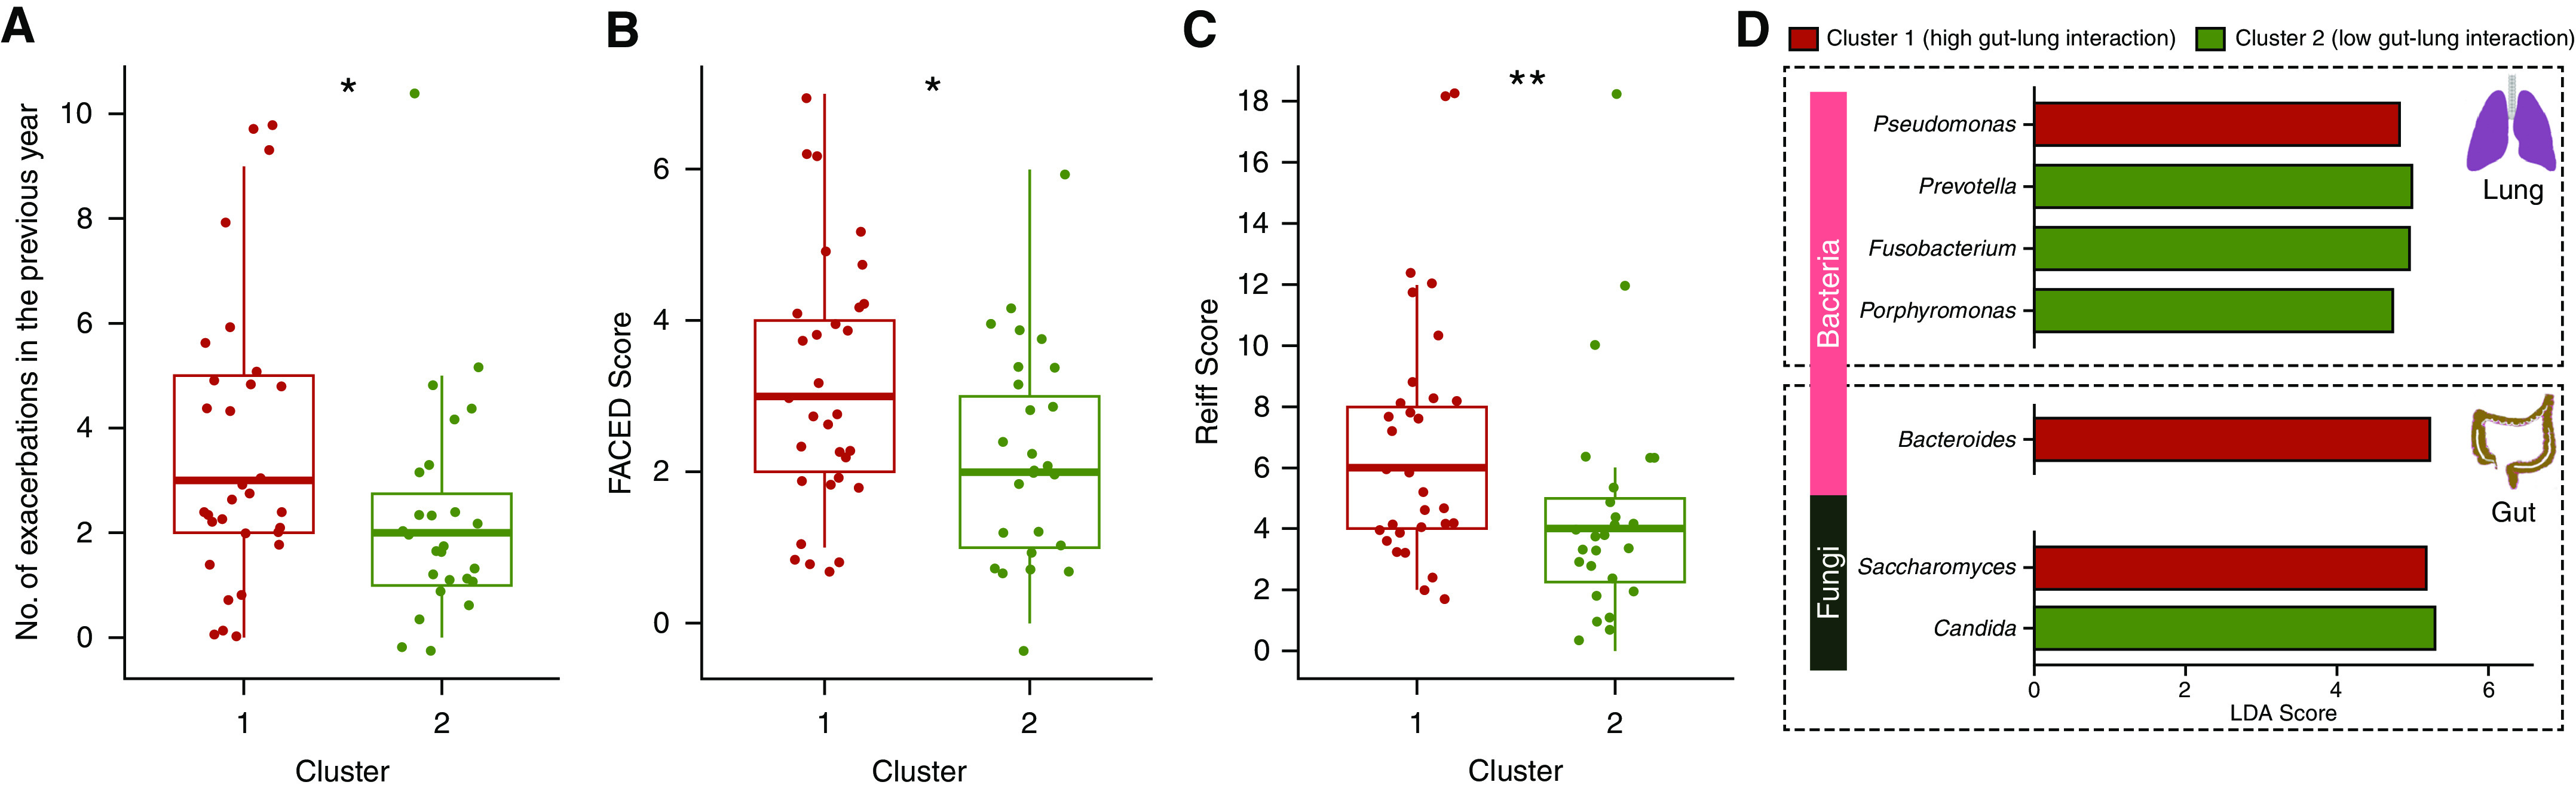
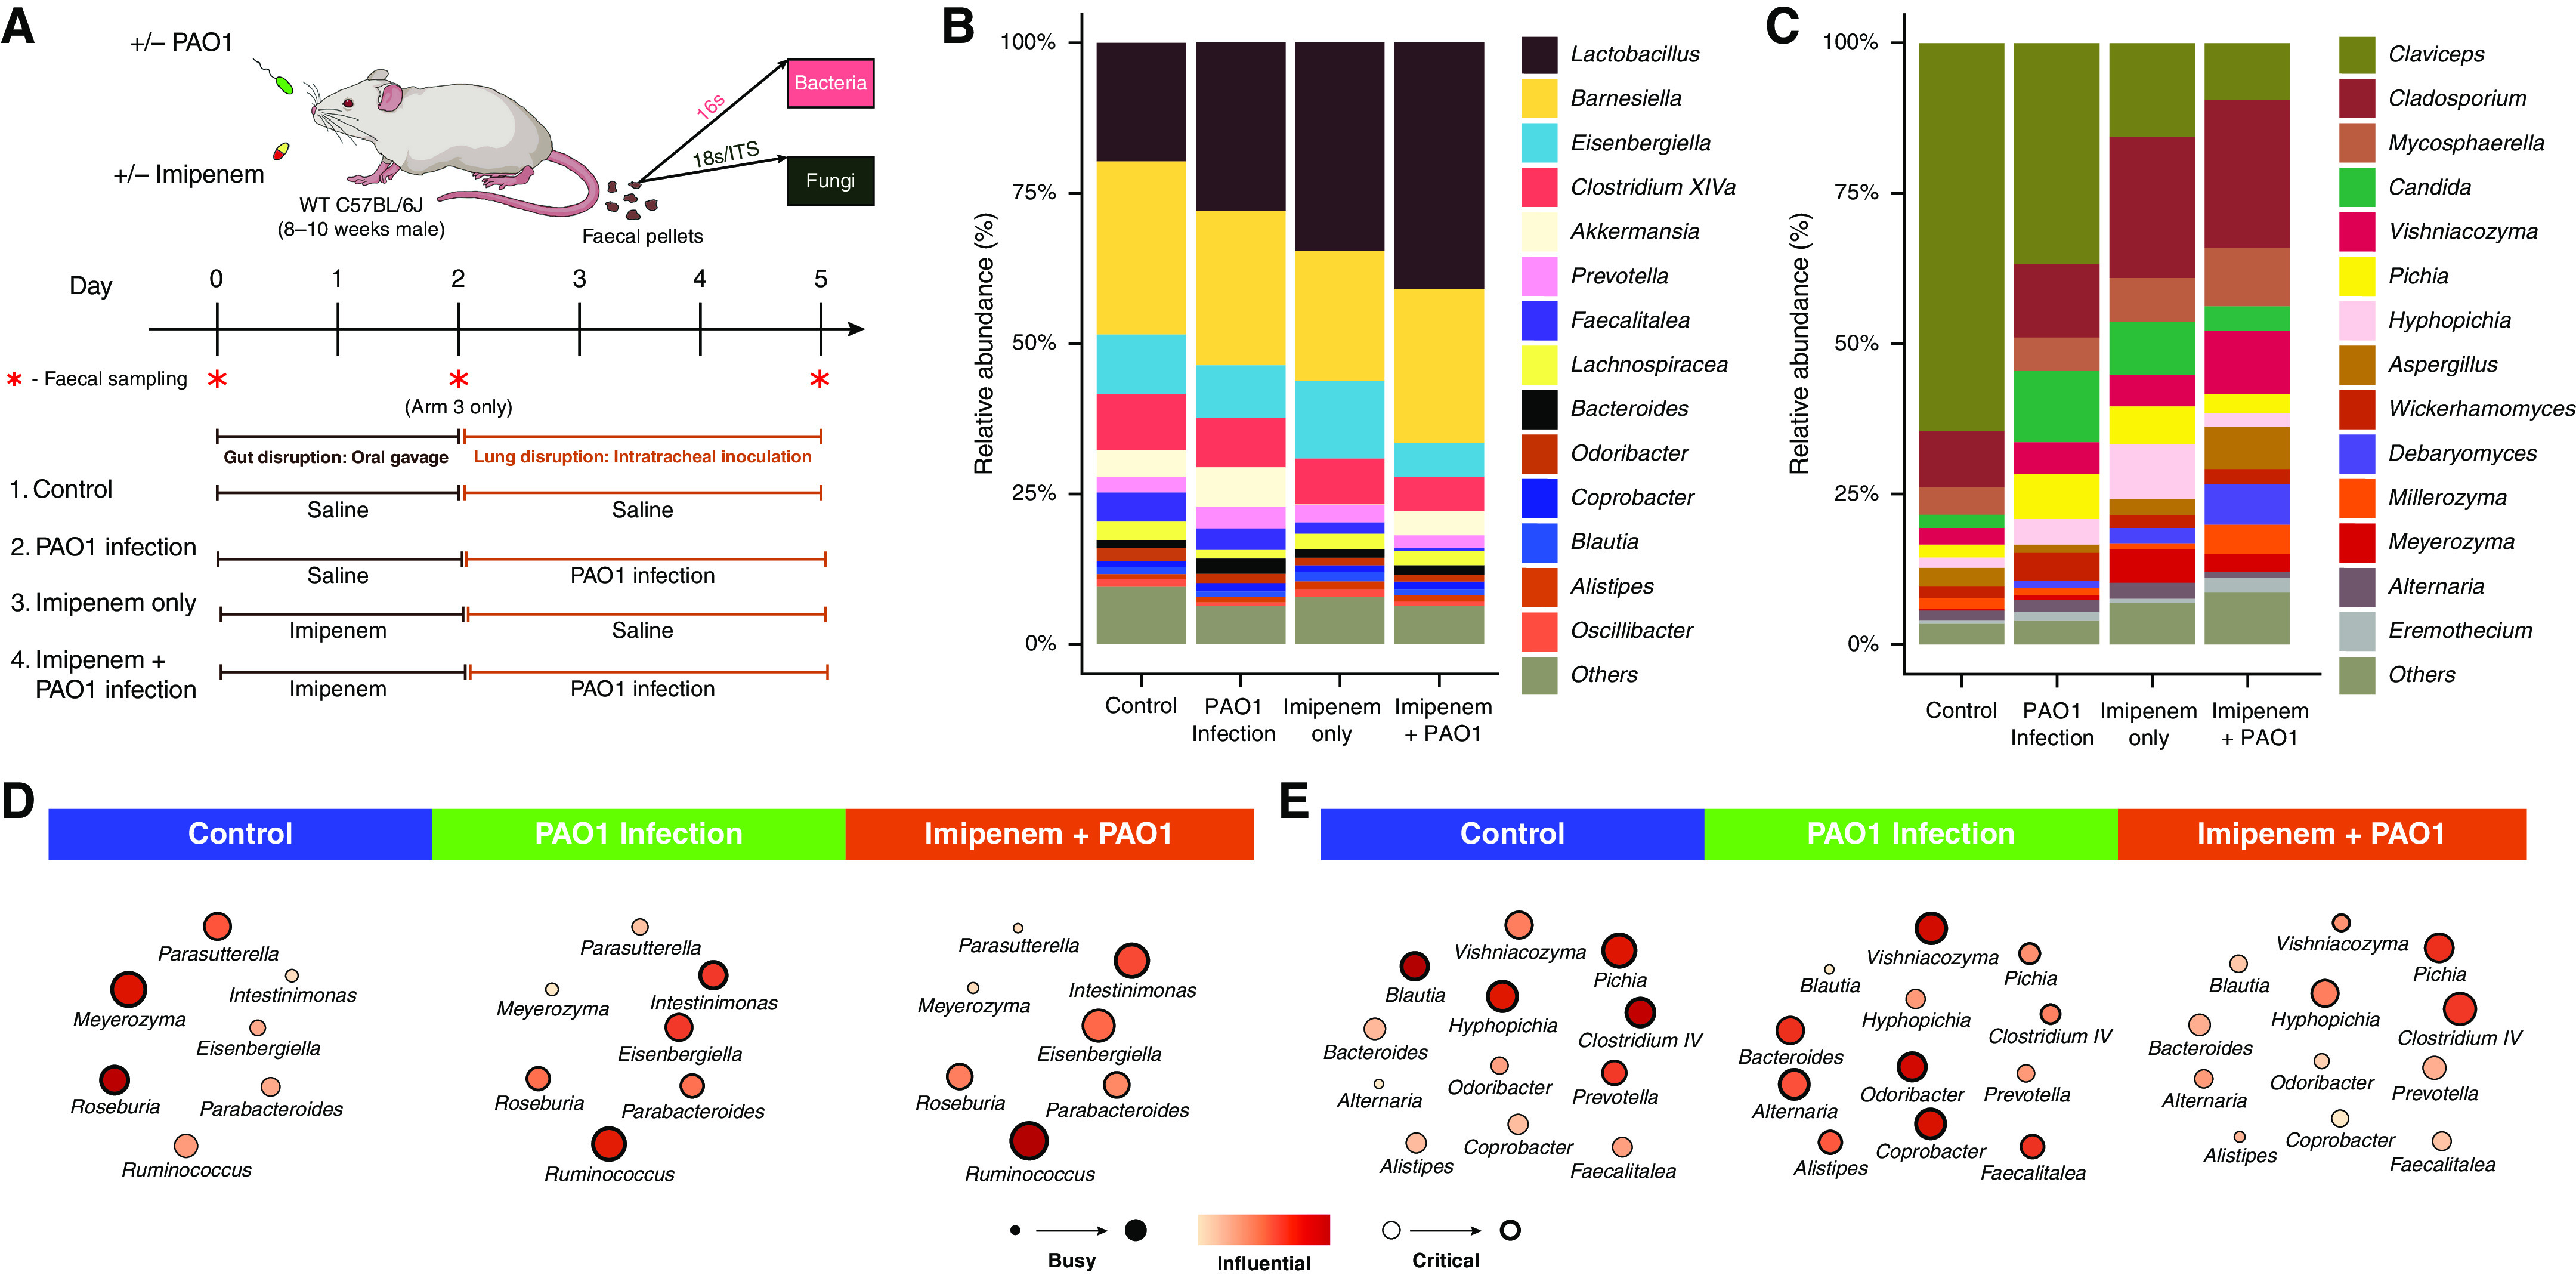
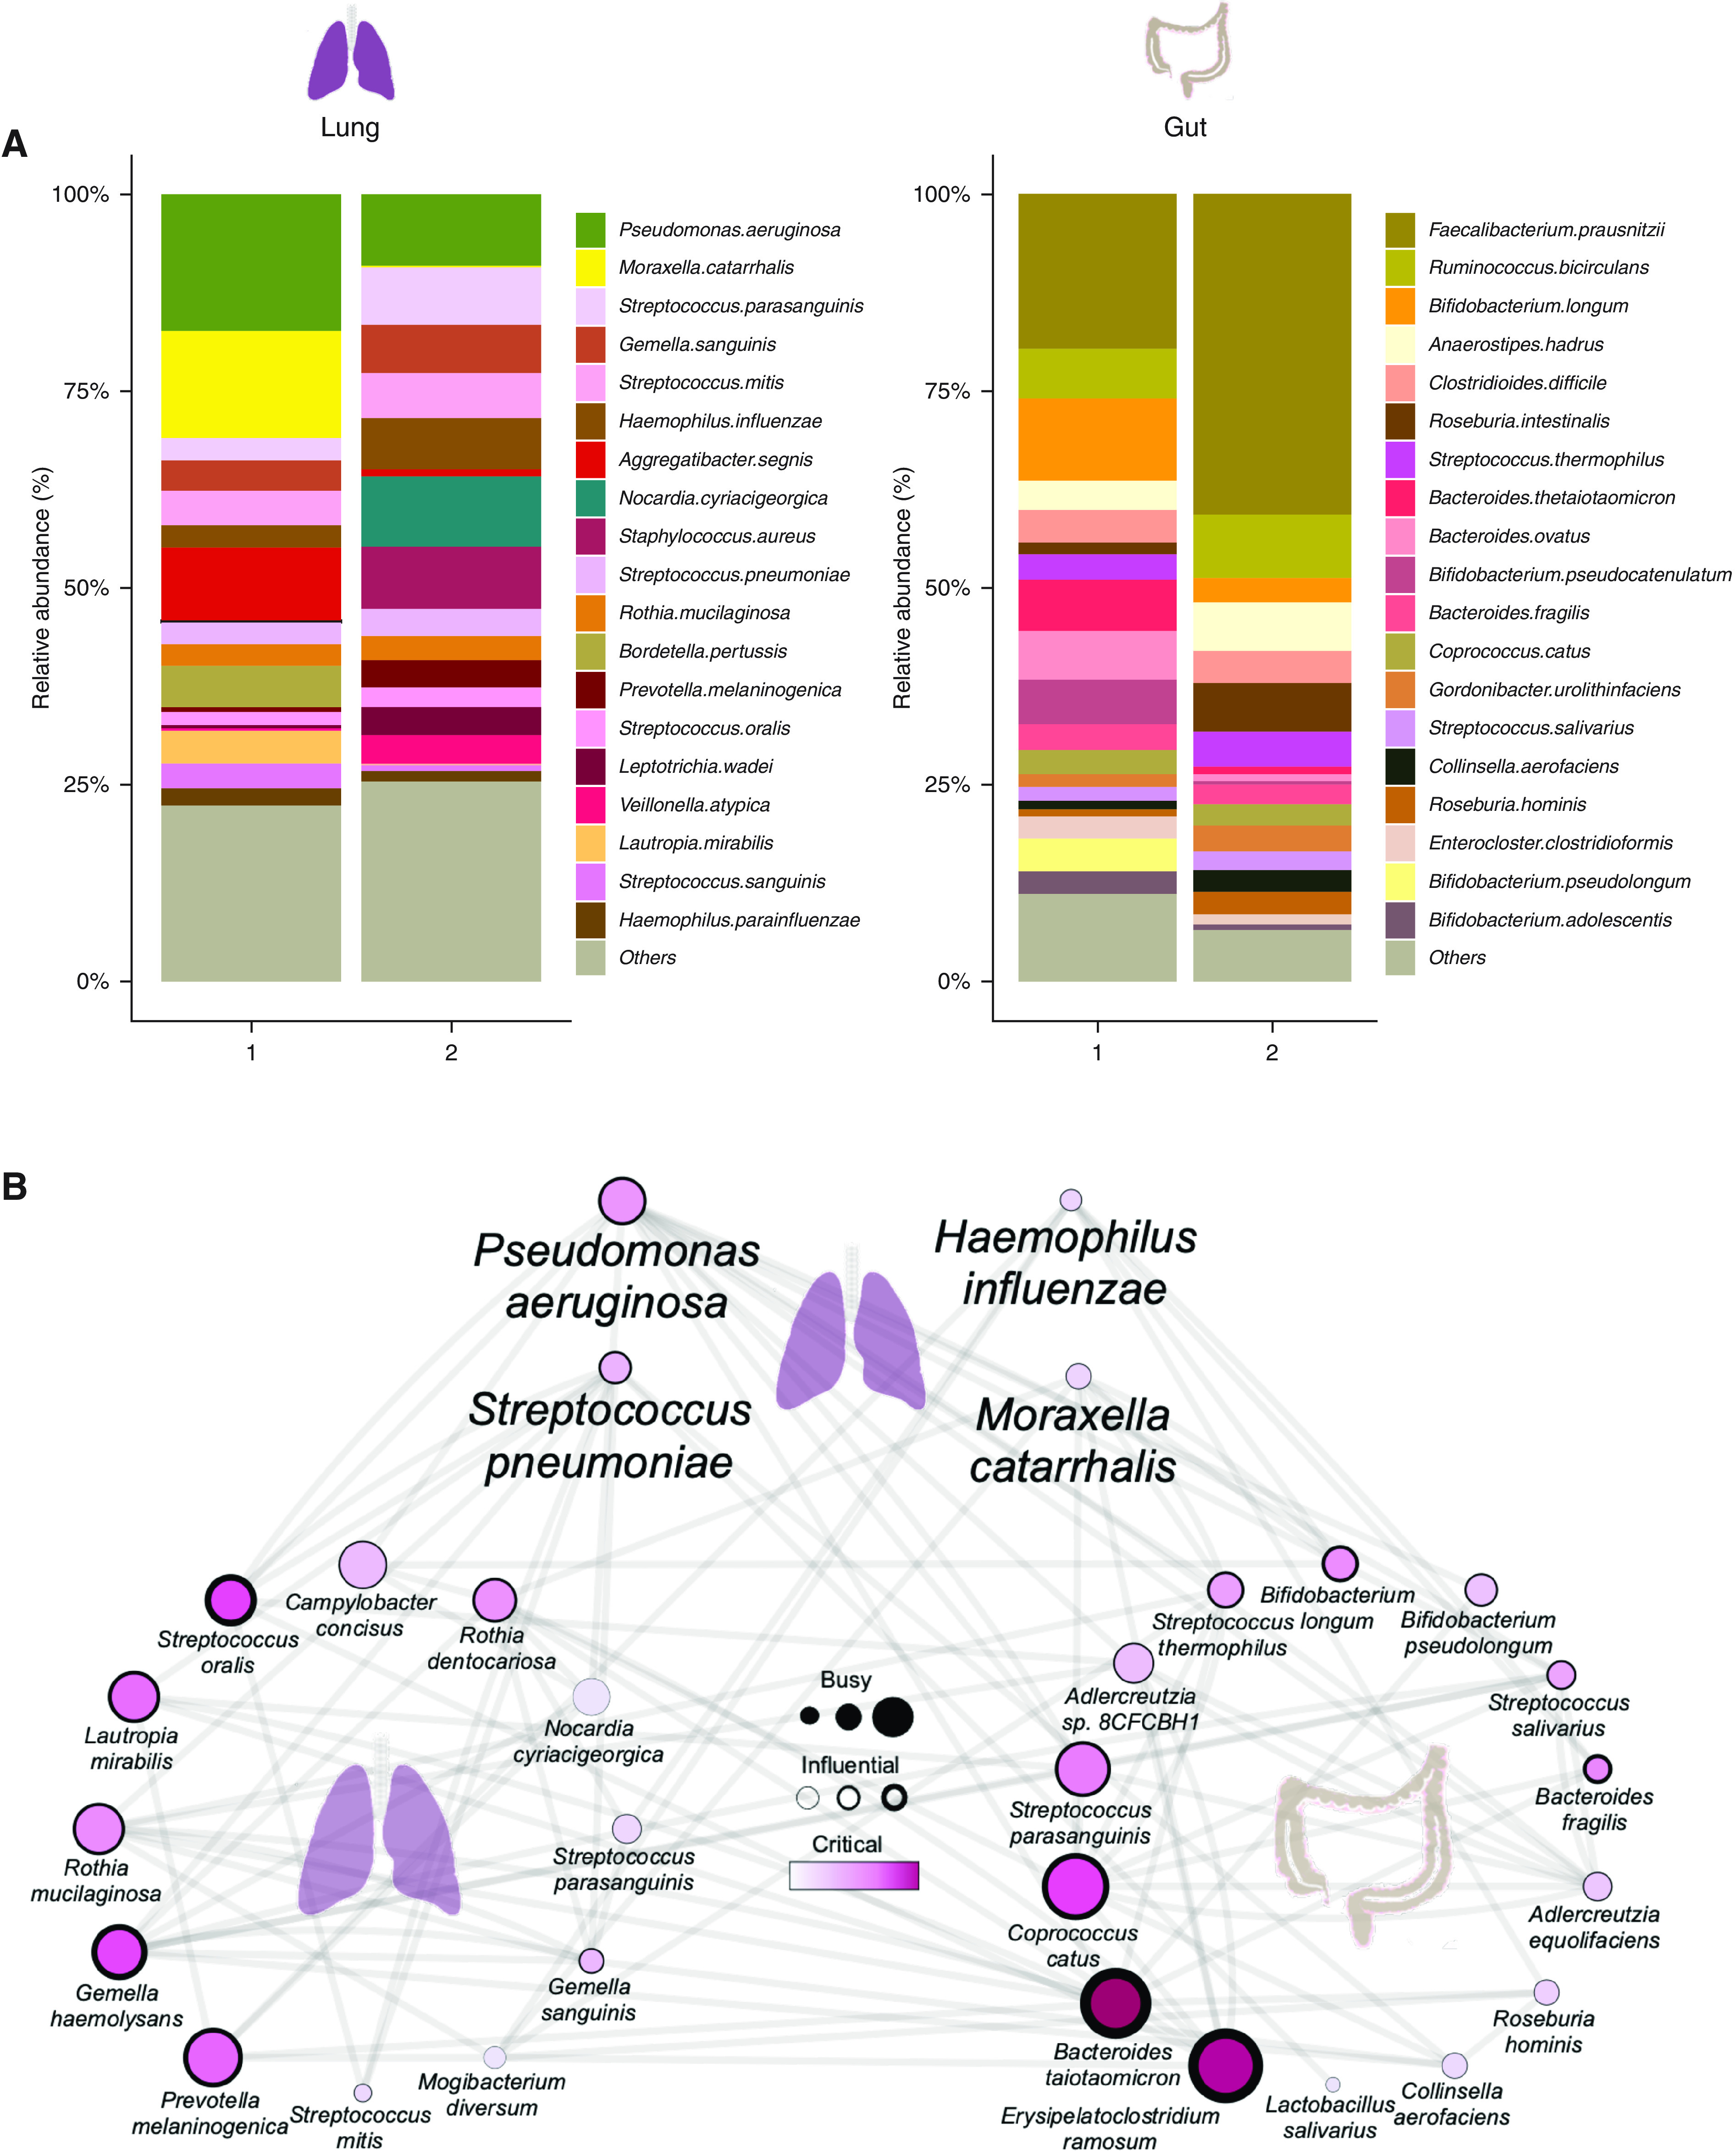
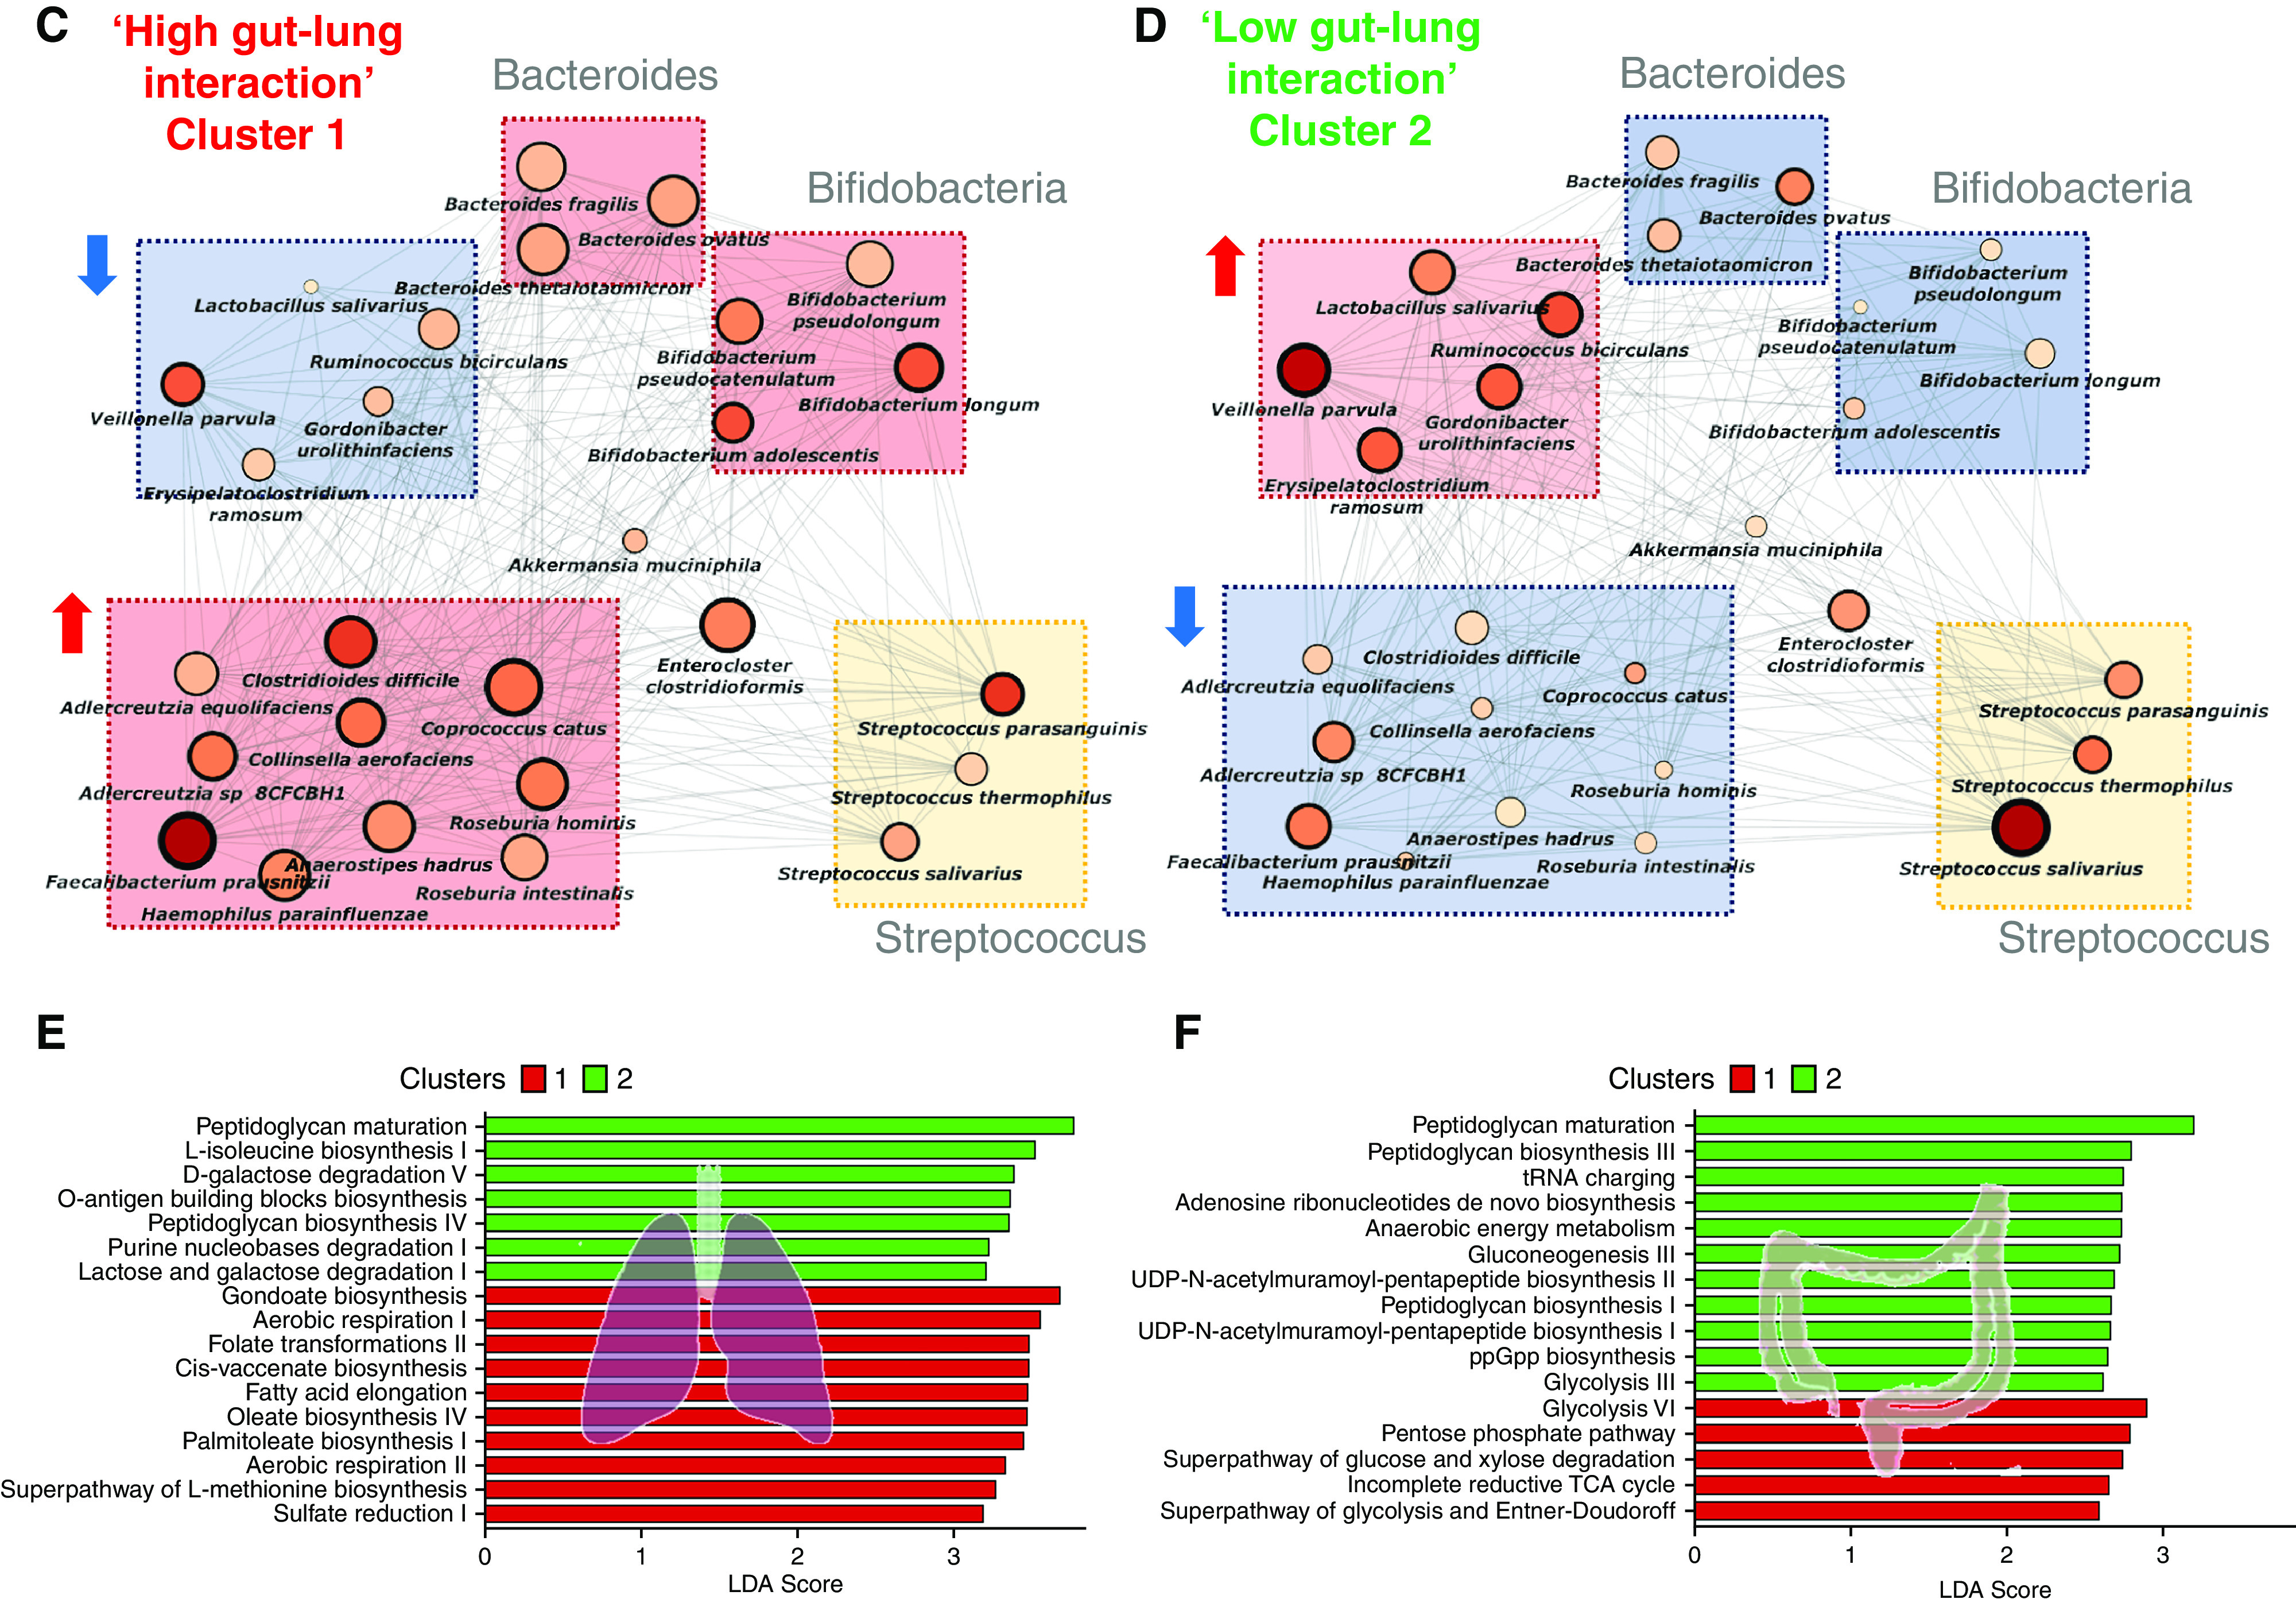
Rationale: Emerging data support the existence of a microbial "gut-lung" axis that remains unexplored in bronchiectasis. Methods: Prospective and concurrent sampling of gut (stool) and lung (sputum) was performed in a cohort of n = 57 individuals with bronchiectasis and subjected to bacteriome (16S rRNA) and mycobiome (18S Internal Transcribed Spacer) sequencing (total, 228 microbiomes). Shotgun metagenomics was performed in a subset (n = 15; 30 microbiomes). Data from gut and lung compartments were integrated by weighted similarity network fusion, clustered, and subjected to co-occurrence analysis to evaluate gut-lung networks. Murine experiments were undertaken to validate specific Pseudomonas-driven gut-lung interactions. Results: Microbial communities in stable bronchiectasis demonstrate a significant gut-lung interaction. Multibiome integration followed by unsupervised clustering reveals two patient clusters, differing by gut-lung interactions and with contrasting clinical phenotypes. A high gut-lung interaction cluster, characterized by lung Pseudomonas, gut Bacteroides, and gut Saccharomyces, is associated with increased exacerbations and greater radiological and overall bronchiectasis severity, whereas the low gut-lung interaction cluster demonstrates an overrepresentation of lung commensals, including Prevotella, Fusobacterium, and Porphyromonas with gut Candida. The lung Pseudomonas-gut Bacteroides relationship, observed in the high gut-lung interaction bronchiectasis cluster, was validated in a murine model of lung Pseudomonas aeruginosa infection. This interaction was abrogated after antibiotic (imipenem) pretreatment in mice confirming the relevance and therapeutic potential of targeting the gut microbiome to influence the gut-lung axis. Metagenomics in a subset of individuals with bronchiectasis corroborated our findings from targeted analyses. Conclusions: A dysregulated gut-lung axis, driven by lung Pseudomonas, associates with poorer clinical outcomes in bronchiectasis.

Keywords: bronchiectasis; gut-lung axis; metagenomics; microbiome; mycobiome.


Figures

Figure 1.
Figure 1.
Overview of the lung and gut microbiome in stable bronchiectasis. (AH) Stacked bar plots represent the (A) bacteriome and (E) mycobiome composition of the lung and gut, respectively. The y-axis represents the relative abundance (%) of microbial taxa (at the genus level) derived using targeted amplicon 16S (bacteria) and Internal Transcribed Spacer (fungal) sequencing approaches applied to sputum (lung) and stool (gut). Paired box plots illustrate (B) bacterial and (F) fungal α-diversity differences between the lung (orange) and gut (black) computed using the Shannon diversity index. Bold lines represent the median diversity, individual dots represent each respective sample, and dotted lines represent the pairing of lung and gut samples (in individual patients). Principal coordinate analysis plots (based on Bray-Curtis dissimilarity) illustrate differences in (C) bacteriome and (G) mycobiome between lung (orange) and gut (black) specimens. Venn diagrams illustrating the overall number of (D) bacterial and (H) fungal genera identified in lung and gut compartments, respectively, with intersections demonstrating overlapping taxa between compartments. ***P < 0.001. ns = nonsignificant; PC 1 = principal coordinates 1; PC 2 = principal coordinates 2.
Figure 2.
Figure 2.
The gut-lung interactome allows patient stratification in stable bronchiectasis. (AD) In (A): an overview of the analytical approach to evaluating the gut-lung axis in bronchiectasis. The computational workflow implemented in this study includes the application of co-occurrence analysis using the generalized boosted linear model (GBLM) to bacteriome and mycobiome profiles derived from lung and gut compartments, respectively, to obtain the gut-lung interactome network. Four multibiomes were integrated using wSNF followed by spectral clustering to derive unsupervised patient groups. Differentially abundant taxa between clusters are evaluated using LEfSe and clinical evaluation of the respective clusters performed. Cluster-specific interactome networks were generated using the GBLM, and network plots illustrating interactions (as edges) between microbes (indicated as individual nodes) are illustrated for (B) the overall study cohort, (C) cluster 1, and (D) cluster 2, respectively. Only significantly correlated interactions (i.e., P < 0.001) are illustrated. Gut-lung interactions are represented by pink lines (edges). Microbes within gut-lung networks are classified as busy (i.e., node degree: microbes with a higher number of direct interactions with other microbes), critical (i.e., stress centrality: microbes that are key to maintaining the network’s integrity), and/or influential (i.e., betweenness centrality: microbes that influence other microbes within the network, including indirectly), and those with the highest calculated network metrics are highlighted by size, width, and node coloration, respectively, in the presented network plots (7). ITS = internal transcribed spacer; LEfSe = Linear discriminant analysis Effect Size; wSNF = weighted similarity network fusion.
Figure 3.
Figure 3.
Clinical and microbiome differences between gut-lung interactome–defined patient clusters. (AD) Box plots illustrating differences in (A) exacerbation frequency, (B) disease severity (as FACED [FEV1, age, chronic colonization, extension, and dyspnea] score) (48) and (C) radiological severity (as Reiff score) (49) between the derived identified patient clusters. Cluster 1 (high gut-lung interaction) is indicated in red, and cluster 2 (low gut-lung interaction) is indicated in green, as derived by spectral clustering of integrated gut-lung multibiomes. (D) Bar plots representing differentially abundant bacterial (light pink) and fungal (dark green) taxa of the lung (top) and gut (bottom) between the high and low gut-lung interaction clusters. Significantly increased taxa in cluster 1 (high gut-lung interaction) and cluster 2 (low gut-lung interaction) are highlighted as red and green bars, respectively. The x-axis represents the linear discriminant analysis (LDA) score, and the y-axis significant taxa with LDA score > 0. *P < 0.05; **P < 0.01. ns = nonsignificant.
Figure 4.
Figure 4.
Assessment of gut microbiome dynamics in a murine model of lung Pseudomonas aeruginosa (PAO1) infection. (A) Schematic illustration of the overall experimental design. Twenty-four mice were subjected to four experimental treatment arms (n = 6 per arm). Mice received either a saline control (1 + 2) or antibiotic treatment (imipenem) (3 + 4) by oral gavage for 2 days before either intratracheal delivery of normal saline (1 + 3) or PAO1 inoculation (2 + 4). Bacteriome and mycobiome profiles were characterized by 16S and ITS sequencing approaches derived from fecal pellets obtained at the experimental endpoint (day 5). In addition, assessment of bacteriome and mycobiome profiles pre- and postantibiotic treatment on day 0 and day 2 in treatment arm 3 (indicated by red asterisk) was performed. (B and C) Stacked bar plots illustrate the (B) gut bacteriome and (C) gut mycobiome composition in all four experimental arms (day 5). (D and E) Network plots illustrating key taxa from the mouse gut interactome splitting organisms (D) affected by PAO1 infection independent of antibiotic (imipenem) pretreatment to those (E) affected by PAO1 infection and abrogated by antibiotic (imipenem) pretreatment (see also Figure E7). Microbial genera are represented as nodes indicated as busy (i.e., node degree: microbes with a higher number of direct interactions with other microbes), critical (i.e., stress centrality: microbes key to maintaining the network’s integrity), and/or influential (i.e., betweenness centrality: microbes that influence other microbes within the network, including indirectly), and these network metrics are highlighted by size, width, and node coloration, respectively, in the presented network plots (7). WT = wild-type.
Figure 5.
Figure 5.
Metagenomic analysis of the gut-lung axis in bronchiectasis. (A) Stacked bar plots illustrating species-level classification of lung (left) and gut (right) microbiome relative-abundance profiles derived by metagenomic sequencing in high (cluster 1, n = 7) and low (cluster 2, n = 8) gut-lung interaction groups. (B) GBLM-derived networks illustrating four key bronchiectasis (bacterial) pathogens and their interactions with other microbes within the bronchiectasis gut-lung interactome. Microbial interactions (edges) are represented as lines (gray), and species as nodes are indicated as busy (i.e., node degree: microbes with a higher number of direct interactions with other microbes), critical (i.e., stress centrality: microbes key to maintaining the network’s integrity), and/or influential (i.e., betweenness centrality: microbes that influence other microbes within the network, including indirectly), and network metrics are highlighted by size, width, and node coloration, respectively, in the presented network plots (7). (C and D) Correlation-based co-occurrence analysis illustrating cluster-based gut microbiome network conformation of the (C) high gut-lung interaction (cluster 1) and (D) low gut-lung interaction (cluster 2), respectively. Species are grouped according to their observed genus-level differential network connectivity within clusters. Genera with three or more representative species-level members (i.e., Bacteroides, Bifidobacteria, and Streptococcus) are highlighted by colored rectangles indicating their respective increased (red), decreased (blue), or neutral (yellow) genus-level network connectivity between clusters. (E and F) Horizontal bar plots illustrating differentially abundant microbial pathways (linear discriminant analysis [LDA] score >2.5) between the high (cluster 1) and low (cluster 2) gut-lung interaction groups in the (E) lung and (F) gut, respectively. The x-axis represents the discriminative score (LDA score), and the y-axis represents specific microbial pathways.
Figure 5.
Figure 5.
Metagenomic analysis of the gut-lung axis in bronchiectasis. (A) Stacked bar plots illustrating species-level classification of lung (left) and gut (right) microbiome relative-abundance profiles derived by metagenomic sequencing in high (cluster 1, n = 7) and low (cluster 2, n = 8) gut-lung interaction groups. (B) GBLM-derived networks illustrating four key bronchiectasis (bacterial) pathogens and their interactions with other microbes within the bronchiectasis gut-lung interactome. Microbial interactions (edges) are represented as lines (gray), and species as nodes are indicated as busy (i.e., node degree: microbes with a higher number of direct interactions with other microbes), critical (i.e., stress centrality: microbes key to maintaining the network’s integrity), and/or influential (i.e., betweenness centrality: microbes that influence other microbes within the network, including indirectly), and network metrics are highlighted by size, width, and node coloration, respectively, in the presented network plots (7). (C and D) Correlation-based co-occurrence analysis illustrating cluster-based gut microbiome network conformation of the (C) high gut-lung interaction (cluster 1) and (D) low gut-lung interaction (cluster 2), respectively. Species are grouped according to their observed genus-level differential network connectivity within clusters. Genera with three or more representative species-level members (i.e., Bacteroides, Bifidobacteria, and Streptococcus) are highlighted by colored rectangles indicating their respective increased (red), decreased (blue), or neutral (yellow) genus-level network connectivity between clusters. (E and F) Horizontal bar plots illustrating differentially abundant microbial pathways (linear discriminant analysis [LDA] score >2.5) between the high (cluster 1) and low (cluster 2) gut-lung interaction groups in the (E) lung and (F) gut, respectively. The x-axis represents the discriminative score (LDA score), and the y-axis represents specific microbial pathways.

Comment in

  • How to Understand a Revolution: Guts, Lungs, and Bronchiectasis.
    Drohan CM, Molyneaux PL, Dickson RP. Drohan CM, et al. Am J Respir Crit Care Med. 2023 Apr 1;207(7):812-814. doi: 10.1164/rccm.202211-2179ED. Am J Respir Crit Care Med. 2023. PMID: 36473273 Free PMC article. No abstract available.
  • The Potential Role of Gastric Microbiology in Respiratory Disease.
    Ward C, Al Momani H, McDonnell MJ, Murphy DM, Walsh L, Mac Sharry J, Griffin M, Forrest IA, Jones R, Krishnan A, Pearson J, Rutherford RM. Ward C, et al. Am J Respir Crit Care Med. 2023 Sep 1;208(5):630-631. doi: 10.1164/rccm.202303-0366LE. Am J Respir Crit Care Med. 2023. PMID: 37348122 Free PMC article. No abstract available.

References

    1. Young VB. The role of the microbiome in human health and disease: an introduction for clinicians. BMJ . 2017;356:j831. - PubMed
    1. Huang YJ, Nariya S, Harris JM, Lynch SV, Choy DF, Arron JR, et al. The airway microbiome in patients with severe asthma: associations with disease features and severity. J Allergy Clin Immunol . 2015;136:874–884. - PMC - PubMed
    1. Layeghifard M, Li H, Wang PW, Donaldson SL, Coburn B, Clark ST, et al. Microbiome networks and change-point analysis reveal key community changes associated with cystic fibrosis pulmonary exacerbations. NPJ Biofilms Microbiomes . 2019;5:4. - PMC - PubMed
    1. Sze MA, Dimitriu PA, Hayashi S, Elliott WM, McDonough JE, Gosselink JV, et al. The lung tissue microbiome in chronic obstructive pulmonary disease. Am J Respir Crit Care Med . 2012;185:1073–1080. - PMC - PubMed
    1. Tiew PY, Mac Aogáin M, Chotirmall SH. The current understanding and future directions for sputum microbiome profiling in chronic obstructive pulmonary disease. Curr Opin Pulm Med . 2022;28:121–133. - PubMed

Publication types

Substances