. 2022 Oct 26;17(10):e0275466.
doi: 10.1371/journal.pone.0275466. eCollection 2022.

U.S. state policy contexts and mortality of working-age adults

Affiliations

U.S. state policy contexts and mortality of working-age adults

Jennifer Karas Montez et al. PLoS One. .

Abstract

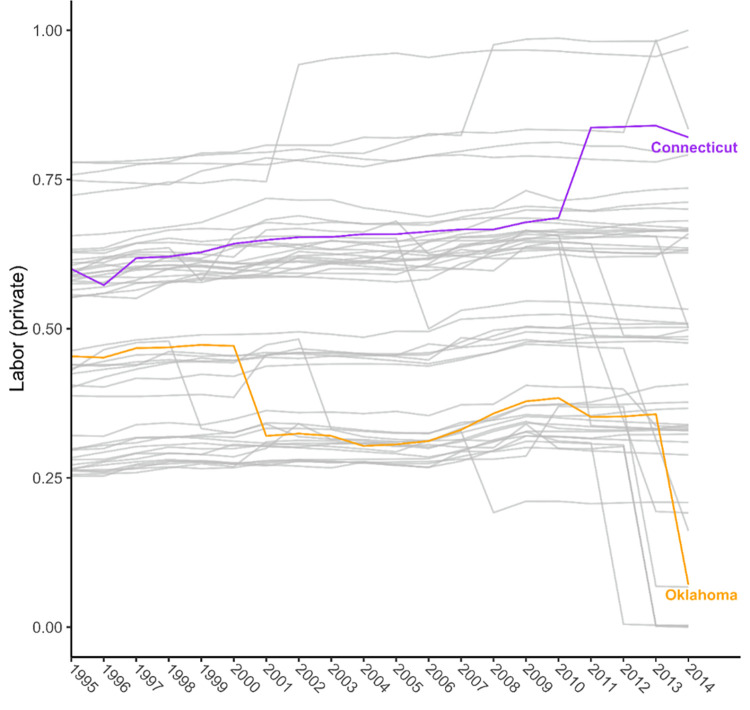
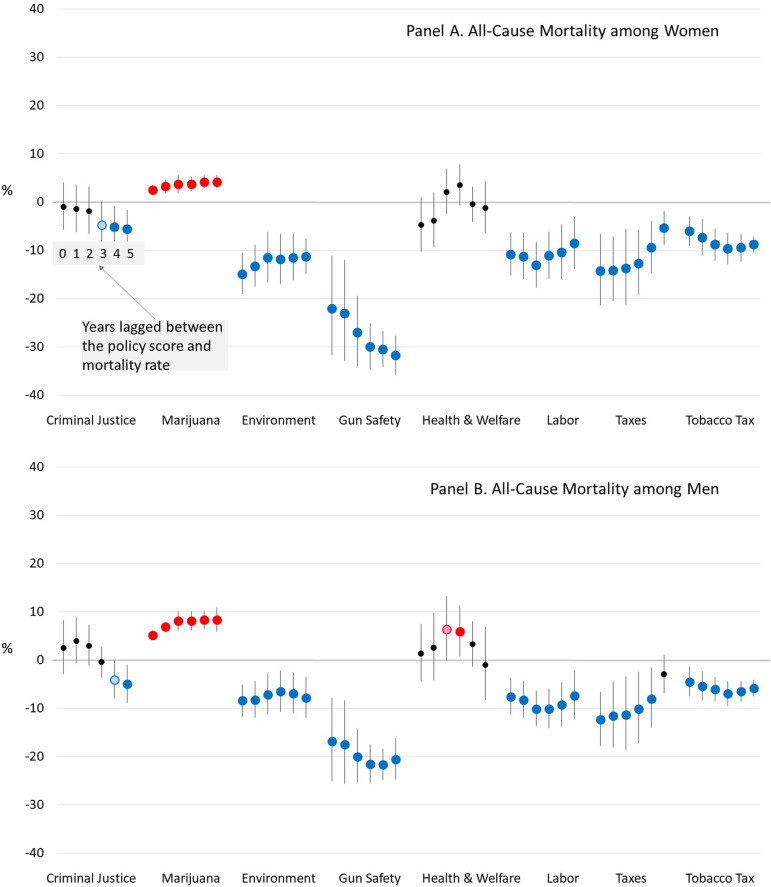
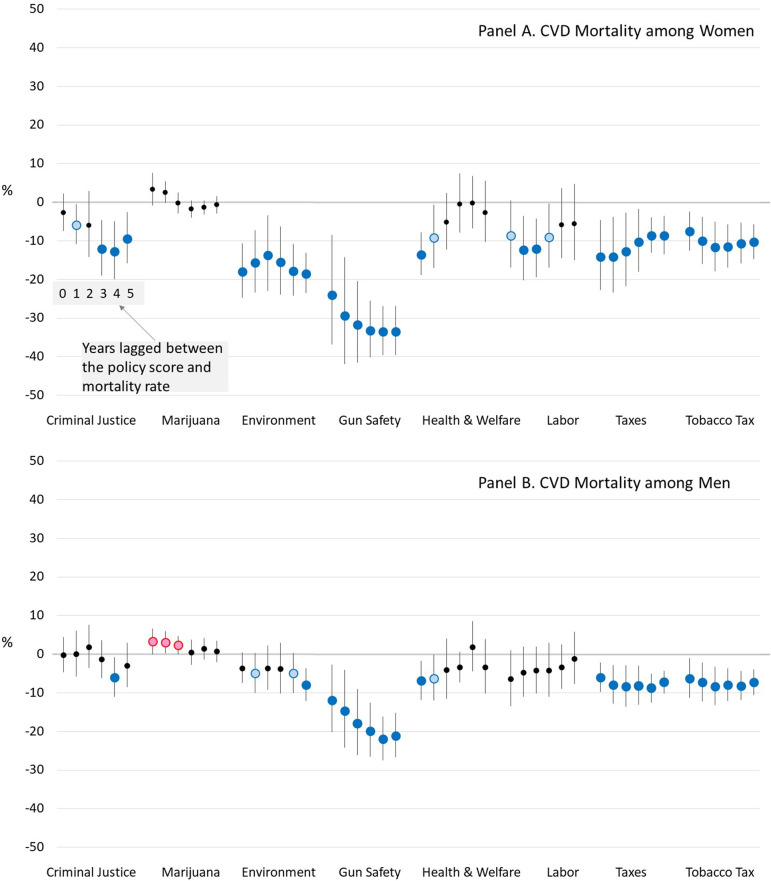
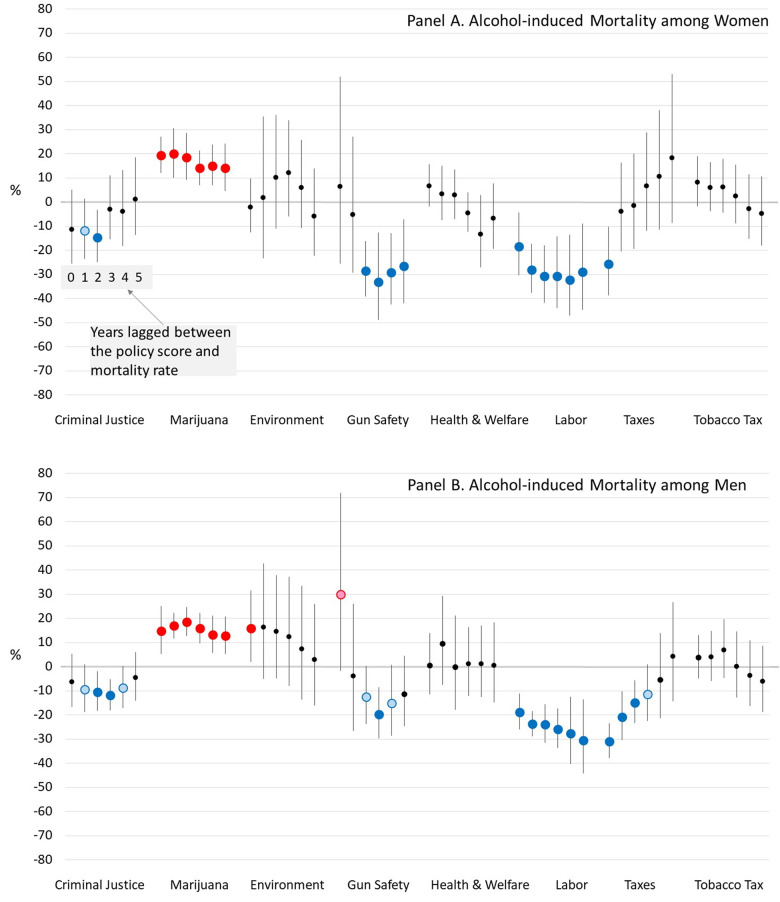
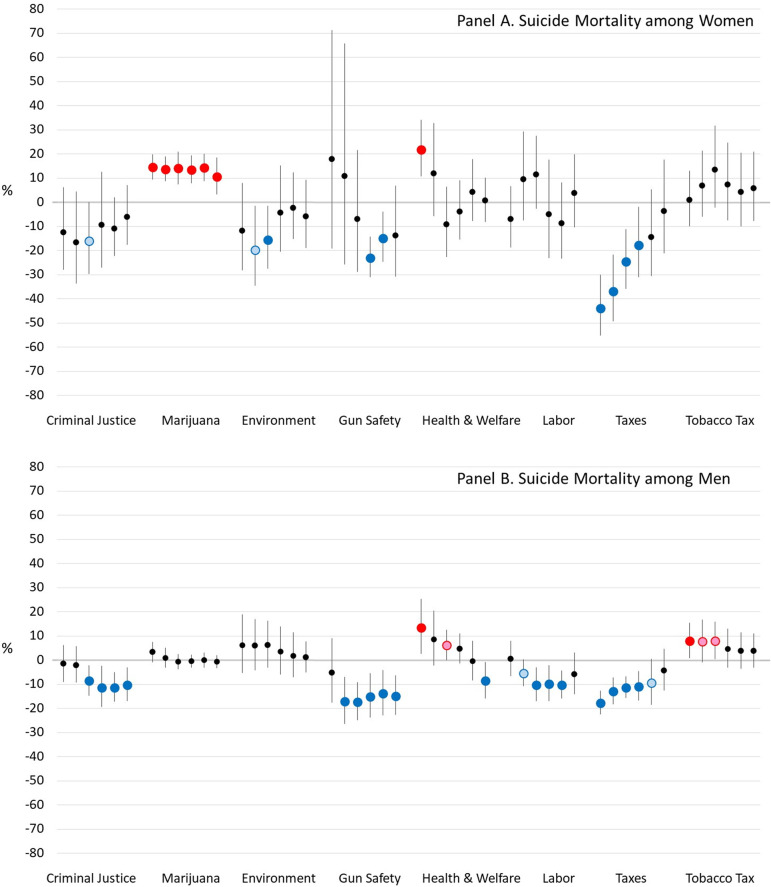
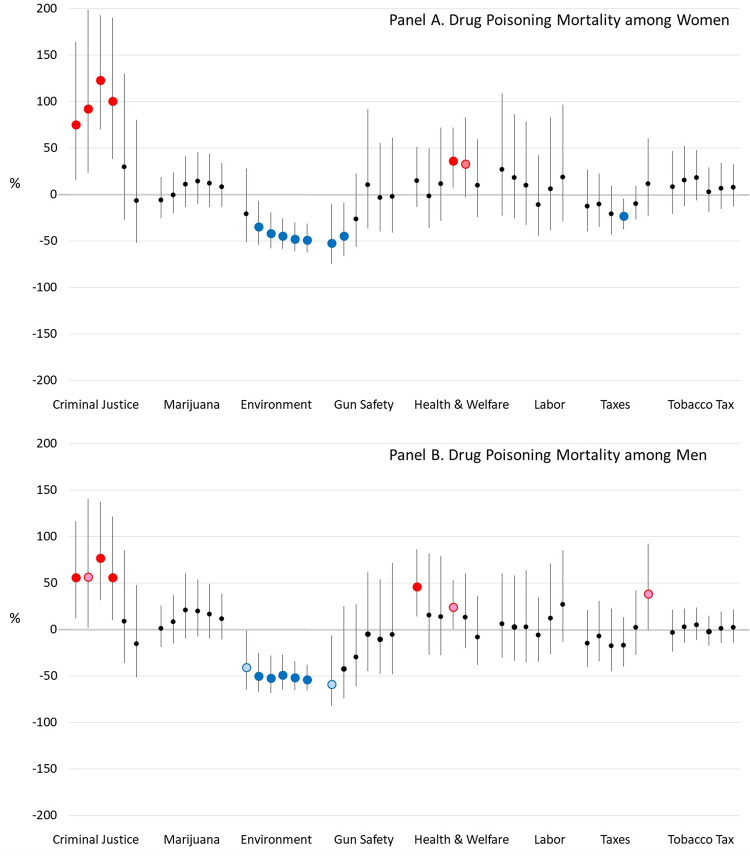
The rise in working-age mortality rates in the United States in recent decades largely reflects stalled declines in cardiovascular disease (CVD) mortality alongside rising mortality from alcohol-induced causes, suicide, and drug poisoning; and it has been especially severe in some U.S. states. Building on recent work, this study examined whether U.S. state policy contexts may be a central explanation. We modeled the associations between working-age mortality rates and state policies during 1999 to 2019. We used annual data from the 1999-2019 National Vital Statistics System to calculate state-level age-adjusted mortality rates for deaths from all causes and from CVD, alcohol-induced causes, suicide, and drug poisoning among adults ages 25-64 years. We merged that data with annual state-level data on eight policy domains, such as labor and taxes, where each domain was scored on a 0-1 conservative-to-liberal continuum. Results show that the policy domains were associated with working-age mortality. More conservative marijuana policies and more liberal policies on the environment, gun safety, labor, economic taxes, and tobacco taxes in a state were associated with lower mortality in that state. Especially strong associations were observed between certain domains and specific causes of death: between the gun safety domain and suicide mortality among men, between the labor domain and alcohol-induced mortality, and between both the economic tax and tobacco tax domains and CVD mortality. Simulations indicate that changing all policy domains in all states to a fully liberal orientation might have saved 171,030 lives in 2019, while changing them to a fully conservative orientation might have cost 217,635 lives.


Conflict of interest statement

The authors have declared that no competing interests exist.

Figures

Fig 1
Fig 1. Trends in liberalism scores for private labor policies by U.S. State, 1995–2014.
The figure contains a line for every state. Scores range from 0 to 1 on a conservative to liberal continuum.
Fig 2
Fig 2. Estimated percent difference in all-cause mortality rates when a U.S. State’s policy liberalism score is 1 versus 0, for various lag times between the policies and mortality.
Notes: Blue dots mean a more liberal version of the policy is associated with lower mortality and red dots mean a more conservative version is associated with lower mortality. Dark blue and red dots indicate that the association is significant at α<0.05, while light blue and red dots indicate that it is significant at α<0.10.
Fig 3
Fig 3. Estimated percent difference in cardiovascular mortality rates when a U.S. State’s policy liberalism score is 1 versus 0, for various lag times between the policies and mortality.
Notes: Blue dots mean a more liberal version of the policy is associated with lower mortality and red dots mean a more conservative version is associated with lower mortality. Dark blue and red dots indicate that the association is significant at α<0.05, while light blue and red dots indicate that it is significant at α<0.10.
Fig 4
Fig 4. Estimated percent difference in alcohol-induced mortality rates when a U.S. State’s policy liberalism score is 1 versus 0, for various lag times between the policies and mortality.
Notes: Blue dots mean a more liberal version of the policy is associated with lower mortality and red dots mean a more conservative version is associated with lower mortality. Dark blue and red dots indicate that the association is significant at α<0.05, while light blue and red dots indicate that it is significant at α<0.10.
Fig 5
Fig 5. Estimated percent difference in suicide mortality rates when a U.S. State’s policy liberalism score is 1 versus 0, for various lag times between the policies and mortality.
Notes: Blue dots mean a more liberal version of the policy is associated with lower mortality and red dots mean a more conservative version is associated with lower mortality. Dark blue and red dots indicate that the association is significant at α<0.05, while light blue and red dots indicate that it is significant at α<0.10.
Fig 6
Fig 6. Estimated percent difference in drug poisoning mortality rates when a U.S. State’s policy liberalism score is 1 versus 0, for various lag times between the policies and mortality.
Notes: Blue dots mean a more liberal version of the policy is associated with lower mortality and red dots mean a more conservative version is associated with lower mortality. Dark blue and red dots indicate that the association is significant at α<0.05, while light blue and red dots indicate that it is significant at α<0.10.

References

    1. The World Bank. Life Expectancy at Birth (Total Years): Available from https://data.worldbank.org/indicator/SP.DYN.LE00.IN; 2022.
    1. Tejada-Vera B, Salant B, Bastian B, Arias E. U.S. Life Expectancy by State and Sex for 2019. National Center for Health Statistics: Available from https://www.cdc.gov/nchs/data-visualization/state-life-expectancy/index_...; 2022.
    1. Ho JY. Mortality under age 50 accounts for much of the fact that US life expectancy lags that of other high-income countries. Health Aff (Millwood). 2013;32(3):459–67. doi: 10.1377/hlthaff.2012.0574 - DOI - PubMed
    1. National Academies of Sciences, Engineering, and Medicine. High and Rising Mortality Rates Among Working-Age Adults. Washington, DC: The National Academies Press; 2021. - PubMed
    1. National Research Council. Explaining Divergent Levels of Longevity in High-Income Countries. Crimmins EM, Preston SH, Cohen B, editors. Washington DC: The National Academies Press; 2011. - PubMed

Publication types

LinkOut - more resources