. 2022 Oct 25;41(4):111538.
doi: 10.1016/j.celrep.2022.111538.

A multienzyme S-nitrosylation cascade regulates cholesterol homeostasis

Affiliations

A multienzyme S-nitrosylation cascade regulates cholesterol homeostasis

Colin T Stomberski et al. Cell Rep. .

Abstract

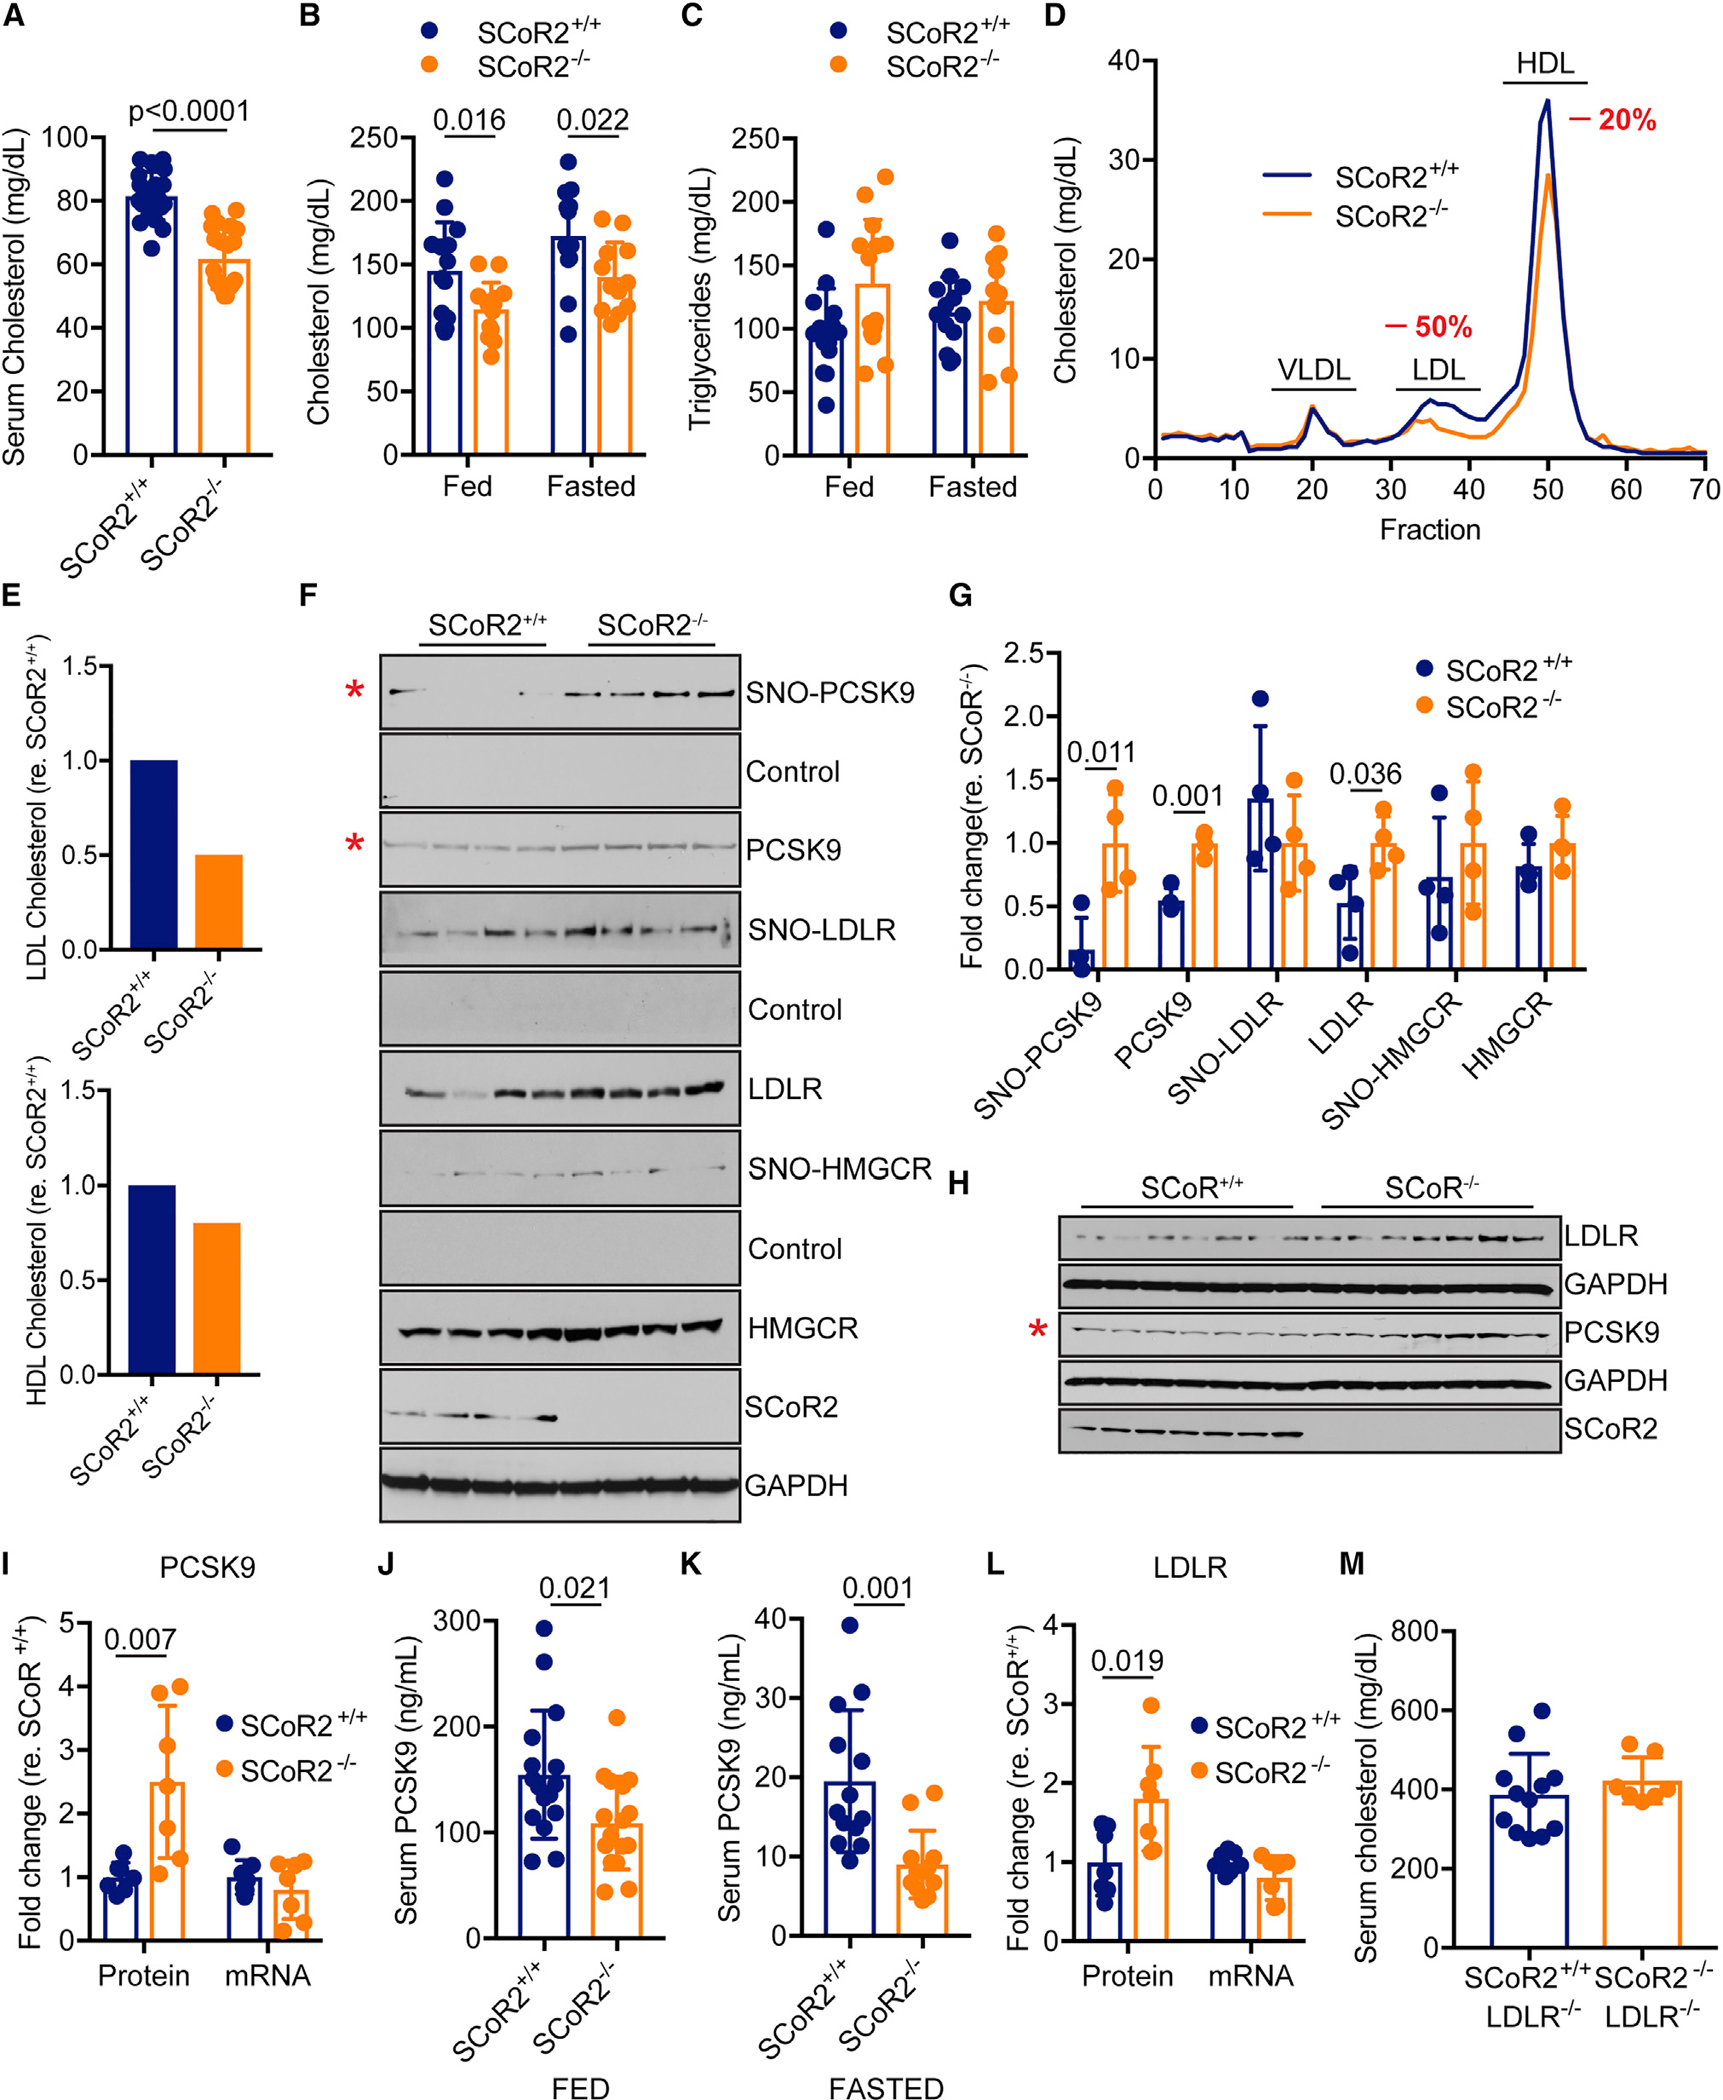
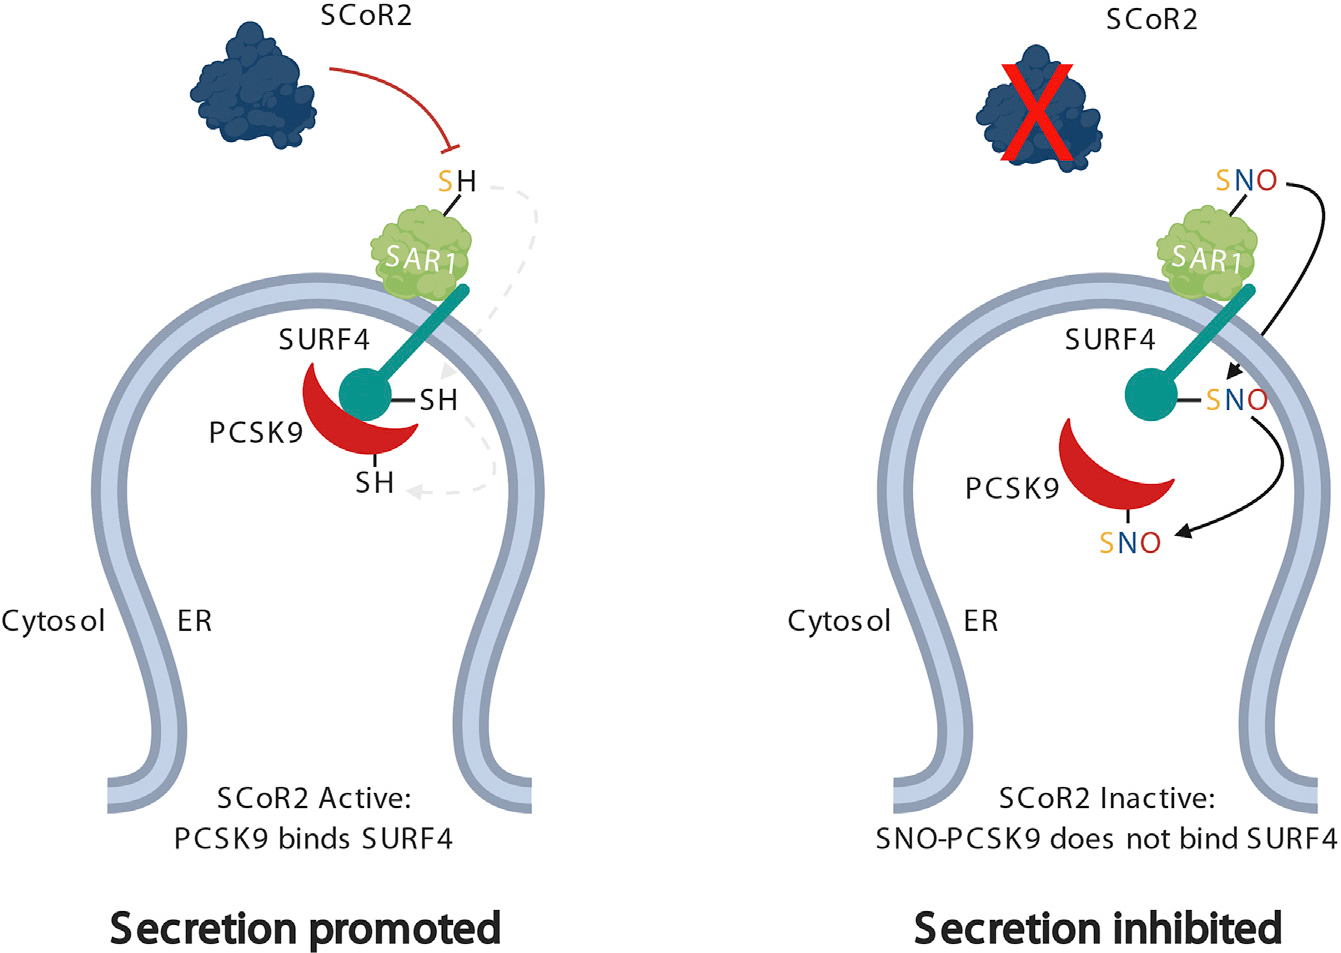
Accumulating evidence suggests that protein S-nitrosylation is enzymatically regulated and that specificity in S-nitrosylation derives from dedicated S-nitrosylases and denitrosylases that conjugate and remove S-nitrosothiols, respectively. Here, we report that mice deficient in the protein denitrosylase SCoR2 (S-nitroso-Coenzyme A Reductase 2; AKR1A1) exhibit marked reductions in serum cholesterol due to reduced secretion of the cholesterol-regulating protein PCSK9. SCoR2 associates with endoplasmic reticulum (ER) secretory machinery to control an S-nitrosylation cascade involving ER cargo-selection proteins SAR1 and SURF4, which moonlight as S-nitrosylases. SAR1 acts as a SURF4 nitrosylase and SURF4 as a PCSK9 nitrosylase to inhibit PCSK9 secretion, while SCoR2 counteracts nitrosylase activity by promoting PCSK9 denitrosylation. Inhibition of PCSK9 by an NO-based drug requires nitrosylase activity, and small-molecule inhibition of SCoR2 phenocopies the PCSK9-mediated reductions in cholesterol observed in SCoR2-deficient mice. Our results reveal enzymatic machinery controlling cholesterol levels through S-nitrosylation and suggest a distinct treatment paradigm for cardiovascular disease.

Keywords: COPII; CP: Metabolism; CP: Molecular biology; PCSK9; denitrosylation; hypercholesterolemia; nitric oxide; nitrosylase cascade; transnitrosylation.


Conflict of interest statement

Declaration of interests J.S.S. and C.T.S. have patents that relate to discoveries herein. J.S.S. is a co-founder of SNO bio, which develops SNO-based technologies, and serves as a consultant and has an equity stake in NNOXX, a company that is developing NO-related technology.

Figures

Figure 1.
Figure 1.. SCoR2−/− mice display LDLR-dependent hypocholesterolemia and low serum PCSK9 levels
(A) Total serum cholesterol from overnight-fasted 12-week-old male SCoR2+/+ (n = 20) and SCoR2−/− mice (n = 21). (B and C) Total serum cholesterol (B) and serum triglycerides (C) from unfasted and overnight-fasted 24-week-old male SCoR2+/+ (n = 14 for unfasted, n = 13 for fasted) and SCoR2−/− mice (n = 14 for unfasted, n = 12 for fasted). (D) Serum from 24-week-old unfasted male SCoR2+/+ mice (n = 7) and SCoR2−/− mice (n = 7) were each pooled, then separated by fast protein liquid chromatography to observe lipoprotein fractions. Lipoproteins were identified compared with known standards. (E) Graphical representation of the change in LDL (top) and HDL (bottom) cholesterol fractions from pooled samples in (D). (F) Western blot analysis of PCSK9, LDLR, and HMGCR S-nitrosylation status (SNO) in livers from unfasted 24-week-old male SCoR2+/+ and SCoR2−/− mice. *Denotes the mature, processed form of PCSK9. Control: SNO-RAC assay performed without ascorbate. (G) Quantification (n = 4) of bands from (F). SNO-proteins were normalized to total protein for each lane and total protein was normalized to GAPDH prior to analysis. Representative SCoR2 and GAPDH blots are shown in (F). (H) Western blot analysis for hepatic LDLR and PCSK9 from unfasted 24-week-old male SCoR2+/+ and SCoR2−/− mice. *Denotes the mature, processed form of PCSK9. (I) Quantification (n = 7) of PCSK9 protein levels from (H) and quantitative real-time PCR analysis (n = 7) of hepatic PCSK9 mRNA from the same tissue. (J and K) Serum PCSK9 from unfasted (J) and overnight-fasted (K) 24-week-old male SCoR2+/+ (n = 16 for unfasted, n = 13 for fasted) and SCoR2−/− (n = 16 for unfasted, n = 12 for fasted) mice. (L) Quantification (n = 7) of LDLR protein levels from (H) and quantitative real-time PCR analysis (n = 7) of hepatic LDLR mRNA from the same tissue. (M) Total serum cholesterol from unfasted 16-week-old male SCoR2+/+/LDLR−/− (n = 12) and SCoR2−/−/LDLR−/− mice (n = 7). See also Figures S1 and S2. In all figures, all bars represent mean ± SD, and all bands were quantified using ImageJ. p values in all figures were calculated by Student’s t test (unless noted otherwise).
Figure 2.
Figure 2.. SCoR2 regulates S-nitrosylation of PCSK9 and its cargo-selection machinery to control secretion
(A) Western blot analysis of SNO-PCSK9 in HepG2 cells stably expressing control or SCoR2-targeting shRNA. *Denotes the mature, processed form of PCSK9. (B) Quantification (n = 3) of SNO-PCSK9 from (A) and related experiments. (C) Western blot analysis for cellular and secreted (media) PCSK9 in HepG2 cells stably expressing control or SCoR2-targeting shRNA. An equal number of cells were cultured for 24 h in serum-free Opti-MEM media, washed with PBS, given fresh (PCSK9-free) Opti-MEM, and harvested after 3 h. *Denotes the mature, processed form of PCSK9. (D) Quantification (n = 6) of cellular PCSK9 (left; mature PCSK9 normalized to GAPDH input) and secreted (media) PCSK9 (right; normalized to mature PCSK9 band) from (C) and related experiments. (E) Western blot analysis for LDLR in HepG2 cells stably expressing control or SCoR2-targeting shRNA. (F) Quantification (n = 3) of LDLR from (E). Total LDLR was normalized to GAPDH input. (G) Western blot analysis of SNO-PCSK9 in SCoR2-deficient HEK293 cells transiently reconstituted with SCoR2. Upper band: pro-PCSK9; lower band: mature PCSK9. (H) Quantification (n = 3) of SNO-PCSK9 from (G). (I) Western blot analysis for cellular and secreted (media) PCSK9 in SCoR2-deficient HEK293 cells transiently reconstituted with SCoR2. An equal number of cells were cultured for 24 h in serum-free Opti-MEM media, washed with PBS, given fresh (PCSK9-free) Opti-MEM, and harvested after 90 min. Upper band: pro-PCSK9; lower band: mature PCSK9. (J) Quantification (n = 3) of secreted (media) PCSK9 (normalized to mature PCSK9 band) from (I). (K) Western blot analysis of SNO-SAR1A/B, SNO-SURF4, and SNO-SEC24A in SCoR2-deficient HEK293 cells with or without reconstitution of SCoR2. V5-tagged SURF4 was overexpressed in both conditions and anti-V5 antibody used to visualize SURF4. (L) Quantification (n = 3) of SNO-SAR1A/B (normalized to total SAR1A/B), SNO-SURF4 (normalized to total SURF4), and SNO-SEC24A (normalized to total SEC24A) from (K). Note SCoR2 and GAPDH immunoblots are shared between (G) and (K), as they are from the same experiment. (M) Western blot analysis of SEC23A and SAR1A/B S-nitrosylation status in livers from unfasted 24-week-old SCoR2+/+ and SCoR2−/− mice. (N) Quantification (n = 4) of bands from (M). SNO-protein was normalized to total protein for each lane and total protein was normalized to GAPDH prior to analysis. (O) Representative western blot analysis of SNO-SAR1A/B in HepG2 cells stably expressing control or SCoR2-targeting shRNA. (P) Quantification (n = 6) of SNO-SAR1A/B (normalized to total SAR1A/B) from (O). (Q) Western blot analysis of hepatic SEC24A and SURF4 from unfasted 24-week-old male SCoR2+/+ and SCoR2−/− mice. Note, SNO-SEC24A and SNO-SURF4 were assayed but no signal was detected. (R) Quantification (n = 7) of bands from (Q). Total target protein was normalized to GAPDH. In the above panels, SNO-proteins were captured from cell lysates by SNO-RAC, separated by SDS-PAGE, and analyzed by western blot. Control: SNO-RAC assay for SNO-proteins performed without ascorbate. See also Figure S3.
Figure 3.
Figure 3.. S-nitrosylase cascade initiated by SAR1A/B regulates PCSK9 S-nitrosylation and secretion
(A) SAR1B nitrosylates SURF4. FLAG-tagged SNO-SAR1B was incubated with V5-tagged SURF4. Reaction mixtures were subjected to SNO-RAC and SNO-proteins visualized by western blot. Representative image (n = 3) is shown. (B) SURF4 nitrosylates PCSK9. V5-tagged SNO-SURF4 was incubated with FLAG-tagged PCSK9. Reaction mixtures were subjected to SNO-RAC and SNO-proteins visualized by western blot. Representative image (n = 3) is shown. Mature PCSK9 is visualized in SNO-PCSK9 lanes. (C) Western blot analysis of SNO-PCSK9 and SNO-SAR1B in SCoR2-deficient HEK293 transfected with wild-type PCSK9 and wild-type SAR1B and treated with 200 μM ethyl ester S-nitroso-cysteine (ECySNO) for 90 min. Anti-FLAG antibody was used to visualize SAR1B. (D) Quantification (n = 3) of SNO-PCSK9 and SNO-SAR1B (normalized to total PCSK9 and SAR1B, respectively) from (C) and related experiments. (E) Western blot analysis of SNO-SAR1B wild-type and indicated mutations in SCoR2-deficient HEK293 transfected with SAR1B wild-type and indicated mutations and treated with 200 μM ECySNO for 90 min. Anti-FLAG antibody was used to visualize SAR1B in a single experiment that is verified in subsequent assays. (F) Western blot analysis of SNO-PCSK9, SNO-SURF4, and SNO-SAR1B in SCoR2-deficient HEK293 cells transiently overexpressing SAR1BWT or SAR1BC102A/C178A and treated with 200 μM ECySNO for 90 min prior to harvest. (G) Quantification (n = 3) of SNO-PCSK9 (mature band, normalized to total mature PCSK9) and SNO-SURF4 from (F). (H) Representative western blot analysis for cellular and secreted (media) PCSK9 in SCoR2-deficient HEK293 cells overexpressing SAR1BWT or SAR1BC102A/C178A and treated with 200 μM ECySNO for 90 min prior to harvest. (I) Quantification (n = 3) of secreted (media) PCSK9 (normalized to mature PCSK9 band) from (H). p values in (I) were calculated by one-way ANOVA. (J) SCoR-deficient HEK293 cells stably expressing PCSK9 were treated with or without 200 μM ECySNO (+SNO) for 90 min then stained with anti-PCSK9 (green) and anti-calnexin (red, ER marker) antibodies. Scale bar, 5 μm. (K) Quantification of mean PCSK9 signal intensity in pixels positive for calnexin (n = 12 cells per condition). Control: SNO-RAC assay performed without ascorbate. See also Figure S4.
Figure 4.
Figure 4.. SURF4 S-nitrosylates PCSK9 to inhibit cargo selection and secretion
(A) Western blot analysis of SNO-SURF4 in SCoR2-deficient HEK293 transfected with wild-type SURF4 and treated with 200μM ECySNO for 90 min. Anti-V5 antibody was used to visualize SURF4. (B) Quantification (n = 3) of SNO-SURF4 (normalized to total SURF4) from (A). (C) Western blot analysis of SNO-SURF4 in SCoR2-deficient HEK293 transfected with SURF4 wild-type or indicated mutants and treated with 200 μM ECySNO for 90 min. Anti-V5 antibody was used to visualize SURF4 in a single experiment that is verified in subsequent assays. (D) Western blot analysis of SNO-PCSK9 and SNO-SURF4 in SCoR2-deficient HEK293 cells transiently overexpressing SURF4WT or SURFC32A and treated with 200 μM ECySNO for 90 min prior to harvest. (E) Quantification (n = 3) of SNO-PCSK9 (mature band, normalized to total mature PCSK9) from (D). (F) Western blot analysis for cellular and secreted (media) PCSK9 in SCoR2-deficient HEK293 cells overexpressing SURF4WT or SURF4C32A and treated with 200 μM ECySNO for 90 min prior to harvest. (G) Quantification (n = 3) of secreted (media) PCSK9 (normalized to mature PCSK9 band) from (F). (H) Western blot analysis of PCSK9–SURF4 interaction with or without ECySNO treatment. An equal number of cells were transfected and cultured for 24 h, washed with PBS, given fresh (PCSK9-free) Opti-MEM media with or without 200 μM ECySNO, and harvested after 20 min. SURF4 was visualized with anti-V5 antibody. (I) Quantification (n = 3) of PCSK9–SURF4 interaction with or without ECySNO treatment from (H). (J) Western blot analysis of cellular and secreted (media) PCSK9 in SCoR2-deficient HEK293 transiently expressing PCSK9WT or PCSK9C301A with or without ECySNO treatment. An equal number of cells were transfected and cultured for 24 h, washed with PBS, given fresh (PCSK9-free) Opti-MEM media with or without 200 μM ECySNO, and harvested after 90 min. (K) Quantification (n = 3) of secreted (media) PCSK9 (normalized to mature PCSK9, lower band) from (J) and related experiments. p values in (G) and (K) were calculated by one-way ANOVA. In the above panels, SNO-proteins were captured from cell lysates by SNO-RAC, separated by SDS-PAGE, and analyzed by western blot. Control; SNO-RAC assay for SNO-proteins performed without ascorbate. For PCSK9, upper band: pro-PCSK9; lower band: mature PCSK9. See also Figure S6
Figure 5.
Figure 5.. Inhibition of SCoR2 by small-molecule drug increases SNO-PCSK9 levels and lowers serum LDL cholesterol
(A) SNO-CoA reductase activity in liver lysate from control-fed C57BL/6J mice or mice fed diet containing AL-1576 for 4 weeks (n = 3). (B) Total serum cholesterol from 6-h fasted 20-week old male mice fed control diet (n = 10) or fed diet containing AL-1576 for 4 weeks (n = 10). (C) Pooled serum from 6-h fasted 20-week-old male mice fed control diet (n = 7) or fed diet containing AL-1576 for 4 weeks (n = 7) was separated by fast protein liquid chromatography to obtain individual lipoprotein fractions. Lipoprotein fractions were labeled according to known standards. (D) Serum PCSK9 from 6-h fasted 20-week-old male mice fed control diet (n = 10) or fed diet containing AL-1576 for 4 weeks (n = 10). (E) Western blot analysis of SNO-PCSK9 in livers from 6-h fasted 20-week-old male mice fed control diet (n = 4) or fed diet containing AL-1576 for 4 weeks (n = 4). Control; SNO-RAC assay for SNO-PCSK9 performed without ascorbate. Mature PCSK9 is visualized. (F) Quantification (n = 4) of bands from (E). SNO-protein was normalized to total protein for each lane and total protein was normalized to GAPDH prior to analysis. (G) Western blot analysis for hepatic LDLR and PCSK9 from 6-h fasted 20-week-old mice fed control diet or fed diet containing AL-1576 for 4 weeks. Mature PCSK9 is visualized. (H) Quantification (n = 7) of LDLR and PCSK9 protein levels from (G). (I) Quantitative real-time PCR analysis of hepatic SREBP2, LDLR, and PCSK9 from 6-h fasted 20-week-old mice fed control diet (n = 7) or fed diet containing AL-1576 for 4 weeks (n = 7). (J) Total serum cholesterol from 6-h fasted 16-week-old male LDLR−/− mice (n = 10) or LDLR−/− mice fed diet containing AL-1576 for 4 weeks (n = 9). (K) Total serum cholesterol from 6-h fasted 16-week-old male CETP/ApoB100 transgenic mice fed control diet (n = 3) or fed diet containing AL-1576 for 8 weeks (n = 4). (L) Pooled serum from 6-h fasted 16-week-old male CETP/ApoB100 transgenic mice fed control diet (n = 3) or fed diet containing AL-1576 for 8 weeks (n = 4) was separated by fast protein liquid chromatography to obtain individual lipoprotein fractions. Lipoprotein fractions were labeled according to known standards. (M) Total serum cholesterol from 6-h fasted 20-week-old male ApoE−/− mice fed control diet (n = 10) or fed diet containing AL-1576 for 4 weeks (n = 10). (N) Serum from 6-h fasted 20-week-old male ApoE−/− mice fed control diet (n = 10) or diet containing AL-1576 for 4 weeks (n = 10) was separated by fast protein liquid chromatography to obtain individual lipoprotein fractions. Lipoprotein fractions were labeled according to known standards. (O) Serum PCSK9 from 6-h fasted 20-week-old male ApoE−/− mice fed control diet (n = 10) or diet containing AL-1576 for 4 weeks (n = 10). (P) Western blot analysis for hepatic LDLR and PCSK9 from 6-h fasted 20-week-old ApoE−/− mice fed control diet or diet containing AL-1576 for 4 weeks. (Q) Quantification (n = 7) of LDLR and PCSK9 protein levels from (P).
Figure 6.
Figure 6.. SCoR2 regulates S-nitrosylation of COPII proteins to control PCSK9 S-nitrosylation and secretion
(Left) SCoR2 enables PCSK9 secretion by preventing S-nitrosylation of COPII components (SAR1, and SURF4) and cargo (PCSK9). PCSK9 can bind its cargo receptor SURF4 to promote selection of PCSK9 into nascent ER vesicles. (Right) SCoR2 inhibition (genetically or pharmacologically) blocks PCSK9 secretion via an S-nitrosylation cascade thereby lowering LDL cholesterol. Specifically, inhibition of SCoR2 leads to increases in SAR1 S-nitrosylation; SNO-SAR1 then acts as a nitrosylase for SURF4 to form SNO-SURF4, which then nitrosylates PCSK9 to inhibit PCSK9-SURF4 interaction. That is, SNO-PCSK9 binding to SURF4 is ineffectual, preventing selection of PCSK9 into nascent ER vesicles, thereby reducing PCSK9 secretion. Created with BioRender.com.

References

    1. Abunimer A, Smith K, Wu T-J, Lam P, Simonyan V, and Mazumder R (2014). Single-nucleotide variations in cardiac arrhythmias: prospects for genomics and proteomics based biomarker discovery and diagnostics. Genes 5, 254–269. - PMC - PubMed
    1. Anand P, and Stamler JS (2012). Enzymatic mechanisms regulating protein S-nitrosylation: implications in health and disease. J. Mol. Med. 90, 233–244. - PMC - PubMed
    1. Anand P, Hausladen A, Wang YJ, Zhang GF, Stomberski C, Brunengraber H, Hess DT, and Stamler JS (2014). Identification of S-nitroso-CoA reductases that regulate protein S-nitrosylation. Proc. Natl. Acad. Sci. USA 111, 18572–18577. - PMC - PubMed
    1. Barski OA, Gabbay KH, Grimshaw CE, and Bohren KM (1995). Mechanism of human aldehyde reductase: characterization of the active site pocket. Biochemistry 34, 11264–11275. - PubMed
    1. Barski OA, Papusha VZ, Ivanova MM, Rudman DM, and Finegold MJ (2005). Developmental expression and function of aldehyde reductase in proximal tubules of the kidney. Am. J. Physiol. Renal Physiol. 289, F200–F207. - PubMed

Publication types