. 2022 Oct 26;13(1):6360.
doi: 10.1038/s41467-022-33870-0.

Clonal somatic copy number altered driver events inform drug sensitivity in high-grade serous ovarian cancer

Affiliations

Clonal somatic copy number altered driver events inform drug sensitivity in high-grade serous ovarian cancer

Filipe Correia Martins et al. Nat Commun. .

Abstract

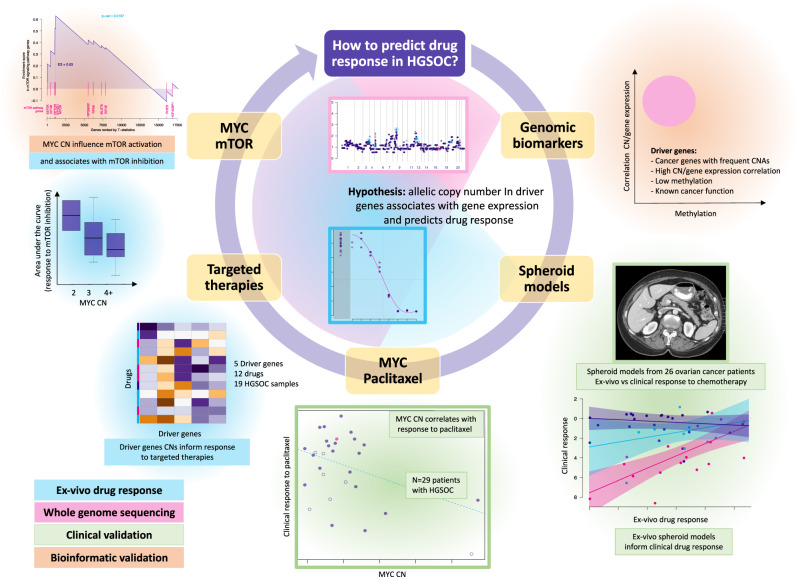
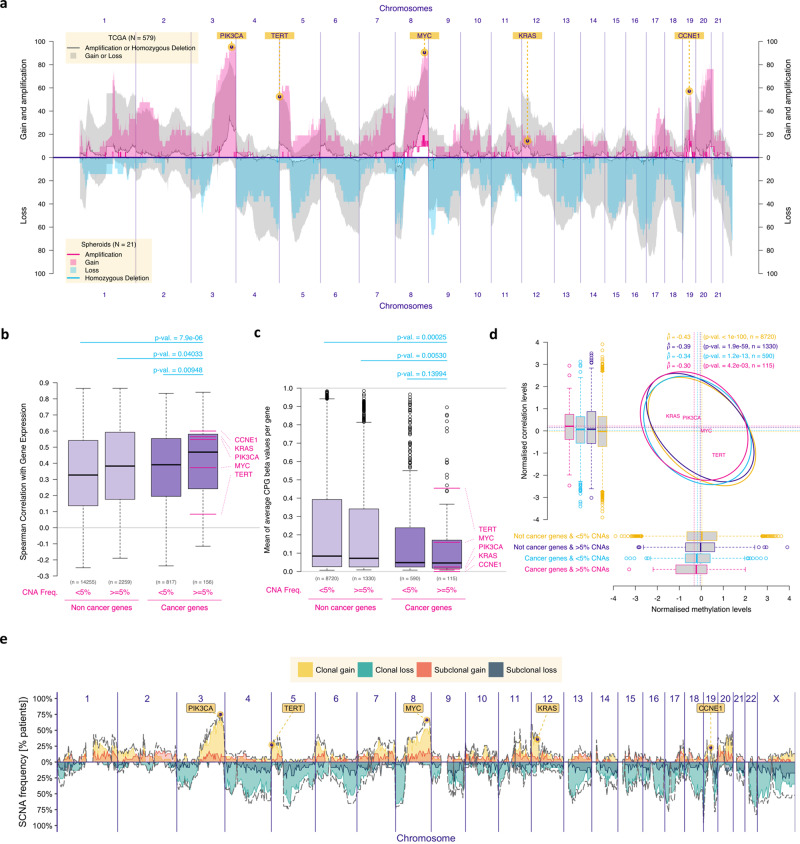
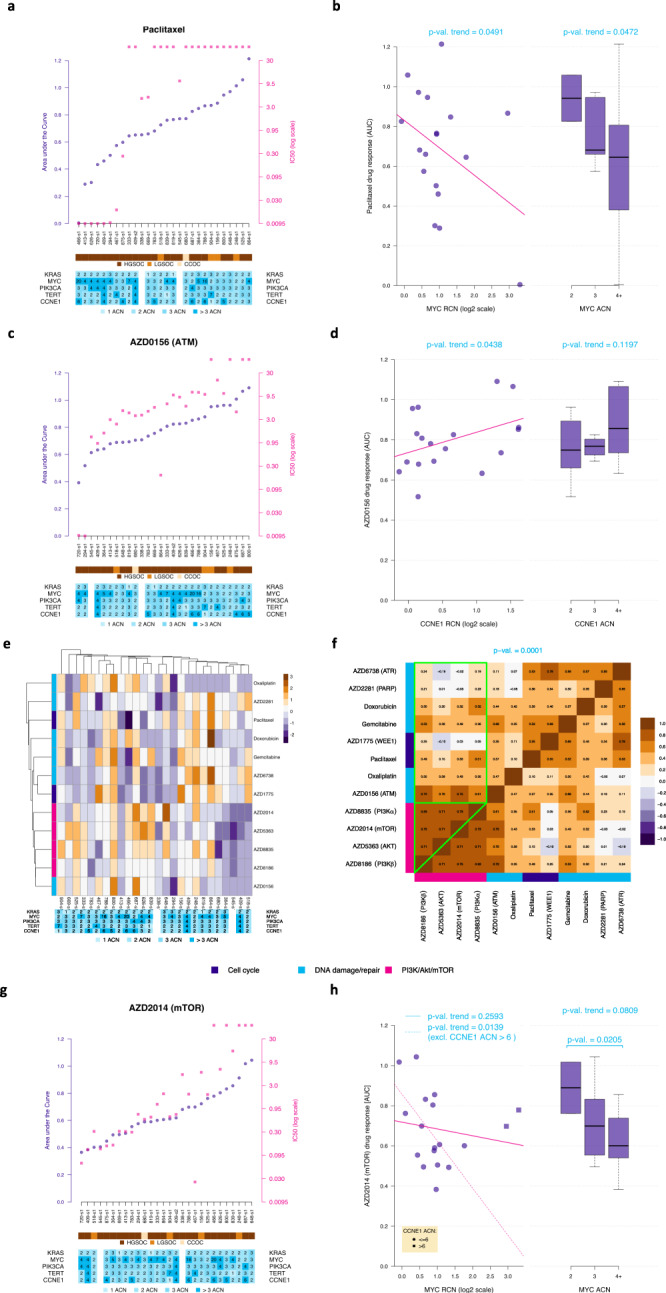
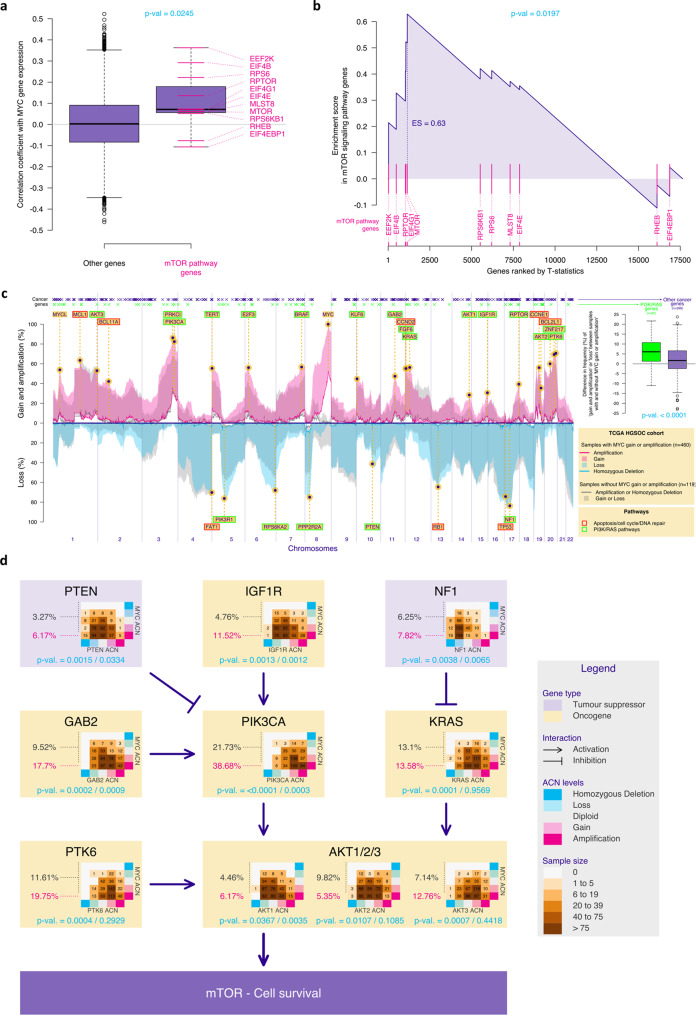
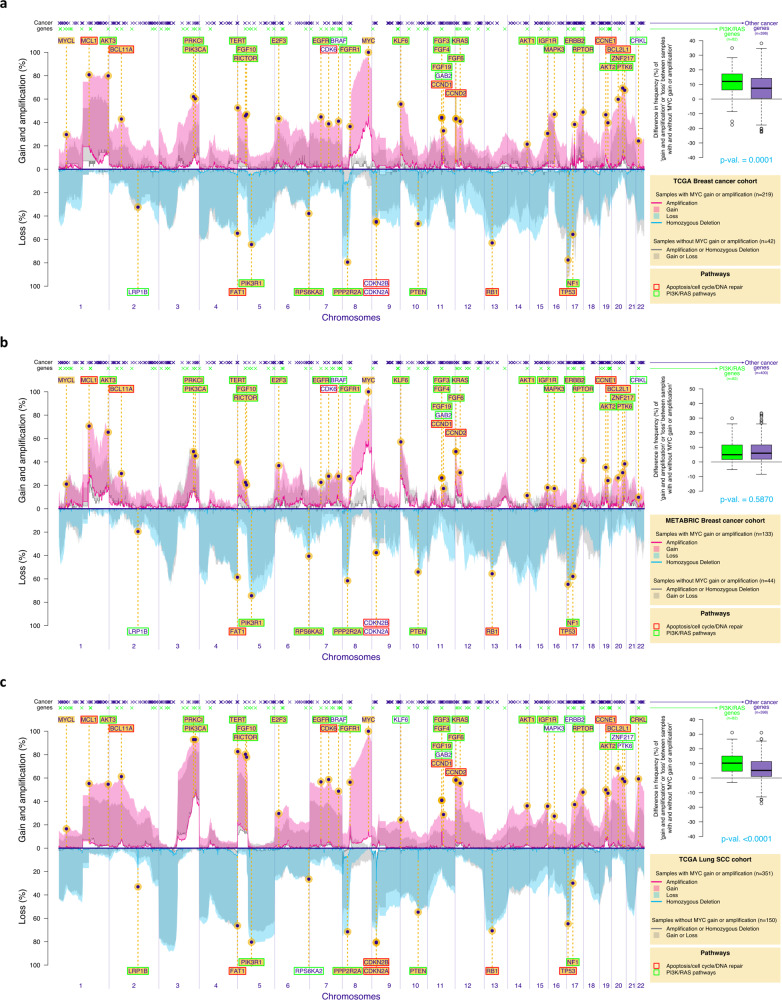
Chromosomal instability is a major challenge to patient stratification and targeted drug development for high-grade serous ovarian carcinoma (HGSOC). Here we show that somatic copy number alterations (SCNAs) in frequently amplified HGSOC cancer genes significantly correlate with gene expression and methylation status. We identify five prevalent clonal driver SCNAs (chromosomal amplifications encompassing MYC, PIK3CA, CCNE1, KRAS and TERT) from multi-regional HGSOC data and reason that their strong selection should prioritise them as key biomarkers for targeted therapies. We use primary HGSOC spheroid models to test interactions between in vitro targeted therapy and SCNAs. MYC chromosomal copy number is associated with in-vitro and clinical response to paclitaxel and in-vitro response to mTORC1/2 inhibition. Activation of the mTOR survival pathway in the context of MYC-amplified HGSOC is statistically associated with increased prevalence of SCNAs in genes from the PI3K pathway. Co-occurrence of amplifications in MYC and genes from the PI3K pathway is independently observed in squamous lung cancer and triple negative breast cancer. In this work, we show that identifying co-occurrence of clonal driver SCNA genes could be used to tailor therapeutics for precision medicine.


Conflict of interest statement

The Experimental Medicine Initiative from the University of Cambridge that funded F.C.M. Clinical Lectureship is partly funded by Astrazeneca. C.C. is a member of the AstraZeneca (AZ) External Science Panel, and has research grants from Roche, Genentech, AZ, and Servier that are administered by the University of Cambridge and reports receiving speakers’ bureau honoraria from Illumina. C.S. acknowledges grant support from Pfizer, AstraZeneca, Bristol Myers Squibb, Roche-Ventana, Boehringer-Ingelheim, Invitae (previously Archer Dx Inc - collaboration in minimal residual disease sequencing technologies) and Ono Pharmaceutical. He is an AstraZeneca Advisory Board member and Chief Investigator for the AZ MeRmaiD 1 and 2 clinical trials and is also Co-Chief Investigator of the NHS Galleri trial funded by GRAIL and a paid member of GRAIL’s Scientific Advisory Board. He receives consultant fees from Achilles Therapeutics (also SAB member), Bicycle Therapeutics (also a SAB member), Genentech, Medicxi, Roche Innovation Centre – Shanghai, Metabomed (until July 2022), and the Sarah Canon Research Institute C.S. has received honoraria from Amgen, AstraZeneca, Pfizer, Novartis, GlaxoSmithKline, MSD, Bristol Myers Squibb, Illumina, and Roche-Ventana. C.S. had stock options in Apogen Biotechnologies and GRAIL until June 2021, and currently has stock options in Epic Bioscience, Bicycle Therapeutics, and has stock options and is co-founder of Achilles Therapeutics. C.S. holds patents relating to assay technology to detect tumour recurrence (PCT/GB2017/053289); targeting neoantigens (PCT/EP2016/059401), identifying patent response to immune checkpoint blockade (PCT/EP2016/071471), determining HLA LOH (PCT/GB2018/052004), predicting survival rates of patients with cancer (PCT/GB2020/050221), identifying patients who respond to cancer treatment (PCT/GB2018/051912), US patent relating to detecting tumour mutations (PCT/US2017/28013), methods for lung cancer detection (US20190106751A1) and both a European and US patent related to identifying insertion/deletion mutation targets (PCT/GB2018/051892). J.D.B. has stock options in Tailor Bio and Inivata and is co-founder of Tailor Bio. J.D.B. has had consulting and advisory roles in AstraZeneca and Clovis Oncology and has received honoraria from GSK and Astrazeneca. J.D.B. holds patents relating to TAm-Seq v2 method for ctDNA estimation, enhanced detection of target DNA by fragment size analysis and methods for predicting treatment response in cancers. The remaining authors declare no competing interests.

Figures

Fig. 1
Fig. 1
Diagram summarising the research question, hypothesis and main results.
Fig. 2
Fig. 2. Genomic analysis of single and multi-regional HGSOC cohorts defined clonal SCNA driver genes.
a Plot showing the prevalence of chromosomal alterations across the genome in both the TCGA cohort (n = 579) and in the HGSOC spheroid samples from the OV04 cohort (n = 21). For the spheroid cohort, gain was defined as 3 or 4 chromosomal adjusted copies and amplifications as ≥5 adjusted copies. b Boxplots showing the Spearman’s correlation scores between gene expression and respective chromosomal copy number for each gene, split between cancer vs non-cancer genes and prevalent (>5% SCNAs in HGSOC) vs non-prevalent genes. Driver genes (in the far right; defined as ‘cancer genes’ that have SCNA alteration frequency in ≥5% of the samples) had the highest positive correlation scores. Numbers above the boxplots correspond to the p-values obtained with two-sided Mann-Whitney-Wilcoxon tests. c Boxplots showing methylation levels (beta-values) for all genes, split as cancer and non-cancer genes and as prevalent (>5% SCNAs in HGSOC) and non-prevalent genes. Prevalent non-cancer genes were significantly more methylated than prevalent cancer genes (two-sided Mann-Whitney-Wilcoxon’s p-value: 0.005). d 95% prediction confidence ellipses displaying the estimated Pearson’s correlation between the methylation levels (x-axis, normalized) and the correlation between chromosomal copy number and gene expression (y-axis, normalized) for four groups of genes defined as combinations of cancer and non-cancer genes and as prevalent and non-prevalent genes. The boxplots respectively report the same information as the ones of panels b (vertical boxplots) and c (horizontal boxplots) on the normalized scale. For each group, Pearson’s correlation estimate, p-value of the two-sided test of association between paired samples and number of genes are indicated (top right); for panels b, c and d, n = 371 independent TCGA samples, inference without multiplicity correction, and for all boxplots, the central box was defined by the quantiles 0.25, 0.5 and 0.75 of the data, and the wiskers as 1.5 times of the interquartile range. e Frequency of somatic clonal and subclonal copy number alterations across the genome of 72 tumour regions from 28 HGSOC primary tumours. Gains and losses were classified relative to ploidy (Supplementary Fig. S1b shows the genomic distribution of the frequency of somatic copy number alterations across 127 tumour regions of primary tumours and metastases from 30 HGSOC patients). The dotted line corresponds to the total number of gains and losses (clonal and subclonal).
Fig. 3
Fig. 3. Copy number of clonal SCNA driver genes informs drug response.
a Scatterplot showing paclitaxel response measured by AUC (purple; left y-axis) and IC50 (pink; right y-axis) for all samples (n = 28) ordered by AUC levels. The lower bars show, for each sample, the histological diagnosis (HGSOC – high-grade serous; LGSOC – low-grade serous; CCOC – clear cell) and the normalised copy number for MYC, PIK3CA, KRAS, CCNE1 and TERT. Two of the HGSOC samples had failed sequencing data. IC50 dots above the scale of the figure represent samples where IC50 was not determined (viability was above 50% at the maximum dose). b Scatterplot and boxplots showing the associations between response to paclitaxel in vitro (measured by AUC) and MYC relative copy-number (RCN; left plot) and normalised absolute copy-number (3-level ACN; defined by the absolute numbers normalised for a diploid genome, to allow comparisons, observed in n = 18 independent HGSOC samples; right plot) One-sided test p-values corresponding to the presence of a trend (linear model Wald t-test on the left and Jonckheere-Terpstra test on the right) are indicated. Regression effect size for the correlation between MYC RCN and response to paclitaxel is −0.4. c Scatterplot showing AZD0156 (p-ATM inhibitor) response measured in each sample following the same format as in panel a. d Association between CCNE1 RCN and ACN and AZD0156 in-vitro response (as in Fig. 3b); number of independent samples and statistical test identical to panel b; regression effect size of 0.4. e Two-dimensional hierarchical clustering of Z-scores for response of spheroids to each drug as observed in n = 26 samples (after exclusion of the 2 samples with extreme variability). Adjusted copy number data for each spheroid is tabulated below the heatmap. Rows are colour-coded by target pathway for each drug. f Heatmap showing the Spearman’s Rho correlation between in vitro response to different drugs observed in the HGSOC samples. Response to drugs affecting the PI3K pathway (pink) tend to be similar (high correlation values; green triangle), whilst the correlation between response to PI3K drugs and other drugs is lower (green square). The p-value corresponding to the non-parametric bootstrap test comparing these two sets of correlations is indicated. g Scatterplot showing AZD2014 (dual mTOR inhibitor) response measured in all samples following the format in Fig. 3a. h Association between MYC RCN and ACN and AZD2014 in-vitro response (as in panel 2b) when including (solid line) or excluding (dashed line) samples with high (>6) CCNE1 ACN; number of independent samples and statistical test identical to panel b; regression effect size of −0.2. For all boxplots in b, d and h, the central box was defined by the quantiles 0.25, 0.5 and 0.75 of the data, and the maximum whisker size equals 1.5 times of the interquartile range.
Fig. 4
Fig. 4. MYC-amplified HGSOCs are associated with SCNAs in genes from the NF1/KRAS and PI3K/AKT/mTOR pathways and activation of the mTOR pathway.
a Boxplots showing the Pearson’s correlation coefficient between the gene expression of all genes and the one of MYC, for genes belonging (n = 11) or not belonging (n = 17638) to the mTOR signalling pathway, based on BioPlanet annotation. The latter group showed, on average, higher correlation estimates compared to the other group (two-sided Mann-Whitney-Wilcoxon test). b Gene set enrichment analysis (GSEA) enrichment scores showing enrichment of mTOR signalling pathway genes in MYC-high tumours. The vertical pink lines represent the projection of individual genes from the mTOR pathway onto the gene list ranked by MYC expression level. The curve in blue corresponds to the calculation of the enrichment score (ES) following a standard two-sided GSEA. The more the blue ES curve is shifted to the upper left of the graph, the more the gene set is enriched in MYC-high genes. The ES score, the normalised ES score (NES) and p-value are also shown in the plot. c Frequency plot showing the distribution of chromosomal amplifications/homozygous losses (solid lines) or gains/heterozygous losses (shaded areas) across the genome in both MYC-amplified/gain (pink for amplifications/gains and blue for losses) and MYC diploid HGSOC (gray) in the HGSOC TCGA cohort. The location of a list of functional cancer genes selected in ref. is indicated on top. Cancer genes are colour-coded in green if they belong to the PI3K or RAS pathways based on the Reactome definition. The boxplots (right panel) show, for both PI3K/RAS and other cancer genes, the difference between the frequency of cancer genes SCNAs in tumours with and without MYC amplification or gain. The p-value of the one-sided permutation test of equality of means is indicated. For all boxplots (in a and c), the central box was defined by the quantiles 0.25, 0.5 and 0.75 of the data, and the maximum whisker size equals 1.5 times of the interquartile range. d Diagram showing HGSOC drivers that impact the PI3K pathway and the prevalence of SCNAs across MYC allelic copy numbers (table). For each gene, the p-values corresponding two tests of association between both sets of absolute copy number are indicated (Chi-square test on the left and generalized Cochran-Mantel-Haenszel test for ordered factors on the right) are indicated in turquoise.
Fig. 5
Fig. 5. Co-existence of MYC amplification and SCNAs from the PI3K and RAS pathways in lung squamous and triple-negative p53-mutant breast cancers.
Frequency plots showing the distribution of chromosomal amplifications/homozygous losses (continuous line) or gains/heterozygous losses (shade) across the genome in both MYC-amplified/gain (pink for amplifications/gains and blue for losses) and MYC diploid tumours (gray) in the Breast TCGA cohort (a triple-negative invasive ductal p53-mutant tumours only), Breast Metabric cohort (b triple-negative invasive ductal p53-mutant tumours only) and Lung Squamous TCGA cohort c. The location of a list of functional cancer genes selected in ref. is indicated on top. Cancer genes are colour-coded in green if they belong to the PI3K or RAS pathways based on the Reactome definition. The boxplots (right panel) show, for both PI3K/RAS and other cancer genes, the difference between the frequency of cancer genes SCNAs in tumours with and without MYC amplification or gain. The p-value of the one-sided permutation test of equality of means is indicated. A list of known driver genes is also presented across all plots – the genes are highlighted in yellow if they are recognised GISTIC drivers in each specific tumour. For all boxplots (a, b and c), the central box was defined by the quantiles 0.25, 0.5 and 0.75 of the data, and the maximum whisker size equals 1.5 times of the interquartile range (inference without multiplicity correction).

References

    1. Torre LA, et al. Ovarian cancer statistics, 2018. CA Cancer J. Clin. 2018;68:284–296. - PMC - PubMed
    1. Schwarz RF, et al. Spatial and temporal heterogeneity in high-grade serous ovarian cancer: a phylogenetic analysis. PLoS Med. 2015;12:e1001789. - PMC - PubMed
    1. Tutt A, et al. Oral poly(ADP-ribose) polymerase inhibitor olaparib in patients with BRCA1 or BRCA2 mutations and advanced breast cancer: a proof-of-concept trial. Lancet. 2010;376:235–244. - PubMed
    1. Kaufman B, et al. Olaparib monotherapy in patients with advanced cancer and a germline BRCA1/2 mutation. J. Clin. Oncol. 2015;33:244–250. - PMC - PubMed
    1. Shukla A, et al. Chromosome arm aneuploidies shape tumour evolution and drug response. Nat. Commun. 2020;11:449. - PMC - PubMed

Publication types

MeSH terms

Substances