. 2022 Oct 26;13(1):6363.
doi: 10.1038/s41467-022-34069-z.

The type 1 diabetes gene TYK2 regulates β-cell development and its responses to interferon-α

Affiliations

The type 1 diabetes gene TYK2 regulates β-cell development and its responses to interferon-α

Vikash Chandra et al. Nat Commun. .

Abstract

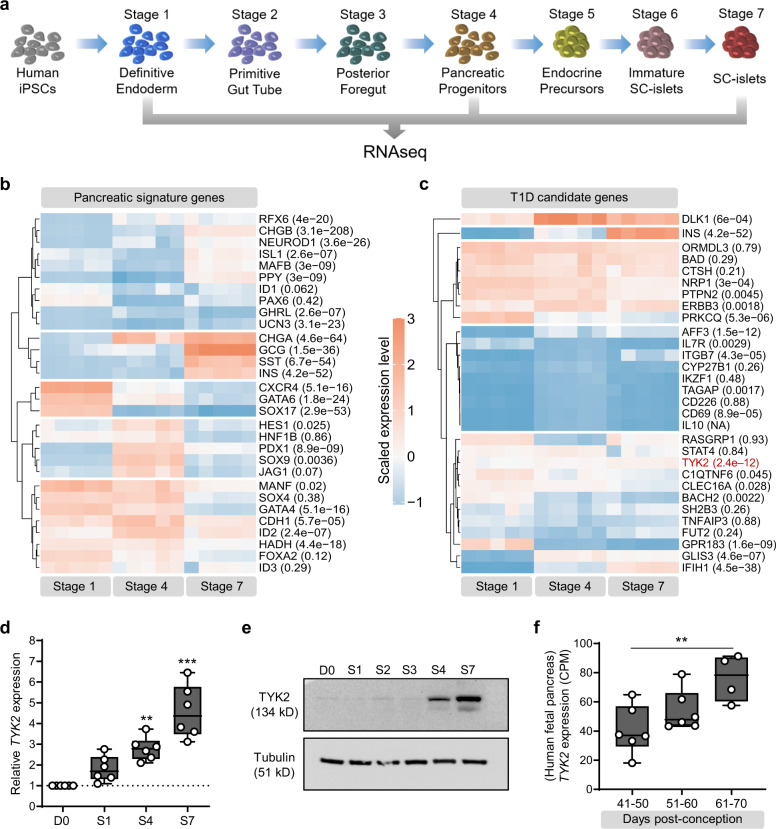
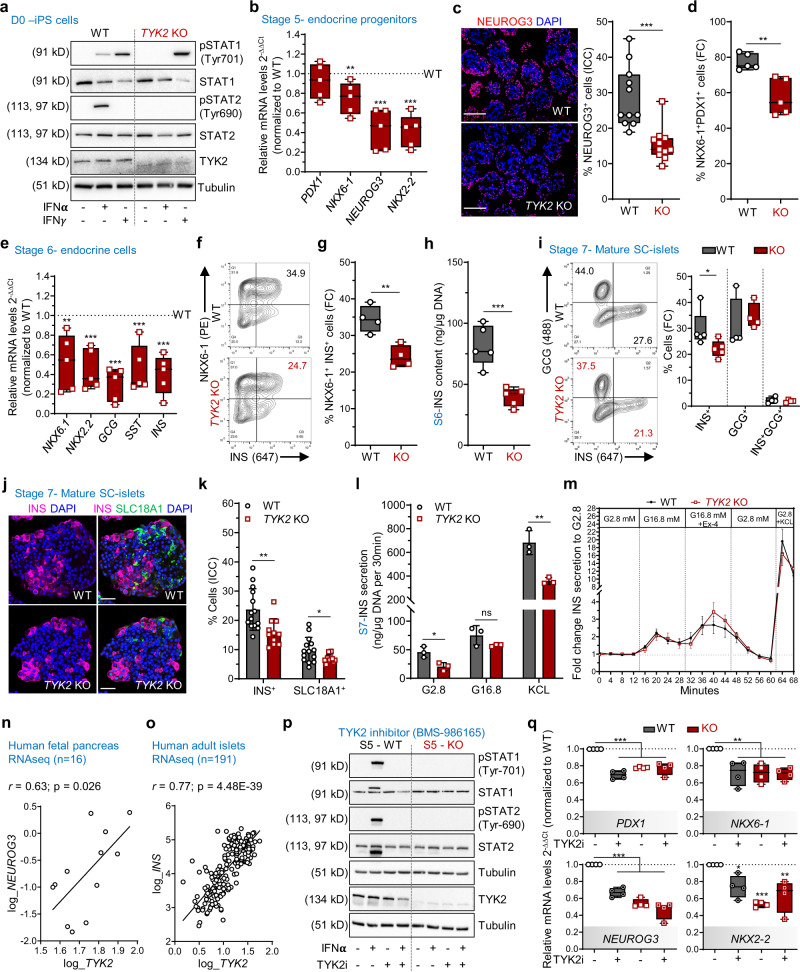
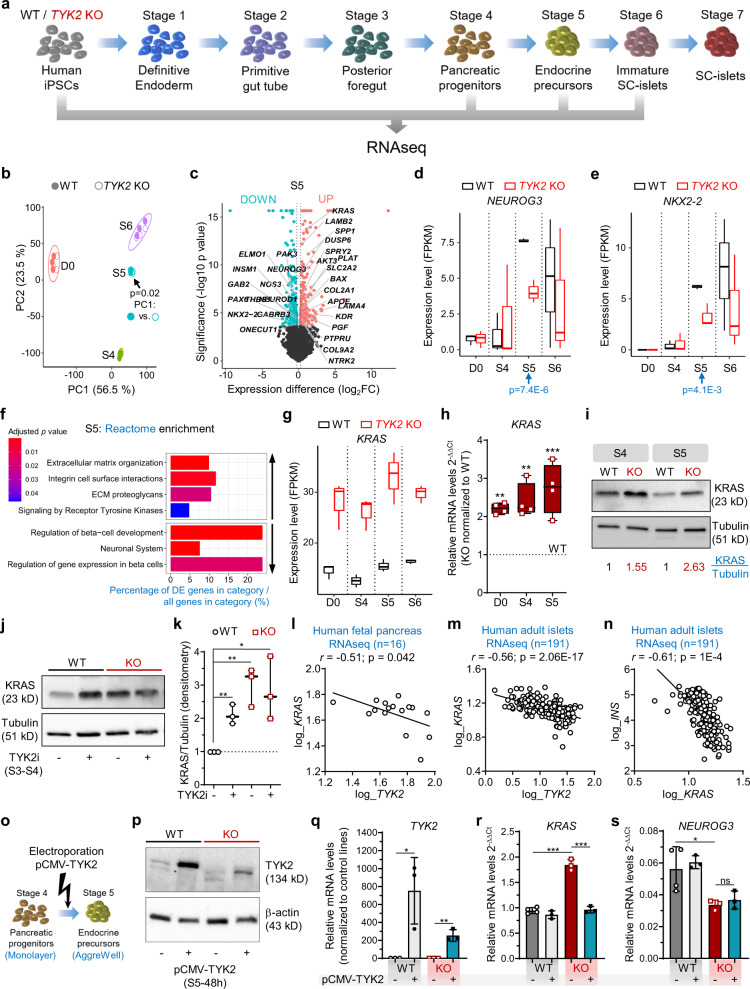
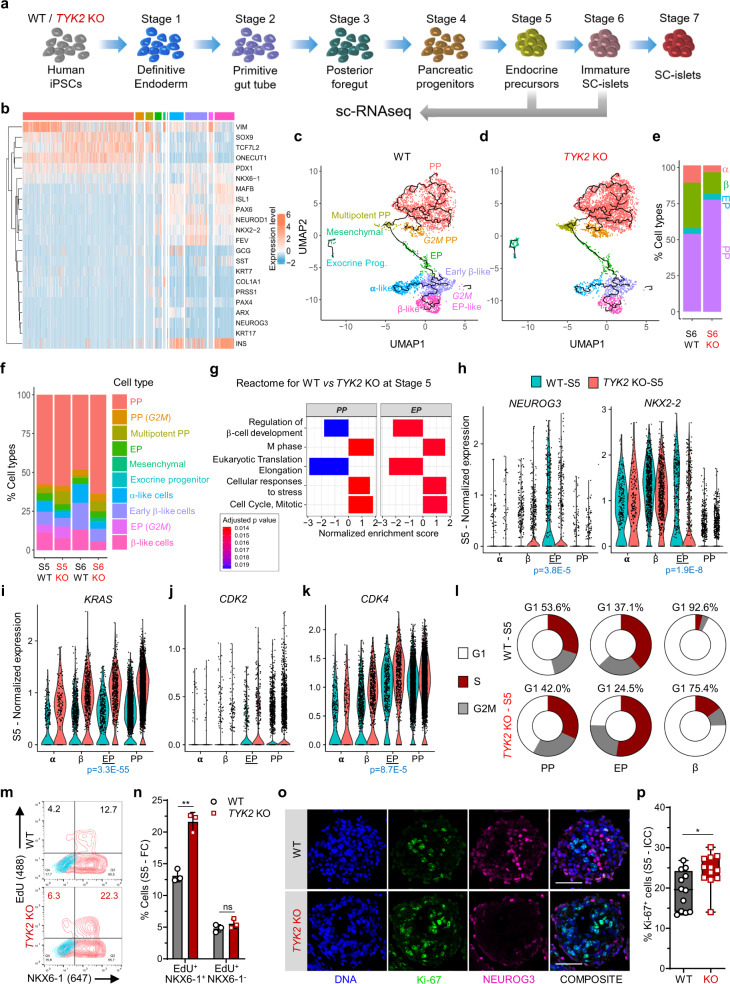
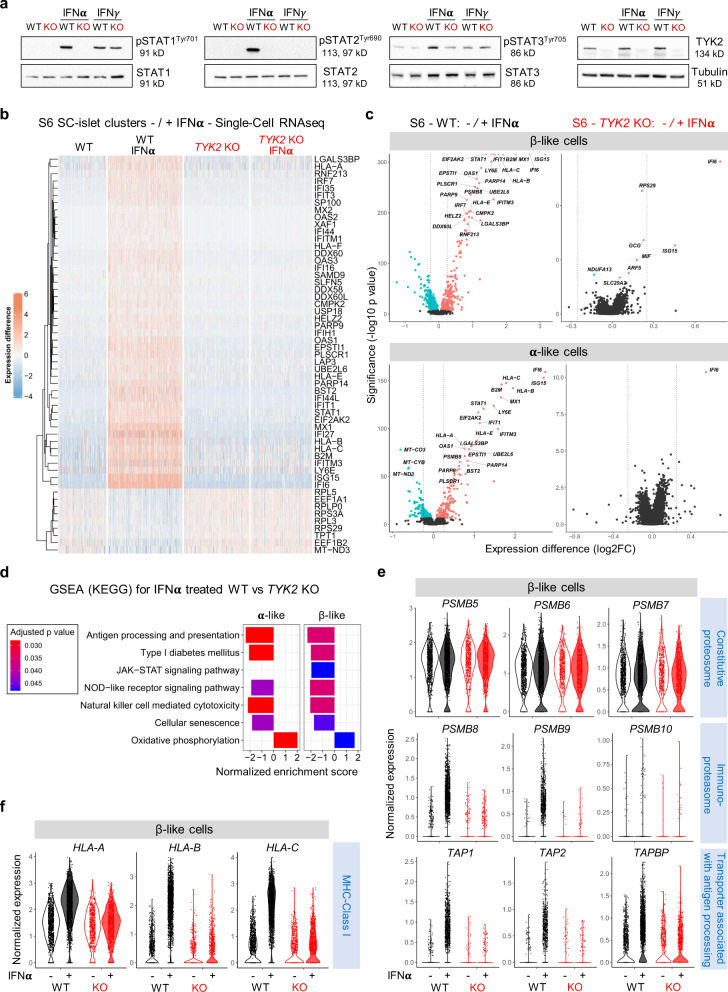
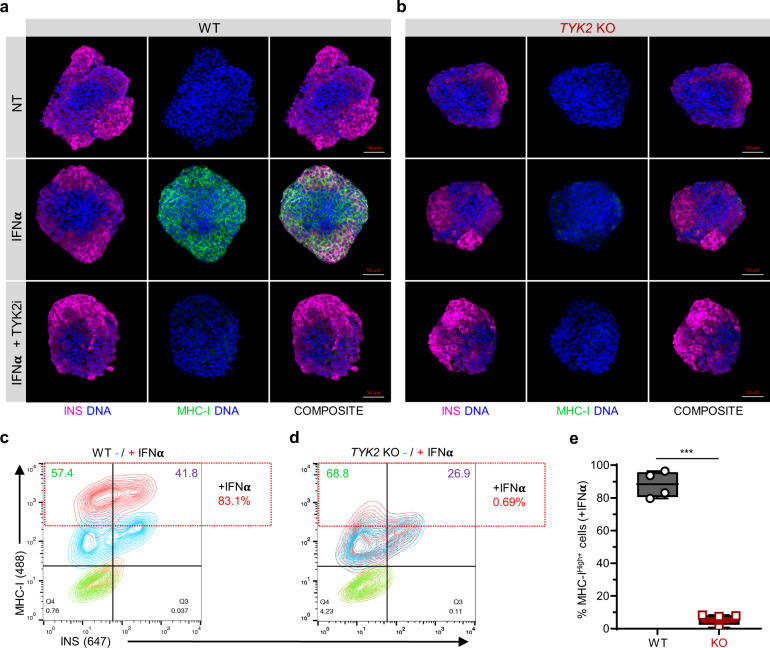
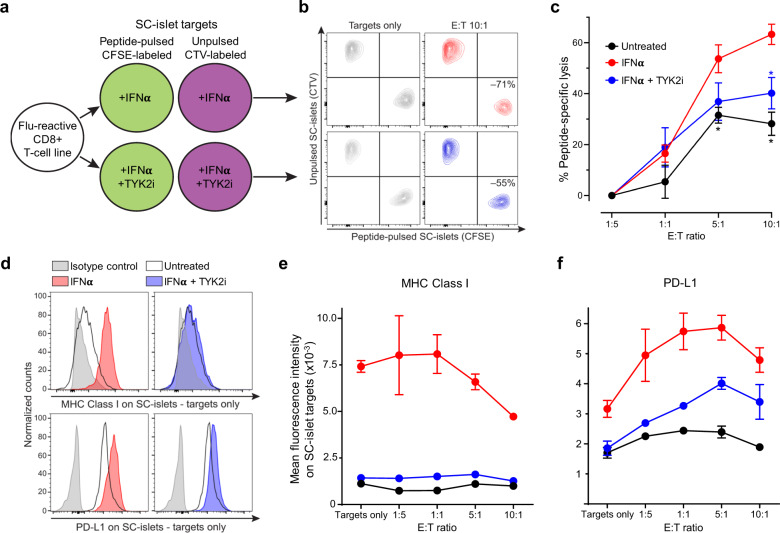
Type 1 diabetes (T1D) is an autoimmune disease that results in the destruction of insulin producing pancreatic β-cells. One of the genes associated with T1D is TYK2, which encodes a Janus kinase with critical roles in type-Ι interferon (IFN-Ι) mediated intracellular signalling. To study the role of TYK2 in β-cell development and response to IFNα, we generated TYK2 knockout human iPSCs and directed them into the pancreatic endocrine lineage. Here we show that loss of TYK2 compromises the emergence of endocrine precursors by regulating KRAS expression, while mature stem cell-islets (SC-islets) function is not affected. In the SC-islets, the loss or inhibition of TYK2 prevents IFNα-induced antigen processing and presentation, including MHC Class Ι and Class ΙΙ expression, enhancing their survival against CD8+ T-cell cytotoxicity. These results identify an unsuspected role for TYK2 in β-cell development and support TYK2 inhibition in adult β-cells as a potent therapeutic target to halt T1D progression.


Conflict of interest statement

D.L.E. received grant support from Eli Lilly and Company, Indianapolis, for research on new approaches to protect pancreatic beta cells in T1D. The remaining authors declare no competing interests.

Figures

Fig. 1
Fig. 1. Expression pattern of TYK2, a T1D candidate gene, during human pancreatic development.
a Schematic representation of the pancreatic differentiation protocol. The figure was partly generated using Servier Medical Art. b Heatmap of pancreatic lineage genes from deep RNAseq analysis at Stage (S) 1 (definitive endoderm), S4 (pancreatic-progenitors), and S7 (SC-islets). c Similar heatmap for known T1D candidate genes. Each gene is shown with a multiple testing corrected p value generated for the longitudinal differential expression of the gene during differentiation (n = 5). d Relative expression of TYK2 during pancreatic differentiation shown by qRT-PCR (n = 6) and e by immunoblot analysis for TYK2 protein. Tubulin was used as a loading control (n = 3). f Expression pattern of TYK2 in human fetal pancreas samples at 40 to 70 days post conception (n = 16). For d and f, significance was determined using one-way ANOVA with Tukey’s multiple comparison test, box and whiskers plots showing the median with whiskers extending from minimum to maximum values. *p < 0.05; **p < 0.01; ***p < 0.001. Source data are provided as a Source Data file.
Fig. 2
Fig. 2. Loss of TYK2 is associated with defective formation of endocrine precursors.
a Immunoblots for IFNα or IFNγ treated WT and TYK2 KO hiPSCs (n = 3). b Stage (S) 5 relative transcript levels of PDX1, NKX6-1, NEUROG3, and NKX2-2 (n = 5). c Immunohistochemistry for NEUROG3 (scale bar = 150 μm) and quantification of 11 images from 3 experiments (n = 11). d S5 flow cytometry for PDX1+ NKX6-1+ cells (n = 5). e S6 relative transcript levels of NKX6-1, NKX2-2, GCG, SST, and INS (n = 5). f S6 flow cytometry for NKX6-1+ and INS+ cells. g Quantification (n = 4). h S6 total insulin content normalized to the DNA content (n = 5). i S7 flow cytometry for INS+ and GCG+ cells (n = 4-5). j Immunohistochemistry for INS and SLC18A1 in S7 SC-islets (scale bar = 50 μm) and k quantification from 2 experiments with 5-7 images each (n = 11–14). The number of cells quantified for WT and KO were 10516 and 11990 cells, respectively. l S7 static insulin secretion, with low (2.8 mM), high (16.8 mM) glucose and with 30 mM KCl, normalized to the DNA content (n = 3). Bar plots in k and l are means ± S.D. m S7 dynamic insulin secretion with 16.8 mM glucose, 50 ng/ml exendin-4 (Ex4), and 30 mM KCl, normalized to the basal secretion. Unpaired t-test with Holm-Šídák multiple comparison, data are means ± SEM (n = 5). n Correlation of TYK2 and NEUROG3 expression in human fetal pancreas (n = 16). o Correlation of TYK2 and INS expression in adult human islets (n = 191). Pearson’s r correlation test after log normalization of counts. p Immunoblots for WT and KO treated with TYK2i during S3–S5 analysed for STATs phosphorylation in presence of IFNα (n = 3) and q relative transcript levels of PDX1, NKX6-1, NEUROG3, and NKX2-2. Ordinary one-way ANOVA with Tukey’s multiple comparison (n = 4). Two-tailed unpaired t-test (b, c, d, e, g, h, i, k, l). Box and whiskers plots showing median with min to max whiskers. *p < 0.05; **p < 0.01; ***p < 0.001; ns—non-significant. Source data are provided as a Source Data file.
Fig. 3
Fig. 3. TYK2 negatively regulates KRAS expression.
a Schematic for bulk RNAseq experiments for WT and TYK2 KO cells (n = 3). The figure was generated using Servier Medical Art. b Principal component (PC) analysis of the bulk RNA-seq samples. Filled circles, WT cells; empty circles, KO cells. p-value (linear regression comparison) PC1~genotype of Stage (S) 5 is indicated. c Volcano plot for S5 differentially expressed genes for WT and KO. Significantly downregulated genes, iris blue; upregulated genes, soft red. Selected genes of interest are highlighted. d, e FPKM values for NEUROG3 and NKX2-2 expression at different differentiation stages. p-value (DESeq2) is indicated for S5. f Selected up- and down- regulated Reactome enrichment pathways in S5 KO cells compared to WT. g FPKM values for KRAS expression. h Relative transcript levels of KRAS with qRT-PCR in hiPSCs, S4 and S5 cells. i Immunoblot for KRAS at S4 and S5. Normalization with tubulin densitometric values are indicated in the panel (n = 3). j Immunoblot for KRAS at S4 in WT and KO cells following TYK2i treatment during S3–S4. k Densitometric analysis of panel j (n = 3). l Correlation of TYK2 and NEUROG3 expression in human fetal pancreas (n = 16). Pearson’s correlation after log normalization of counts. m Correlation of KRAS and TYK2 expression; and n KRAS and INS expression in human islets (n = 191). Pearson’s correlations r and significance levels p are indicated in the panels. o Schematic of TYK2 overexpression experiments. p Immunoblot for TYK2 48 h post pCMV-TYK2 electroporation during S5. β-actin used as a loading control (n = 2). qRT-PCR relative transcript levels 24 h post pCMV-TYK2 overexpression during S5 for q TYK2, r KRAS, and s NEUROG3 (n = 3). Two-tailed unpaired t-tests were applied. *p < 0.05; **p < 0.01; ***p < 0.001; ns—non-significant. The boxplots in d, e, g, h and k showing the median with lower and upper hinges corresponding to the first and third quartiles (the 25th and 75th percentiles) with min to max whiskers (n = 3), except for h, (n = 4). Source data are provided as a Source Data file.
Fig. 4
Fig. 4. Single-cell transcriptomic analysis of endocrine differentiation.
a Schematic for the scRNA-seq performed at Stage (S) 5 (3995 WT and 5025 KO -cells) and S6 (3348 WT and 4550 KO cells) samples. The figure was partly generated using Servier Medical Art, provided by Servier. b Heatmap for the selected genes associated with pancreatic differentiation. c Various noted clusters are indicated in different colour codes and presented as UMAP with pseudotime trajectories for S6 WT, d TYK2 KO and e relative percentages abundance of pancreatic progenitors (PP), endocrine precursors (EP), β-like cells (β), and α-like cells (α). f Relative abundance of all noted clusters in S5 and S6 for WT and TYK2 KO samples indicated in different colour codes. g Selected enriched pathways in S5 PP and EP like clusters using Gene set enrichment analysis (GSEA, Reactome). h Violin plots for the relative expression of NEUROG3 and NKX2-2; i KRAS, j CDK2, k CDK4 in indicated α, β, EP, and PP like clusters. l Donut chart showing the percentage of cells at various cell cycle phases with Seurat (CellCycleScoring) pipeline in PP, EP, and β-like cells clusters. m Flow cytometry analysis for NKX6-1+EdU+ cells during S5 and n their quantification (n = 3). Data are means ± S.D. o Immunocytochemistry for NEUROG3 and Ki-67 expression at S5. Scale bar = 100 μm. p Quantification of the data in panel o presented from two experiments with six images each (n = 12). The box and whiskers plot showing the median with min to max whiskers. Two-tailed unpaired t-tests were performed to determine the significance levels for n and p. *p < 0.05; **p < 0.01; ns—non-significant. Source data are provided as a Source Data file.
Fig. 5
Fig. 5. TYK2 regulates the IFNα responses in SC-islets.
a Immunoblot analysis for the phosphorylation of STAT1, STAT2, and STAT3 in Stage (S) 6 SC-islets in response to either IFNα or IFNγ treatment (n = 3). b Heatmap showing the differentially expressed genes in the WT (3348 cells), WT + IFNα (5202 cells), KO (4550 cells), and KO + IFNα (4281 cells) samples. Single-cell transcriptomics performed following 24 h IFNα (100 ng/ml) treatment on the WT and TYK2 KO S6 SC-islets. c Volcano plot showing the significant upregulated (soft Red), downregulated (iris blue) and non-significant (black) genes in response to IFNα treatment in β-like cells and α-like cells. d GSEA (KEGG) for selected enriched gene sets shown in α- and β- like cells in response to IFNα treatment. e Violin plots showing the normalized expression of Constitutive proteasome genes, Immunoproteasome genes, Transporter associated with antigen processing genes and f MHC Class Ι genes in S6 β- like cells in response to IFNα. Source data are provided as a Source Data file.
Fig. 6
Fig. 6. TYK2 modulates MHC Class I presentation in SC-islets.
a, b Representative images of Stage 7 SC-islets showing the immunocytochemistry for insulin (red) and MHC Class Ι (green) expression following 24 h treatment with IFNα alone or in combination with TYK2i (n = 3). Panel a, WT cells; panel b, TYK2 KO cells. Scale bar = 50 μm. c, d Representative contour plots of flow cytometry showing the expression of insulin and MHC Class Ι following 24 h IFNα treatment. Panel c, WT cells; panel d, TYK2 KO cells. e Quantification of the data in c, d (n = 4). Two-tailed unpaired t-test was performed to determine the significance levels. Box and whiskers plot showing median with min to max whiskers. ***p < 0.001. Source data are provided as a Source Data file.
Fig. 7
Fig. 7. TYK2 inhibition modulates T-cell-mediated cytotoxicity in SC-islets.
a Schematic of T-cell/SC-islet co-culture experiments. Increasing numbers of flu peptide-reactive CD8+ T cells were incubated for 6 h with a fixed mixture of peptide-pulsed, CFSE-labelled SC-islets and unpulsed, CellTrace Violet (CTV)-labelled SC-islets, which were preliminary treated for 24 h with IFNα alone or in combination with TYK2i or left untreated. The ratio of surviving (Live/Dead-negative) pulsed CFSE+ vs. unpulsed CTV+ SC-islets thus provided a readout of peptide-specific lysis. b Representative flow cytometry contour plots of IFNα-treated (top) and IFNα/TYK2i-treated SC-islets (bottom), cultured alone (left) or with T cells at an effector-to-target (E:T) ratio of 10:1 (right). Each population is gated on Live/Dead-negative events. The percent peptide-specific lysis in the presence of T cells (i.e., the ratio of CFSE+/CTV+ live cells normalized to the ratio in the absence of T cells) is indicated. c Peptide-specific lysis for the indicated conditions at different E:T ratios. Data are normalized means ± SEM of two experiments performed in triplicates: *p < 0.05 by two-tailed Mann–Whitney U test vs IFNα. d Representative flow cytometry histograms of MHC Class Ι (top) and PD-L1 expression (bottom) in SC-islet targets treated with IFNα (left) or IFNα/TYK2i (right). e, f Mean fluorescence intensity of e MHC Class Ι and f PD-L1 expression in SC-islets at different E:T ratios. Data are means ± SEM of duplicate wells and one representative experiment out of two performed is shown. Source data are provided as a Source Data file.

References

    1. Mallone R, Eizirik DL. Presumption of innocence in type 1 diabetes: Why are beta cells such vulnerable autoimmune targets? Diabetologia. 2020;63:1999–2006. - PubMed
    1. Eizirik DL, Pasquali L, Cnop M. Pancreatic β-cells in type 1 and type 2 diabetes mellitus: different pathways to failure. Nat. Rev. Endocrinol. 2020;16:349–362. - PubMed
    1. Pociot F. Type 1 diabetes genome-wide association studies: Not to be lost in translation. Clin. Transl. Immunol. 2017;6:e162–e167. - PMC - PubMed
    1. Marroqui L, et al. TYK2, a candidate gene for type 1 diabetes, modulates apoptosis and the innate immune response in human pancreatic β-cells. Diabetes. 2015;64:3808–3817. - PubMed
    1. Colli, M. L. et al. An integrated multi-omics approach identifies the landscape of interferon-α-mediated responses of human pancreatic beta cells. Nat. Commun.11, 2584 (2020). - PMC - PubMed

Publication types

MeSH terms