. 2022 Nov;611(7937):733-743.
doi: 10.1038/s41586-022-05202-1. Epub 2022 Oct 26.

The co-evolution of the genome and epigenome in colorectal cancer

Affiliations

The co-evolution of the genome and epigenome in colorectal cancer

Timon Heide et al. Nature. 2022 Nov.

Abstract

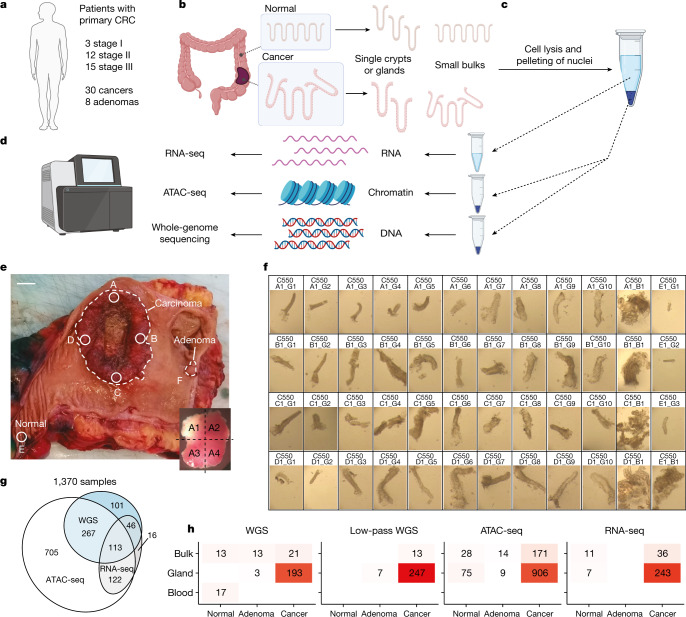
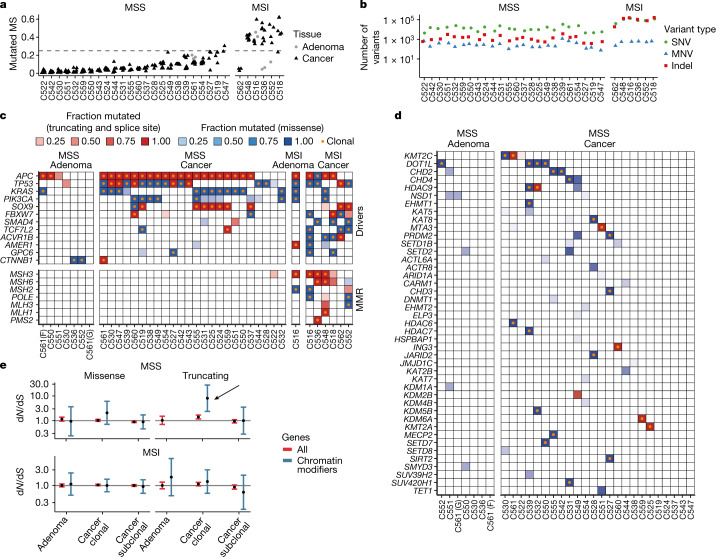
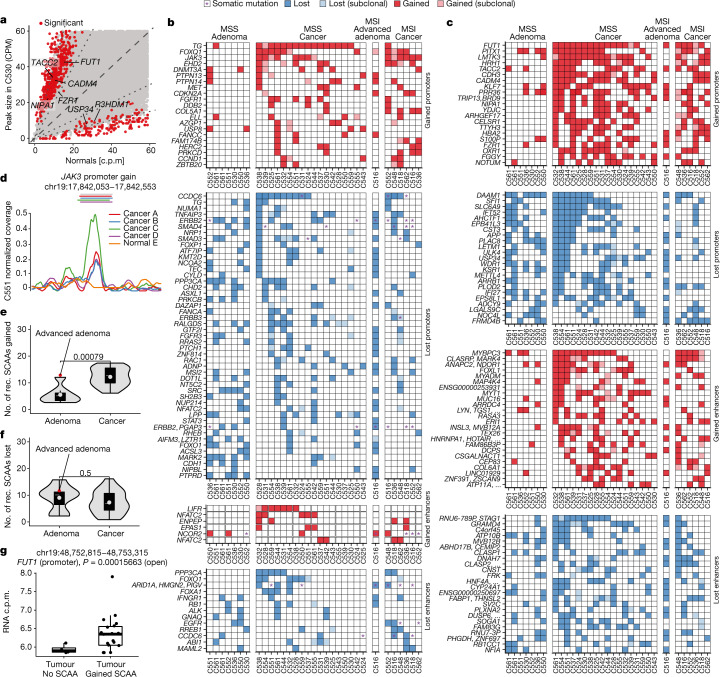
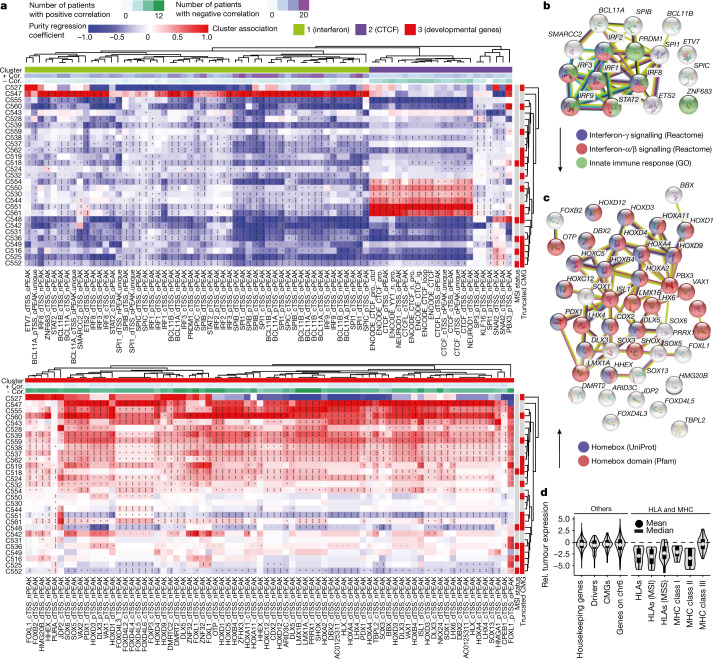
Colorectal malignancies are a leading cause of cancer-related death1 and have undergone extensive genomic study2,3. However, DNA mutations alone do not fully explain malignant transformation4-7. Here we investigate the co-evolution of the genome and epigenome of colorectal tumours at single-clone resolution using spatial multi-omic profiling of individual glands. We collected 1,370 samples from 30 primary cancers and 8 concomitant adenomas and generated 1,207 chromatin accessibility profiles, 527 whole genomes and 297 whole transcriptomes. We found positive selection for DNA mutations in chromatin modifier genes and recurrent somatic chromatin accessibility alterations, including in regulatory regions of cancer driver genes that were otherwise devoid of genetic mutations. Genome-wide alterations in accessibility for transcription factor binding involved CTCF, downregulation of interferon and increased accessibility for SOX and HOX transcription factor families, suggesting the involvement of developmental genes during tumourigenesis. Somatic chromatin accessibility alterations were heritable and distinguished adenomas from cancers. Mutational signature analysis showed that the epigenome in turn influences the accumulation of DNA mutations. This study provides a map of genetic and epigenetic tumour heterogeneity, with fundamental implications for understanding colorectal cancer biology.


Conflict of interest statement

A.-M.B. has received honoraria from Pfizer and Eisai for non-promotional educational content in the field of genomics.

Figures

Fig. 1
Fig. 1. Spatial single-gland multi-omics.
a, Fresh colectomy specimens from 30 patients with stage I–III CRC were used to collect tissue from 30 cancers and 8 adenomas. b, Single glands and small bulks (minibulks) were isolated from normal and neoplastic samples. c, We performed cell lysis followed by nuclei pelleting on each sample. d, Cytosolic fractions were used for RNA-seq whereas nuclei were used for WGS and ATAC-seq. e, We identified separate regions of the specimen: carcinoma (A, B, C and D), a distant normal sample (E) and adenomas if present (F, G and H). Each sample was split into 4 fragments (inset). Scale bar, 1 cm. f, From each fragment, we collected individual glands (labelled as _G) as well as minibulks (agglomerates of a few dozen crypts, labelled as _B). g, We performed multi-omics using WGS, ATAC-seq and RNA-seq on the same sample, achieving a good level of overlap between assays. h, For each assay, we had representative samples from normal, adenoma and cancer regions. Graphics in bd were created with BioRender.com.
Fig. 2
Fig. 2. DNA alterations in canonical cancer drivers and chromatin modifier genes.
a, MSI frequency per case. Each data point shows the fraction of mutated microsatellites reported by MSIsensor in a sample. More than 25% mutated microsatellites suggest MSI. b, Mutational burden by type of mutation across all cancer samples of a given case (MNV, multiple-nucleotide variant). c, Fraction of samples in which recurrently mutated CRC driver genes were mutated (shading) and the type of the corresponding mutation (colour). Orange dots indicate that the mutation is clonal (that is, present in all samples). MMR, mismatch repair. d, Truncating mutations and indels in chromatin modifier genes in MSS cases. e, dn/dS analysis of clonal and subclonal chromatin modifier mutations in MSS and MSI cancers and adenomas reveals significant selection in clonal truncating mutations in chromatin modifier genes in MSS carcinomas (see arrow). The error bars are 95% confidence interval; points show the maximum-likelihood estimate; numbers of cases were n = 7 and n = 24 for the MSS adenomas and cancers, respectively, and n = 1 and n = 6 for the MSI adenoma and cancers, respectively.
Fig. 3
Fig. 3. SCAAs in cancers and adenomas.
a, Example of SCAAs detected in cancer C530 versus normal. Significantly altered peaks are shown in red. MS, microsatellite. b, SCAAs affecting known cancer driver genes occurring in ≥4 cases. Stars indicate DNA mutations found in the gene. c, Summary of the 25 most recurrent SCAAs in promoter and putative enhancers of genes not previously associated with cancer through DNA mutation. Subclonal changes are marked in shaded squares. d, Clonal somatic peak gained at the JAK3 promoter in cancer C551. The plot shows the normalised peak coverage of glands from different regions (see colour legend). The coloured lines on top of the plot show called peaks and the grey line shows the interval of the reference peak. e,f, SCAA burden of adenomas versus carcinomas for gain (e) versus loss (f) of accessibility. The number of gains, but not losses, of accessibility differed significantly (two-sided t-test) between adenomas (n = 8) and cancers (n = 24) after subsampling the number of reads in carcinomas to those in adenomas. The lower and upper hinges of the boxes show the first and third quartiles. The whiskers extend to the largest and smallest value up to 1.5 times the interquartile range from the hinges, and values outside this range are shown as individual points. The grey horizontal lines within the boxes indicate the median, and the dots indicate the mean. The advanced adenoma of C516 is highlighted as a red dot. rec., recurrent. g, Example of a promoter for which we confirmed changes in gene expression. The gene expression between the groups of cancers with matched RNA-seq that showed evidence of accessibility gain (n = 18) and those that did not (n = 5) was compared using the DESeq2 contrast function.
Fig. 4
Fig. 4. Accessibility of the TF-binding site is rewired in tumours.
a, The differential signal across TF-binding sites between tumour and normal samples (see Extended Data Fig. 3) was regressed against transcription start site enrichment and purity to identify altered TF binding accessibility in tumours. Results are shown here for the three main clusters of differentially accessible TF loci (heatmap colour is the regression coefficient; star indicates significance). Main cluster identity is denoted by the top annotation columns. IRF, interferon-regulatory factor. b, STRINGdb analysis of the green TF cluster highlights downregulation of interferon signalling. GO, Gene Ontology. c, STRINGdb analysis of the red cluster indicates upregulation of the activity of developmental genes of the homeobox family. d, Relative (Rel.) tumour expression of HLA genes versus other gene groups. The lower and upper hinges of the boxes show the first and third quartiles. The whiskers extend to the largest and smallest value up to 1.5 times the interquartile range from the hinges, and values outside this range are shown as individual points. The grey horizontal lines within the boxes indicate the median, and the dots indicate the mean. Housekeeping genes from Ref. . CMGs, chromatin modifier genes. MHC, major histocompatibility complex.
Fig. 5
Fig. 5. DNA mutational signatures and the epigenome.
a, Clonal and subclonal mutational signature composition for each case. CpG demethyl., CpG demethylation. b, The epigenome influences accumulation of deamination signature 1 in distinct regions, both for clonal and subclonal mutations. c, Signature SparseSignature4, mostly present subclonally, is also influenced by the epigenome status. d, Signature SparseSignature5, particularly at the subclonal level, is again depleted in active regions as SparseSignature1. e, The proportion of each signature for every cluster responsible for generating loss or gain of CTCF binding affinity in our cohort.
Extended Data Fig. 1
Extended Data Fig. 1. Chromosomal differences between adenomas and carcinomas.
(A) Ploidy and (B) PGA (Percentage Genome Altered) of adenomas vs carcinomas, separated by MSI/MSS status (Number of samples per group: 10 Adenoma MSI, 13 Adenoma MSS, 66 Carcinoma MSI, 408 Carcinoma MSS). The lower and upper hinges of the boxes show the first and third quartiles, the black the horizontal lines show the medians. Whiskers extend to the most extreme values up to 1.5 inter quartile ranges from the whiskers and values outside of this range are shown as individual points. (C) Comparison of the two values.
Extended Data Fig. 2
Extended Data Fig. 2. Recurrence of SCAA.
A) Number of times each promoter and B) enhancer showed gained (y-axis) and reduced (x-axis) accessibility.
Extended Data Fig. 3
Extended Data Fig. 3. Transcription factor binding site accessibility is rewired in tumours.
(A) TF binding site accessibility (in this example CTCF) is computed by summing the signal of ATAC-seq reads centred at the binding site, plotted against read length. (B) The same is done for the normal controls. (C) Signal from the normal is subtracted from the signal from the cancer to assess differential accessibility. TF accessibility for CTCF is reduced in this example as demonstrated by fewer ATAC cuts at the binding site in the cancer.

References

    1. Sung H, et al. Global cancer statistics 2020: GLOBOCAN estimates of incidence and mortality worldwide for 36 cancers in 185 countries. CA Cancer J. Clin. 2021;71:209–249. doi: 10.3322/caac.21660. - DOI - PubMed
    1. The Cancer Genome Atlas Network. Comprehensive molecular characterization of human colon and rectal cancer. Nature. 2012;487:330–337. doi: 10.1038/nature11252. - DOI - PMC - PubMed
    1. Cross W, et al. The evolutionary landscape of colorectal tumorigenesis. Nat. Ecol. Evol. 2018;2:1661–1672. doi: 10.1038/s41559-018-0642-z. - DOI - PMC - PubMed
    1. Mazor T, Pankov A, Song JS, Costello JF. Intratumoral heterogeneity of the epigenome. Cancer Cell. 2016;29:440–451. doi: 10.1016/j.ccell.2016.03.009. - DOI - PMC - PubMed
    1. Black JRM, McGranahan N. Genetic and non-genetic clonal diversity in cancer evolution. Nat. Rev. Cancer. 2021;21:379–392. doi: 10.1038/s41568-021-00336-2. - DOI - PubMed

Publication types