. 2022 Nov;611(7937):744-753.
doi: 10.1038/s41586-022-05311-x. Epub 2022 Oct 26.

Phenotypic plasticity and genetic control in colorectal cancer evolution

Affiliations

Phenotypic plasticity and genetic control in colorectal cancer evolution

Jacob Househam et al. Nature. 2022 Nov.

Abstract

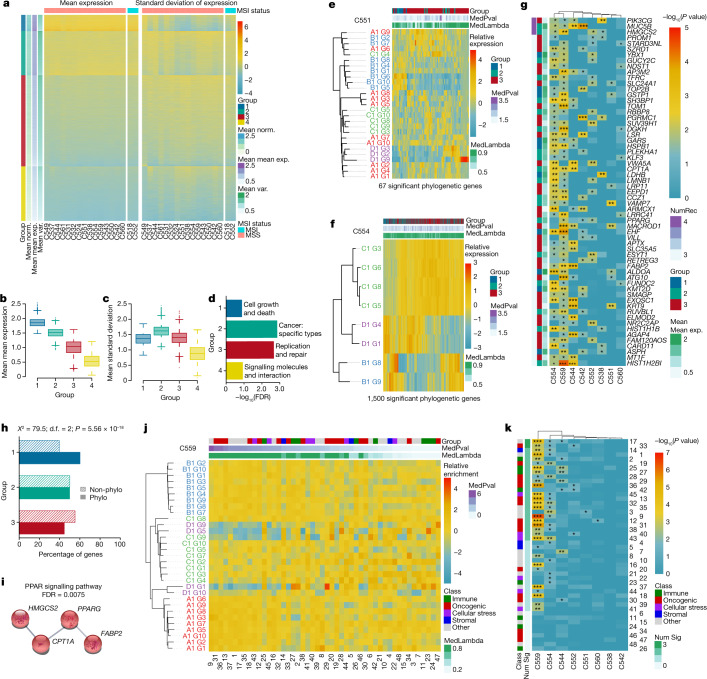
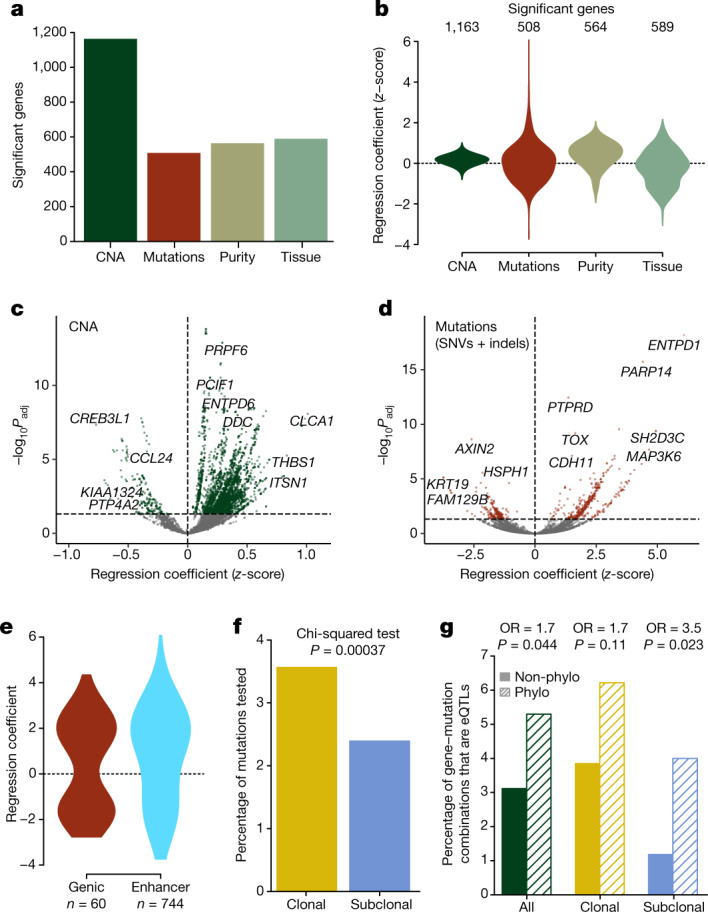
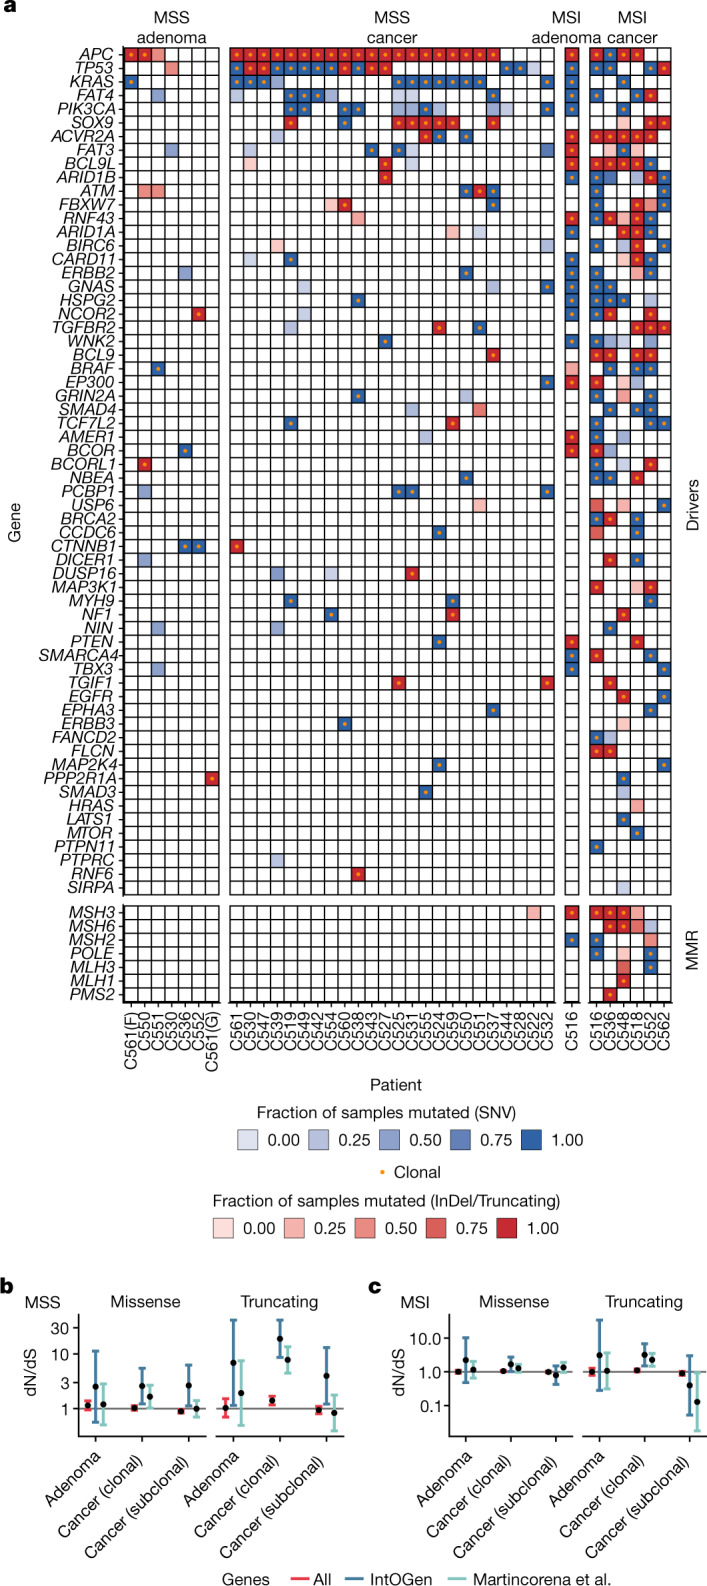
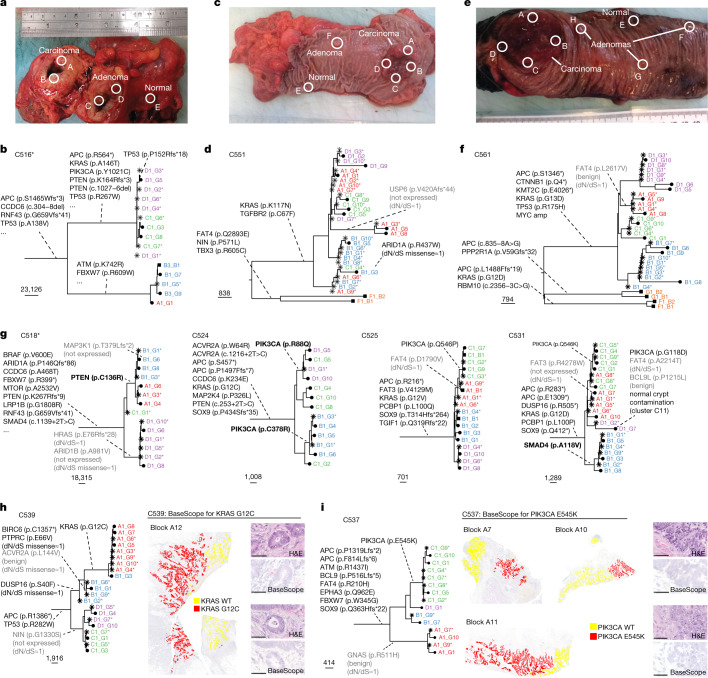
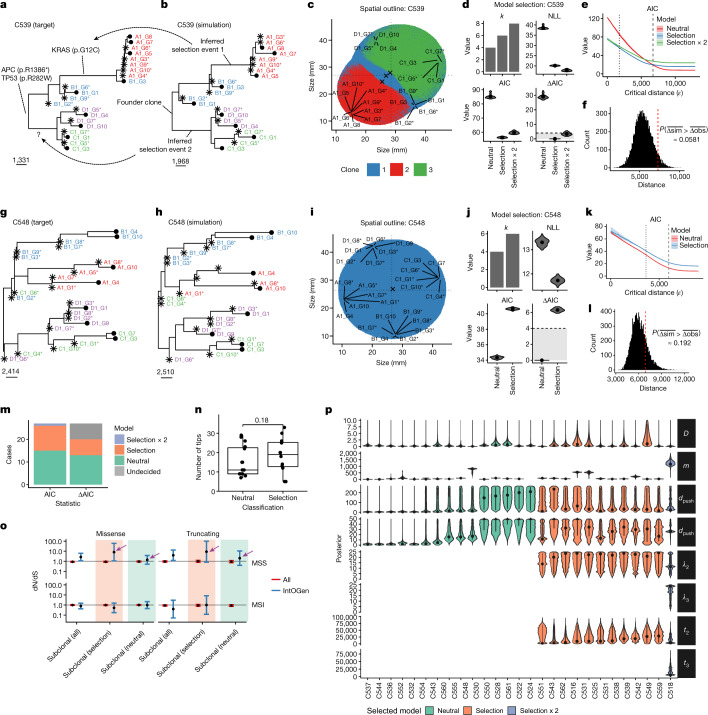
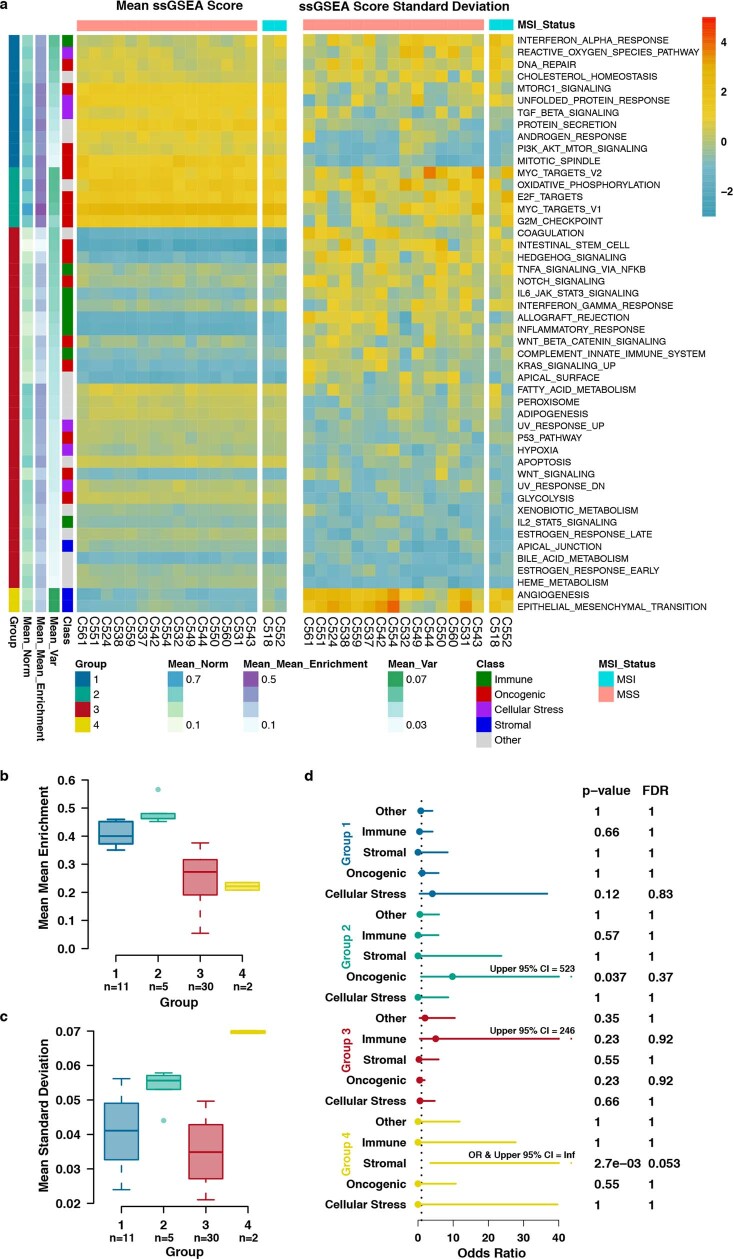
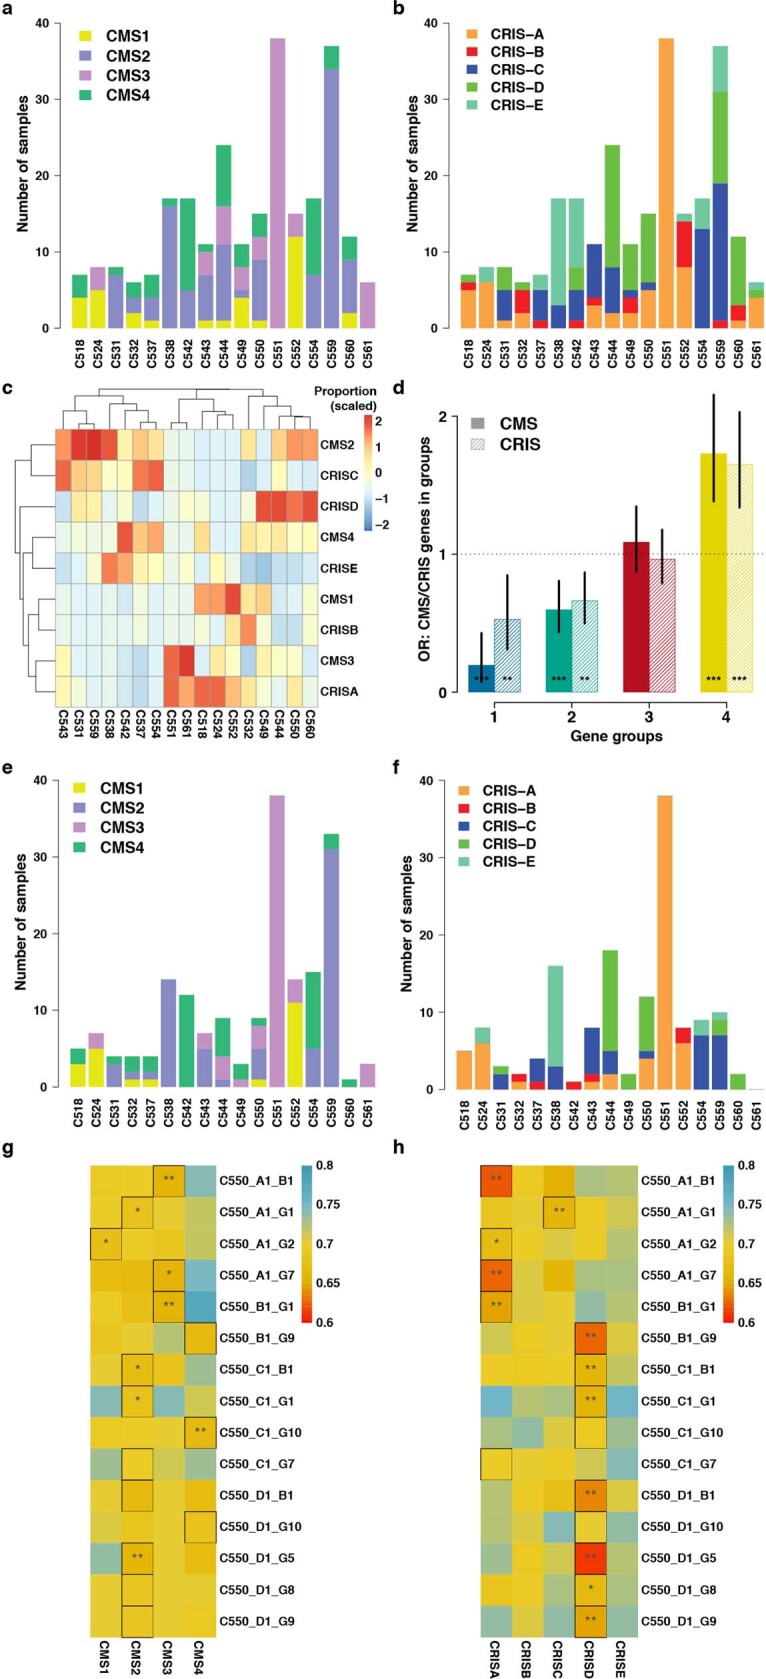
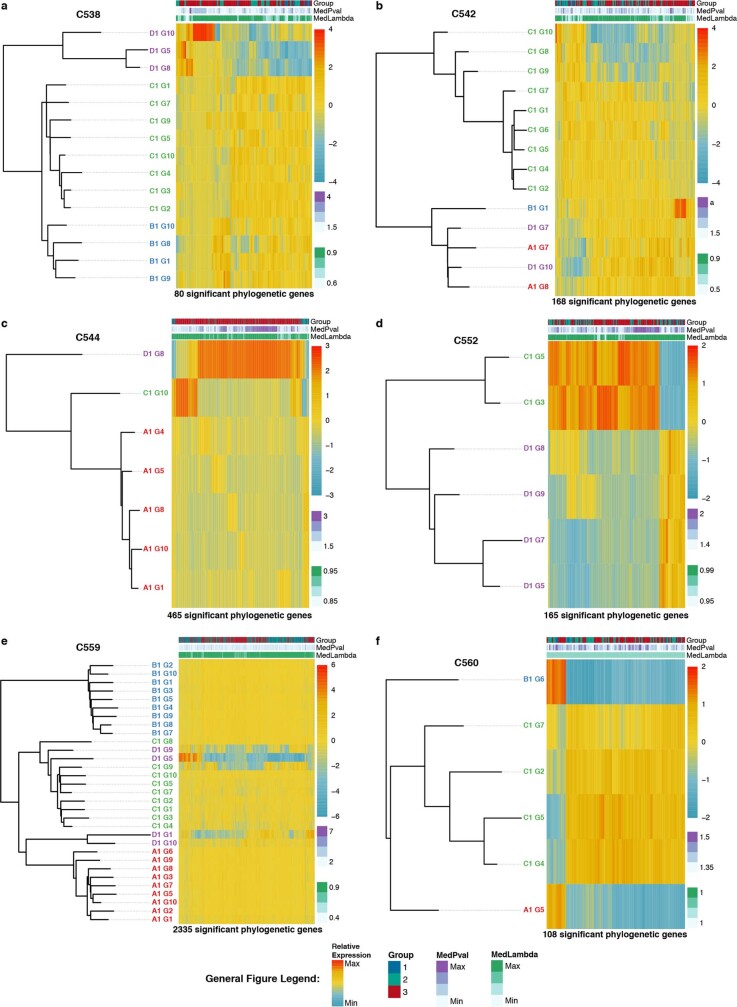
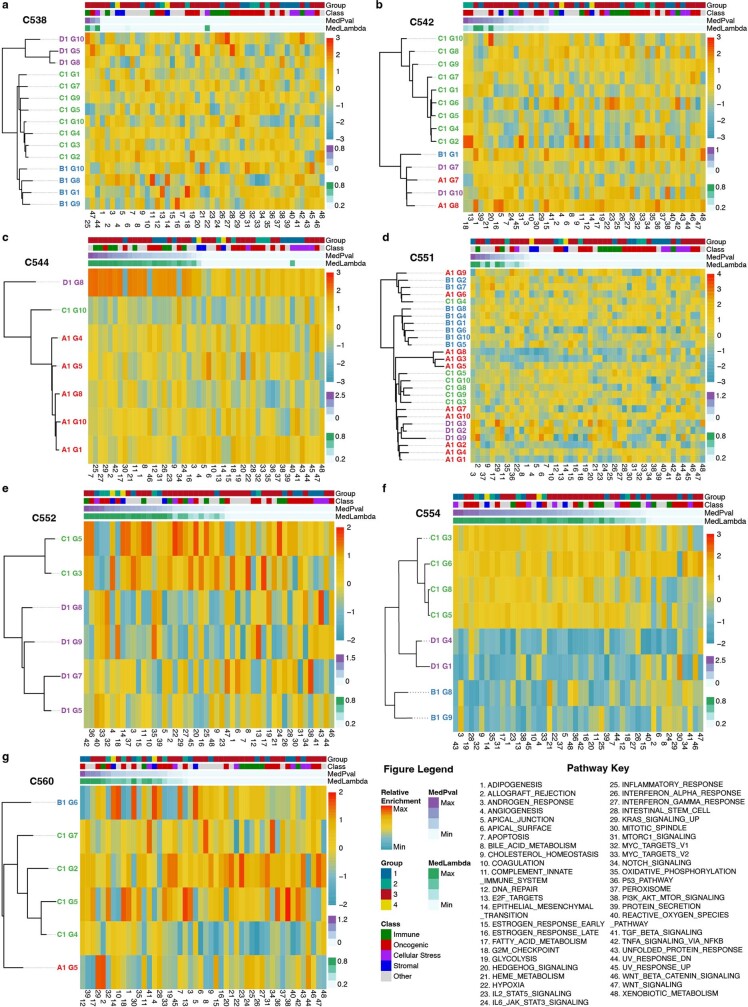
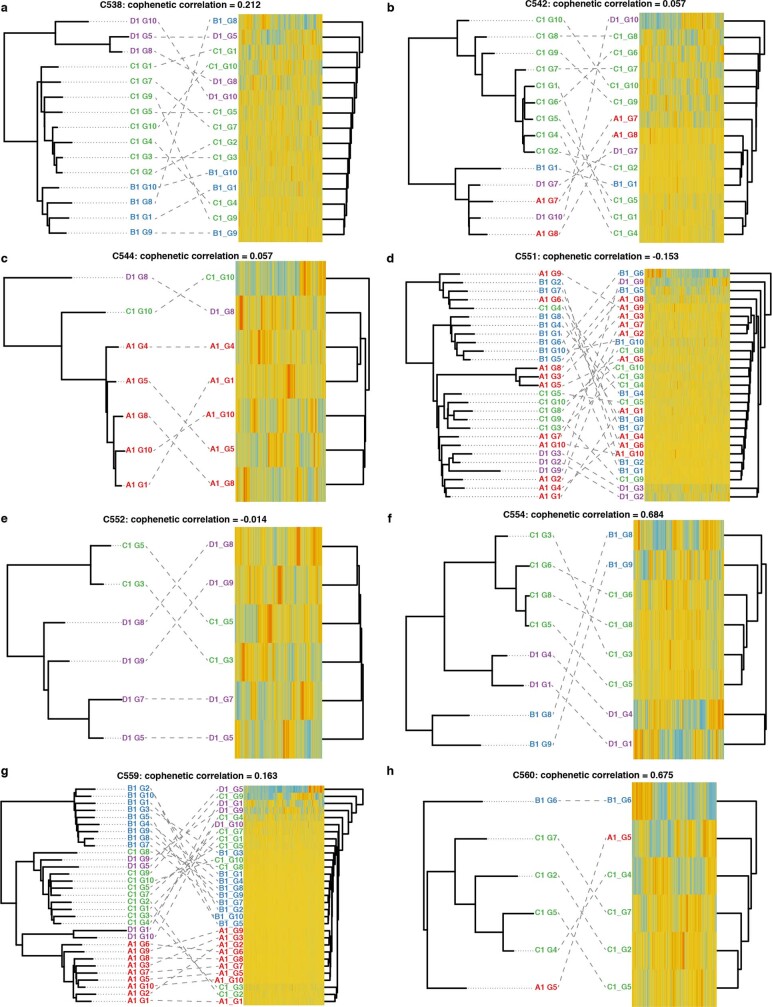
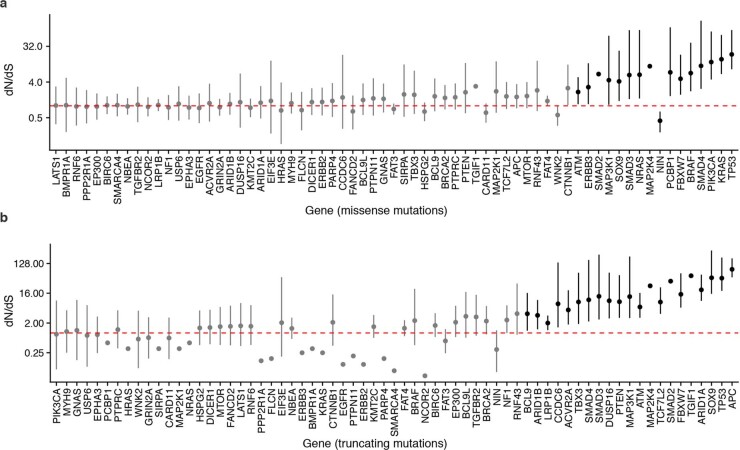
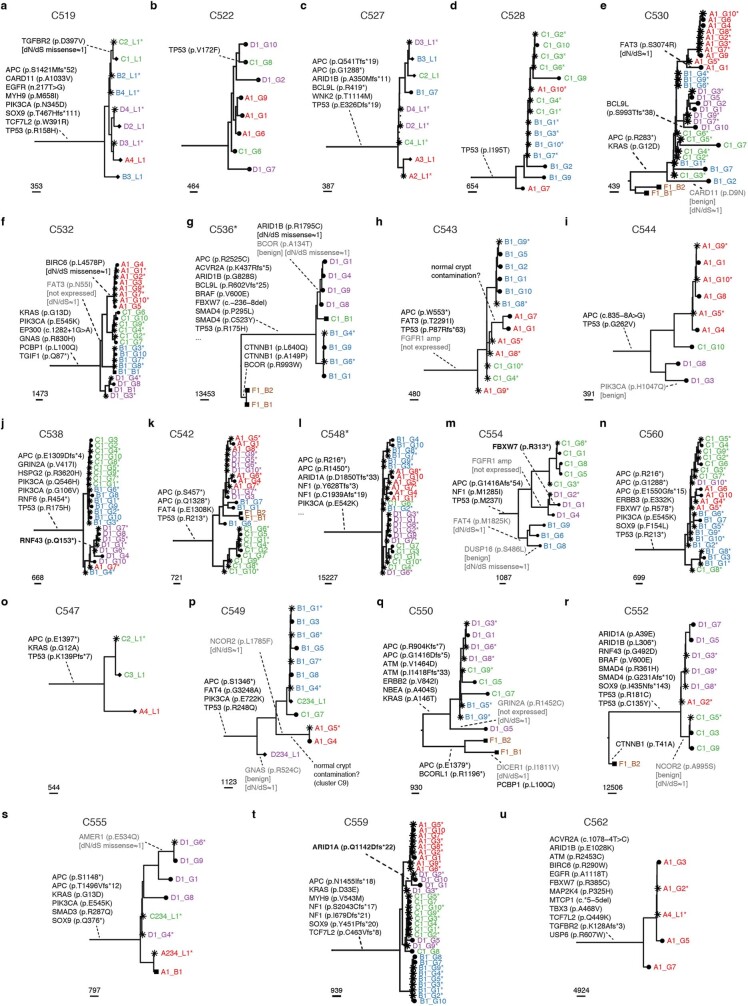
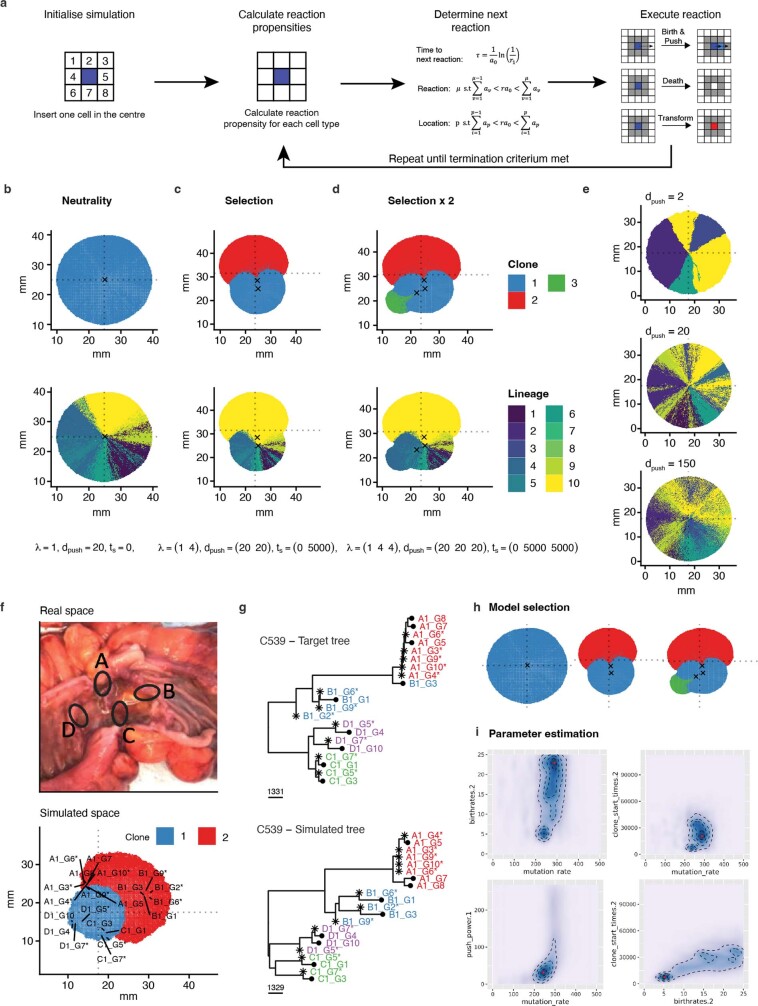
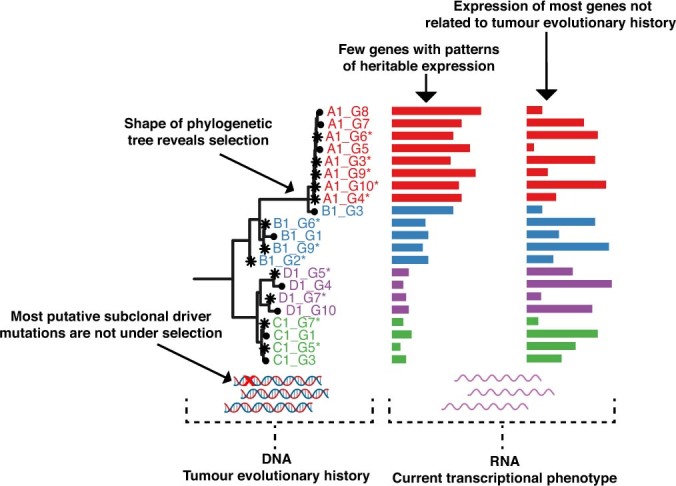
Genetic and epigenetic variation, together with transcriptional plasticity, contribute to intratumour heterogeneity1. The interplay of these biological processes and their respective contributions to tumour evolution remain unknown. Here we show that intratumour genetic ancestry only infrequently affects gene expression traits and subclonal evolution in colorectal cancer (CRC). Using spatially resolved paired whole-genome and transcriptome sequencing, we find that the majority of intratumour variation in gene expression is not strongly heritable but rather 'plastic'. Somatic expression quantitative trait loci analysis identified a number of putative genetic controls of expression by cis-acting coding and non-coding mutations, the majority of which were clonal within a tumour, alongside frequent structural alterations. Consistently, computational inference on the spatial patterning of tumour phylogenies finds that a considerable proportion of CRCs did not show evidence of subclonal selection, with only a subset of putative genetic drivers associated with subclone expansions. Spatial intermixing of clones is common, with some tumours growing exponentially and others only at the periphery. Together, our data suggest that most genetic intratumour variation in CRC has no major phenotypic consequence and that transcriptional plasticity is, instead, widespread within a tumour.


Conflict of interest statement

A.-M.B. has received honoraria from Pfizer and Eisai for non-promotional educational content in the field of genomics. F.I. receives funding from Open Targets, a public–private initiative involving academia and industry, and performs consultancy for the joint CRUK–AstraZeneca Functional Genomics Centre. All other authors declare no competing interests.

Figures

Fig. 1
Fig. 1. Heterogeneity of gene expression and phylogenetic signal in CRC.
a, Heatmaps showing clustering of genes by expression level across tumours (left) and expression variation within tumours (right). Hierarchical clustering showed four distinct groups, groups 1–4. Units are scaled by column in each heatmap. b,c, Summary box plots per gene group (group 1, 891 genes; group 2, 2,444 genes; group 3, 5,033 genes; group 4, 3,033 genes). Mean expression level (b) and intratumour heterogeneity of expression (c) per group, as measured by s.d. d, Meta-KEGG pathway analysis showing which pathway categories are most over-represented in each group (after removal of ‘infectious disease: bacterial’ and ‘neurodegenerative disease’—most significant in group 1). e,f, Phylogenetic trees and heatmaps of genes with evidence of phylogenetic signal (at < 0.05) for tumours C551 (e) and C554 (f). g, Heatmap of genes with recurrent phylogenetic signal across tumours (those which were found to have evidence of phylogenetic signal in at least three tumours). h, Results of chi-squared test showing whether gene groups were enriched for phylogenetic genes (those with evidence of phylogenetic signal in at least one tumour—“Phylo”) compared to all other genes (“Non-phylo”). i, Enrichment of KEGG PPAR signalling pathway for recurrently phylogenetic genes. j, Example phylogenetic tree and pathway enrichment heatmap for tumour C559. Pathways are ordered by decreasing significance of phylogenetic signal. k, Heatmap showing recurrence of phylogenetic signal of pathways across tumours. Pathways are ordered by decreasing recurrence. Refer to pathway key in Extended Data Fig. 4 for pathway names. *P < 0.05, **P < 0.01, ***P < 0.001; Mean norm., mean gene expression in normal samples; Mean mean exp., mean of mean gene expression per tumour; Mean var., mean standard deviation of gene expression; MedPval, median P-value from forest of 100 trees; MedLambda, median λ value from forest of 100 trees; NumRec, number of tumours in which gene has evidence of phylogenetic signal; Num Sig, number of tumours in which pathway has evidence of phylogenetic signal; d.f., degrees of freedom. Source data
Fig. 2
Fig. 2. Genetic control of expression with eQTL.
a, The number of genes with significant models for each data type. b, Distribution of regression coefficients (effect sizes) for each data type. c,d, Volcano plots highlighting selected genes significant for SCNA (c) and Mut eQTLs (d) (linear regression two-sided t-tests; Padj, FDR-adjusted P values). e, In comparison with non-synonymous mutations (NS), enhancer (Enh) mutations tended to have large effect sizes and a higher proportion of positive effect sizes. f, The proportion of subclonal mutations associated with detectable changes in cis gene expression was significantly lower than for clonal eQTL mutations. g, Visualization of Fisher’s exact tests showing that gene–mutation combinations were more likely to be eQTLs if they were associated with recurrent phylogenetic genes (genes found to have evidence of phylogenetic signal in at least three tumours) for subclonal mutations, and that this was not significant for clonal mutations. Phylo and Non-phylo indicate whether a gene had evidence of phylogenetic signal in the tumour in which the mutation was present. Two-sided Fisher’s exact tests, P values not corrected for multiple testing. Source data
Fig. 3
Fig. 3. Phylogenetic driver analysis.
a, Non-synonymous somatic mutations and indels in IntOGen CRC driver genes, with clonality status indicated. b,c, dN/dS analysis of clonal versus subclonal driver gene mutations, divided between MSS (b) (7 adenomas and 24 cancers) and MSI (c) (1 advanced adenoma and 6 cancers). Error bars indicate 95% confidence intervals. MMR, mismatch repair (genes). Source data
Fig. 4
Fig. 4. Spatial phylogenomics of colorectal cancer.
a, In this MSI tumour (C516) the cancer (regions A and B) and macroscopically diagnosed advanced adenoma (regions C and D) formed a large mass and were physically adjacent to one another. Photo indicates sampling quadrant, not precise location. b, The advanced adenoma shared multiple drivers with the cancer but showed early divergence. c, Tumour C551 presented with a cancer and a concomitant adenoma that were very distant, indicating two independent events. d, The phylogenetic tree was characterized by clonal intermixing of diverging lineages collocated in the same region (for example, some lineages from regions A, B and C were genetically close). Subclonal drivers of unknown significance were present, including a non-expressed variant in USP6 and an ARID1A mutation. Early divergence between the cancer and adenoma F was evident, with no shared drivers between the two lesions. e, Tumour C561 presented with a large cancer mass and multiple small concomitant adenomas. f, Again, there was no notable somatic alteration in common between the different lesions. The cancer showed clonal amplification of MYC and only a benign subclonal mutation in FAT4. g, Phylogenetic reconstruction of four further tumours with annotated driver events. h,i, Phylogenetic trees with matched in situ mutation detection with BaseScope for the KRAS G12C subclonal variant in C539 (h) and the PIK3CA E545K subclonal variant in C537 (i). Staining by haematoxylin and eosin (H&E) and BaseScope were each performed once; scale bars, 50 μm.
Fig. 5
Fig. 5. Inference of evolutionary dynamics in individual tumours.
a,b, Target tree for C539 (a) versus best simulated tree for C539 (b). c, Spatial patterns and sampling of the simulation. d, Model selection considering the number of parameters (k) and NLL to calculate AIC. AIC differences (ΔAIC) greater than 4 indicate strong preference of a model. e, AIC value with respect to distance from the data (ε) for each of the models. Dotted line indicates final distance of ABC–SMC; dashed line indicates distance of trees with added random uniform noise (0.5–2.0). f, Posterior predictive P value (one-sided). Dashed line indicates average distance between target and simulated trees. g, Target (real) tree for C548. h, Simulated tree for C548 identified during the inference. i, Spatial patterns of simulation that generated the data. j, Model selection for C548. k, AIC value versus ε. l, Posterior predictive P value (one-sided). m, Proportion of instances in which models were selected by model selection. AIC and ΔAIC values are reported, the latter indicating the proportion of tumours that can be explained by both models. n, Inference of selection (AIC) was not associated with a higher number of samples per tumour (one-sided bootstrap test, n = 15 neutral and n = 12 non-neutral). o, Subclonal dN/dS values for carcinoma with and without selection (AIC). Numbers of tumours per group: 3 neutral MSI, 3 selected MSI, 12 neutral MSS and 9 selected MSS carcinomas. Error bars indicate 95% confidence intervals. p, Marginal posterior distributions of parameters, split by neutral (green), selected (orange) and selected ×2 (purple). Source data
Extended Data Fig. 1
Extended Data Fig. 1. Filtering and clustering of pathways based on mean tumour enrichment and intra-tumour heterogeneity of enrichment.
a, Heatmaps showing clustering of pathways by enrichment level across tumours and enrichment variation within tumours. Hierarchical clustering revealed four distinct groups, named Group 1–4. Note units are scaled by column in both heatmaps b, Summary of mean enrichment level per Class. c, Summary of intra-tumour heterogeneity of enrichment per Class, measured by standard deviation. d, Fisher’s exact test (two-sided) results comparing pathway Groups to classes Source data
Extended Data Fig. 2
Extended Data Fig. 2. CMS and CRIS classification heterogeneity.
a, Stacked bar charts showing per-sample classification of CMS in each tumour. b, Stacked bar charts showing classification of CRIS in samples from each tumour. c, Heatmap based on data in (a,b) where colour indicates proportion of samples of a particular CRIS/CMS class. Associations between CMS and CRIS classes are apparent. d, Examination of the enrichment of genes respectively included CMS and CRIS classifications in gene Groups as defined in Fig. 1. Both CRIS and CMS genes are depleted in gene Groups 1&2 but are enriched in Group 4. 11,401 genes used in two-sided Fisher’s exact tests. Error bars represent 95% confidence intervals. e, CMS assignments per tumour, only samples which could be confidently classified (FDR < 0.05) are shown. f, As in (e) but for CRIS. g, Heatmap of centroid distances of each sample from CMS classes for tumour C550, black squares indicate the minimum (most likely) class for each sample, and stars represent significance of classification. h, As in (g) but for CRIS Source data
Extended Data Fig. 3
Extended Data Fig. 3. Phylogenetic trees (left) annotated with the expression of genes (heatmap, right) which had evidence of phylogenetic signal (P<0.05). MedPval = median p-value from forest of 100 trees, MedLambda = median lambda value from forest of 100 trees.
Shown by tumour for: a, C538. b, C542. c, C544. d, C552. e, C559. f, C560 Source data
Extended Data Fig. 4
Extended Data Fig. 4. Phylogenetic trees (left) annotated with pathway enrichment scores (heatmap, right). MedPval = median p-value from forest of 100 trees, MedLambda = median lambda value from forest of 100 trees.
Shown by tumour: a, C538. b, C542. c, C544. d, C551. e, C552. f, C554. g, C560. Numbers on heatmap x-axis indicate hallmark pathways, refer to Pathway Key Source data
Extended Data Fig. 5
Extended Data Fig. 5. Phylogenetic tree versus expression-based clustering.
The dendrogram on the left of each panel is the mutation-based phylogenetic tree, while samples on the right are clustered according to gene expression. Dotted lines show matching samples and samples are coloured according to region-of-origin. a, C538. b, C542. c, C544. d, C551. e, C552. f, C554. g, C559. h, C560 Source data
Extended Data Fig. 6
Extended Data Fig. 6. Per-gene dN/dS analysis of drivers (n = 1,253 CRCs).
a, Per-gene dN/dS for the 69 IntOGen drivers in TCGA colon and rectal cohorts split into (a) missense mutations and (b) truncating mutations. Many genes have dN/dS value ≈1 indicating lack of evidence for positive selection. The points show the point estimates and the error bars the 95% CI intervals of the dN/dS Source data
Extended Data Fig. 7
Extended Data Fig. 7. Phylogenetic reconstruction of more cancers and adenomas.
Putative cancer driver genes from the IntOGen set are reported in each branch. For MSI tumours we report only a subset of the most relevant genes (see Fig. 3a for a full list). For subclonal drivers, we report whether the variant was expressed (bold), not expressed or benign (grey), and if the per-gene dN/dS value was ≈1. a, C519. b, C522. c, C527. d, C528. e, C530. f, C532. g, C536. h, C543. i, C544. j, C538. k, C542. l, C548. m, C554. n, C560. o, C547. p, C549. q, C550. r, C552. s, C555. t, C559. u, C562.
Extended Data Fig. 8
Extended Data Fig. 8. Bayesian inference framework for cancer dynamics in space and time.
a, Schematic representation of the spatial cellular automaton model of tumour growth. b, Instance of simulation of a neutrally expanding cancer with a single ‘functional’ clone (blue, top), and corresponding neutral mutation lineages (bottom). c, Simulation of a tumour containing a differentially selected subclone (red, top) and corresponding neutral mutation lineages (bottom). d, Simulation with two branching subclonal selection events. e, In this neutral simulation we illustrate peripheral versus exponential growth and the effects on lineage mixing. f, Spatial sampling annotated during tissue collection for tumour C539 and corresponding simulated spatial sampling. g, Real data from patient C539 (top) versus simulated data from an instance selected by the inference framework (bottom). h–i, Inference framework based on Approximate Bayesian Computation - Sequential Monte Carlo (ABC-SMC) allows for (h) model selection and (i) posterior parameter estimation given the data. In this case birthrates.2 is the birth rate of the selected subclone, clone_start_times.2 is the time when the subclone arose during the growth of the tumour, push_power.1 is the coefficient of boundary driven growth and mutation_rate is the rate of accumulation of mutations per genome per division.
Extended Data Fig. 9
Extended Data Fig. 9. Visual schematic illustrating the main results.
DNA-sequencing of multiple glands from up to four tumour regions allowed elucidation of tumour evolutionary history and selection inference (left; phylogenetic tree). Matched RNA-sequencing found few genes with heritable expression patterns (middle; bars represent expression level), with the expression of most genes not detectably related to tumour evolutionary history (right; bars represent expression level). Most putative subclonal driver mutations were found to not be under selection, while transcriptomic differences could be found between subclones that were under positive selection. Sample names and bars are coloured according to region-of-origin.

References

    1. Black, J. R. M. & McGranahan, N. Genetic and non-genetic clonal diversity in cancer evolution. Nat. Rev. Cancer21, 379–392 (2021). - PubMed
    1. Turajlic S, Sottoriva A, Graham T, Swanton C. Resolving genetic heterogeneity in cancer. Nat. Rev. Genet. 2019;20:404–416. doi: 10.1038/s41576-019-0114-6. - DOI - PubMed
    1. Williams MJ, Sottoriva A, Graham TA. Measuring clonal evolution in cancer with genomics. Annu. Rev. Genomics Hum. Genet. 2019;20:309–329. doi: 10.1146/annurev-genom-083117-021712. - DOI - PubMed
    1. Sun R, et al. Between-region genetic divergence reflects the mode and tempo of tumor evolution. Nat. Genet. 2017;49:1015–1024. doi: 10.1038/ng.3891. - DOI - PMC - PubMed
    1. Williams MJ, et al. Quantification of subclonal selection in cancer from bulk sequencing data. Nat. Genet. 2018;50:895–903. doi: 10.1038/s41588-018-0128-6. - DOI - PMC - PubMed

Publication types