. 2022 Nov;611(7935):374-379.
doi: 10.1038/s41586-022-05241-8. Epub 2022 Oct 26.

Structural basis of actin filament assembly and aging

Affiliations

Structural basis of actin filament assembly and aging

Wout Oosterheert et al. Nature. 2022 Nov.

Abstract

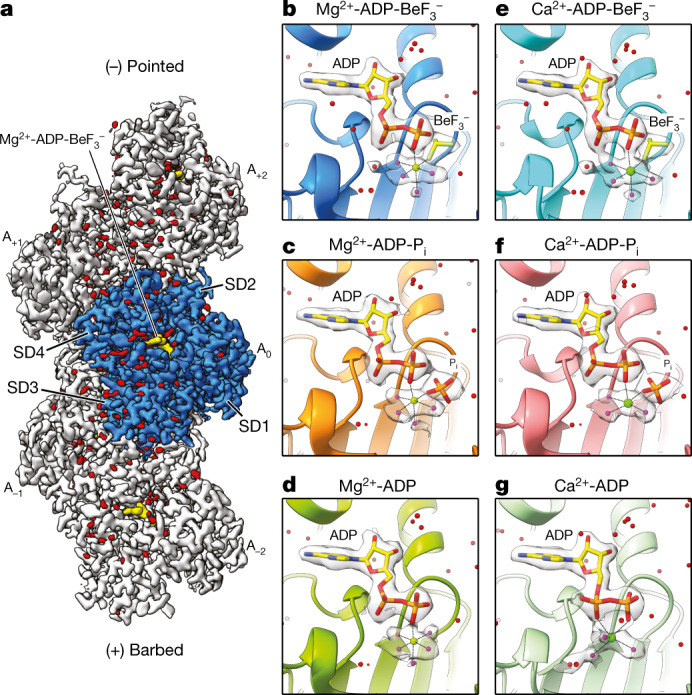
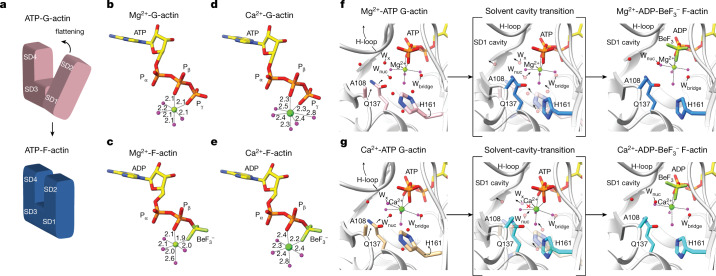
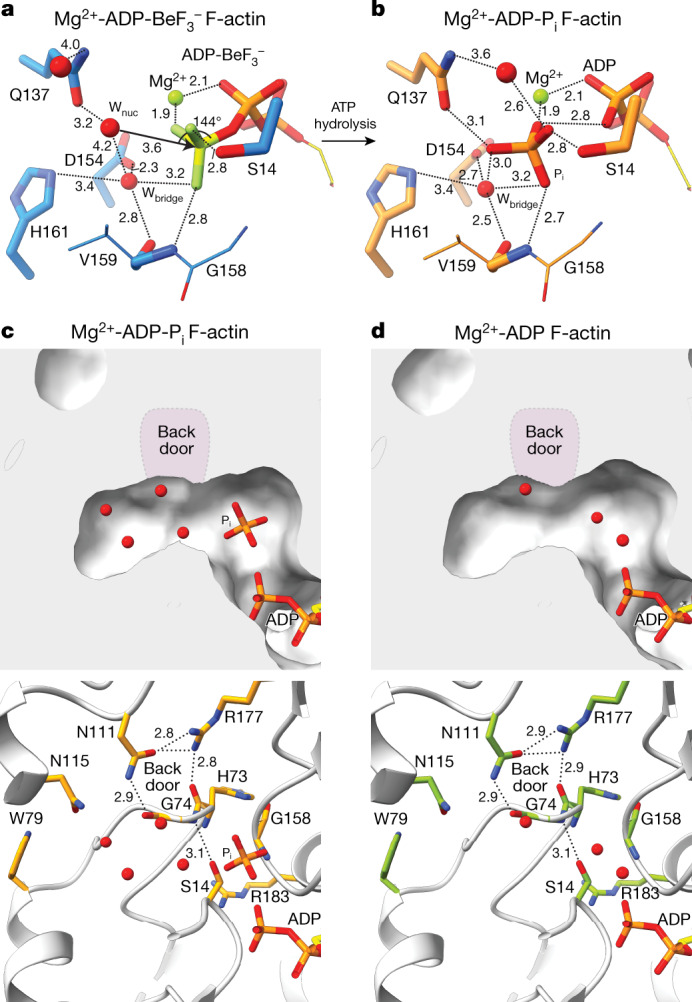
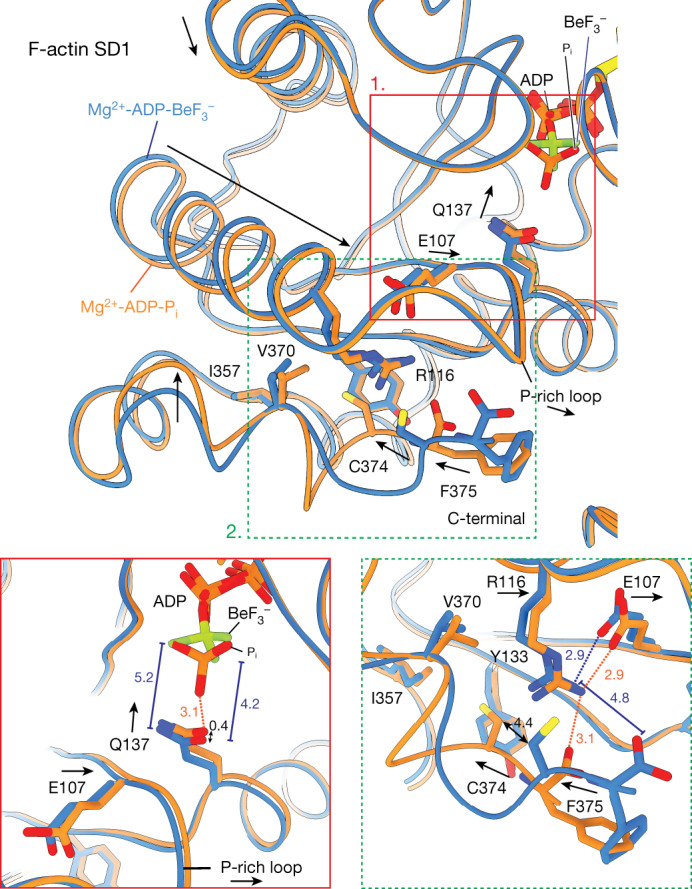
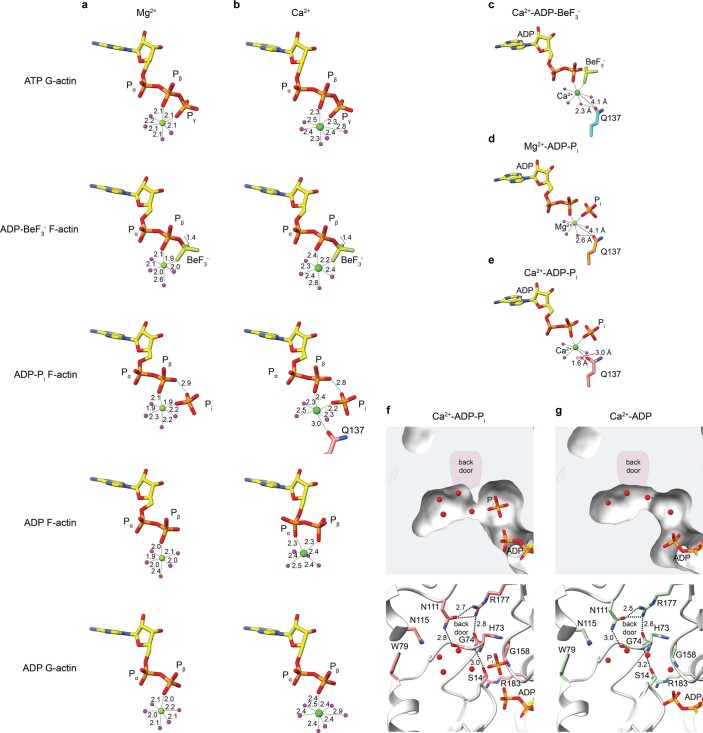
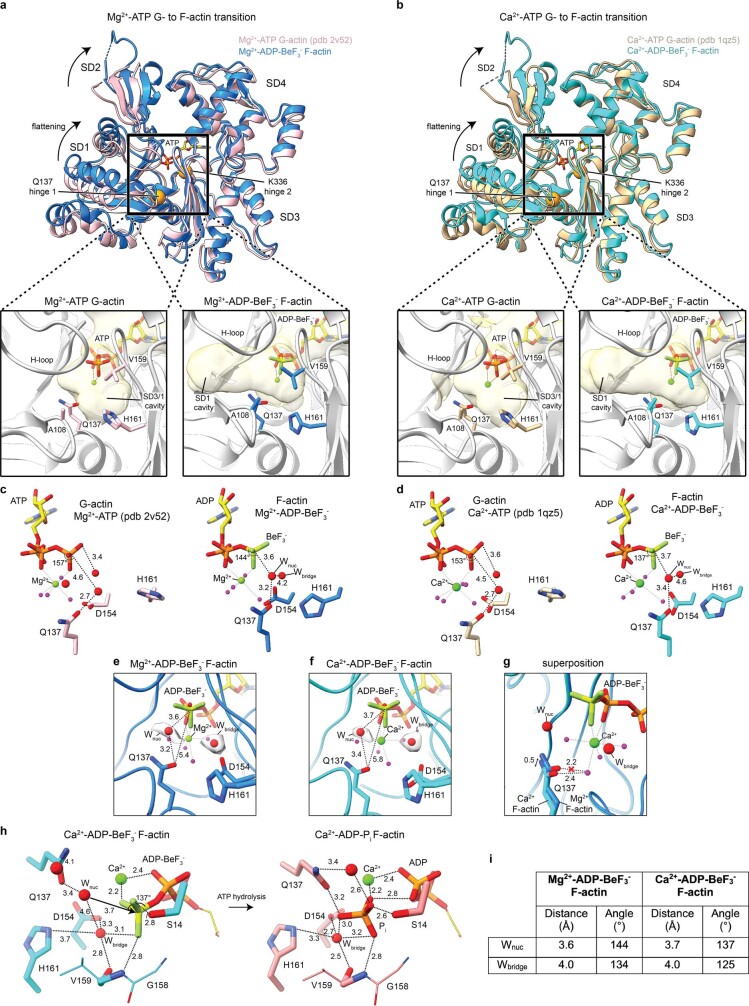
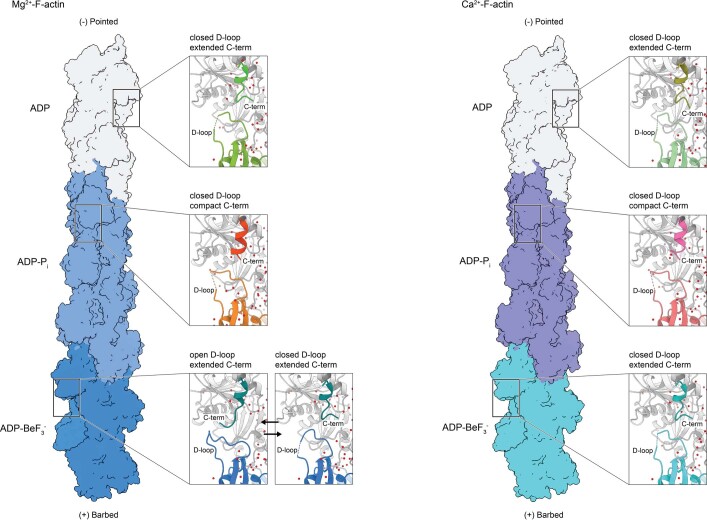
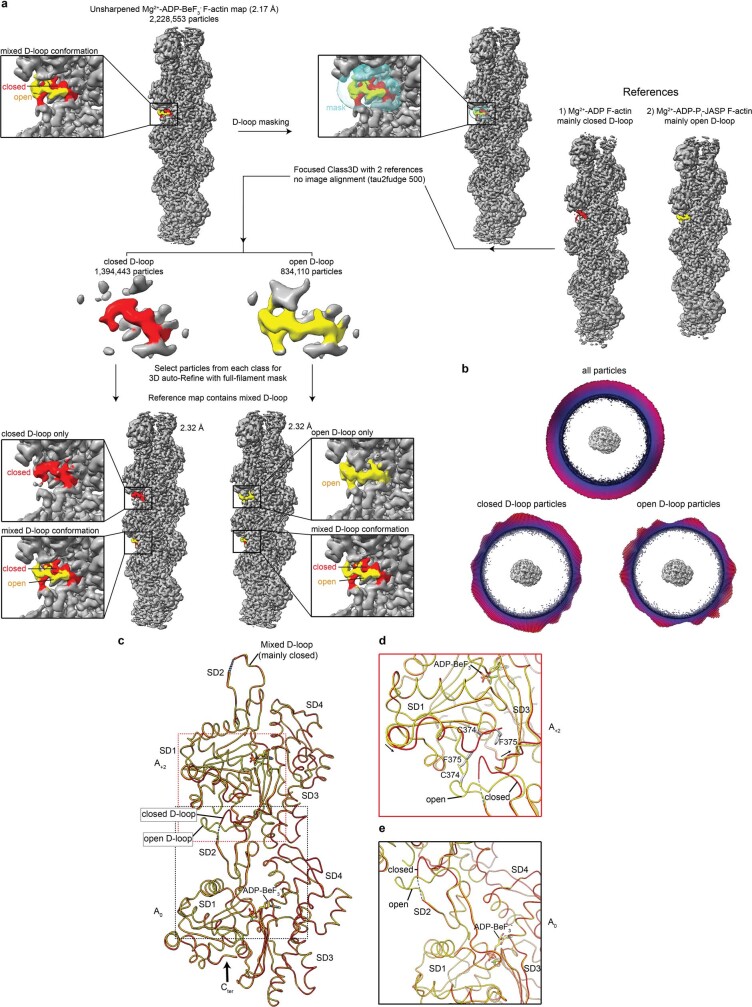
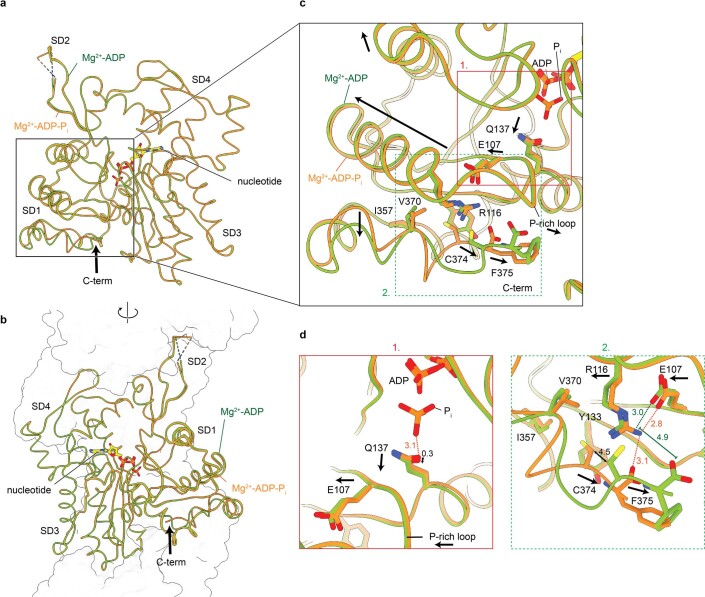
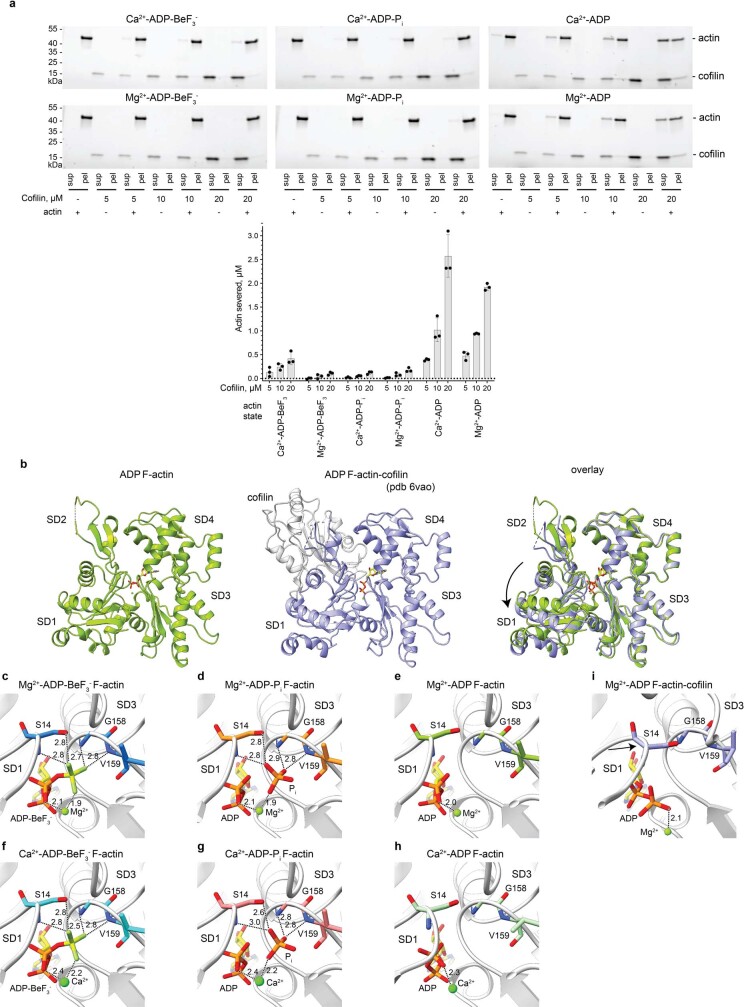
The dynamic turnover of actin filaments (F-actin) controls cellular motility in eukaryotes and is coupled to changes in the F-actin nucleotide state1-3. It remains unclear how F-actin hydrolyses ATP and subsequently undergoes subtle conformational rearrangements that ultimately lead to filament depolymerization by actin-binding proteins. Here we present cryo-electron microscopy structures of F-actin in all nucleotide states, polymerized in the presence of Mg2+ or Ca2+ at approximately 2.2 Å resolution. The structures show that actin polymerization induces the relocation of water molecules in the nucleotide-binding pocket, activating one of them for the nucleophilic attack of ATP. Unexpectedly, the back door for the subsequent release of inorganic phosphate (Pi) is closed in all structures, indicating that Pi release occurs transiently. The small changes in the nucleotide-binding pocket after ATP hydrolysis and Pi release are sensed by a key amino acid, amplified and transmitted to the filament periphery. Furthermore, differences in the positions of water molecules in the nucleotide-binding pocket explain why Ca2+-actin shows slower polymerization rates than Mg2+-actin. Our work elucidates the solvent-driven rearrangements that govern actin filament assembly and aging and lays the foundation for the rational design of drugs and small molecules for imaging and therapeutic applications.


Conflict of interest statement

The authors declare no competing interests.

Figures

Fig. 1
Fig. 1. Cryo-EM reconstructions of F-actin at 2.2 Å resolution.
a, Local-resolution filtered, sharpened cryo-EM density map of F-actin in the Mg2+-ADP-BeF3 state. The subunits are labelled on the basis of their location along the filament, ranging from the barbed (A−2) to the pointed (A2) end. The central actin subunit (A0) is blue and the other four subunits are grey. Actin subdomains (SD1–4, also known as Ia, Ib, IIa and IIb) are annotated in the central subunit. Densities corresponding to water molecules are red. bg, Cryo-EM densities of the nucleotide-binding pocket in F-actin in the Mg2+-ADP-BeF3 (b), Mg2+-ADP-Pi (c), Mg2+-ADP (d), Ca2+-ADP-BeF3 (e), Ca2+-ADP-Pi (f) and Ca2+-ADP (g) states. Mg2+ and Ca2+ are shown as green spheres. Water molecules that directly coordinate the nucleotide-associated cation are magenta. For the Ca2+-ADP structure (g), one coordinating water is hidden behind the Ca2+ ion.
Fig. 2
Fig. 2. Water relocation during the G- to F-actin transition.
a, Schematic cartoon representation of actin flattening during the G- to F-actin transition. be, Nucleotide conformation and inner-coordination sphere of the divalent cation in Mg2+-ATP-G-actin (Protein Data Bank (PDB) 2V52) (b), Mg2+-ADP-BeF3 F-actin (c), Ca2+-ATP-G-actin (PDB 1QZ5) (d) and Ca2+-ADP-BeF3 F-actin (e). Bond lengths are annotated in angstroms. f,g, Water relocation in Mg2+-actin (f) and Ca2+-actin (g). In f and g, the left panel shows water and amino-acid arrangement in ATP-G-actin. Amino acids are pink for Mg2+-actin and light-brown for Ca2+-actin, whereas the cartoon representation is shown in grey. Arrows depict the movement of amino-acid regions for the transition to F-actin. The middle panel shows overlay of the amino-acid positions in ADP-BeF3 F-actin (blue for Mg2+-actin and cyan for Ca2+-actin) with the solvent molecules in the G-actin structure. The water molecules in the SD3/1 cavity of ATP-G-actin are shown as semitransparent spheres. Arrows indicate the direction of water relocation. Finally, the right panel shows the water and amino-acid arrangement in ADP-BeF3 F-actin. Nuc, nucleophilic.
Fig. 3
Fig. 3. Structural insights into ATP hydrolysis and Pi release.
a,b, Isolated amino-acid and water arrangement near the nucleotide in Mg2+-ADP-BeF3 F-actin (a) and Mg2+-ADP-Pi F-actin (b). Regions unimportant for interactions are depicted as smaller sticks. Amino acids and the proposed nucleophilic water (Wnuc) and assisting water (Wbridge) are annotated. c,d, Internal solvent cavities near the Pi binding site in ADP-Pi (c) and ADP (d) structures of Mg2+-F-actin. The upper panel shows the F-actin structure as surface with the bound Pi and water molecules. In the lower panel, F-actin is shown in cartoon representation and the amino acids forming the internal cavity are annotated and shown as sticks. Hydrogen bonds are depicted as dashed lines. The position of the proposed back door is highlighted in purple in the upper panel. All distances are shown in angstroms.
Fig. 4
Fig. 4. Structural coupling of the nucleotide-binding site to the filament surface.
Top: differences in the SD1 of F-actin in the Mg2+-ADP-BeF3 and Mg2+-ADP-Pi structures. Residues thought to be important for the movement are annotated. Bottom: zoom of the nucleotide-binding site (1) and C-terminal region (2) of the SD1. Arrows depict the direction of the putative movement from the Mg2+-ADP-BeF3 to the Mg-ADP-Pi structure. All distances are shown in angstroms. Distances shown in the Mg2+-ADP-BeF3 structure are blue, whereas those in the Mg-ADP-Pi structure are orange.
Extended Data Fig. 1
Extended Data Fig. 1. Cryo-EM image processing workflow.
The image processing workflow that was used for all collected datasets is shown, with the Ca2+-ADP-BeF3 F-actin dataset as example. All maps are shown in the same orientation. The white scale bar shown on the micrograph is 400 Å. The box size of the 2D-class averages is 384x384 pixels (267x267 Å).
Extended Data Fig. 2
Extended Data Fig. 2. Image processing of all cryo-EM datasets.
a Micrograph depicting actin filaments in the Mg2+-ADP-BeF3 (−2.1 μm), Mg2+-ADP-Pi (−2.4 μm), Mg2+-ADP (−1.3 μm), Ca2+-ADP-BeF3 (−1.4 μm), Ca2+-ADP-Pi (−2.0 μm) and Ca2+-ADP (−1.0 μm) states distributed in vitreous ice (defocus values between brackets). The shown micrographs are example images from full datasets consisting of the following number of analysed micrographs (dataset between brackets): 10822 (Mg2+-ADP-BeF3), 9658 (Mg2+-ADP-Pi), 9842 (Mg2+-ADP), 10705 (Ca2+-ADP-BeF3), 10156 (Ca2+-ADP-Pi), 10733 (Ca2+-ADP). The white scale bar shown on each micrograph is 400 Å. b Fourier-shell correlation plots for each F-actin structure of gold-standard refined masked (black), unmasked (blue) and high-resolution phase randomized (red) half-maps. The FSC = 0.143 threshold is depicted as a dashed line. c Angular distribution of the particles used in the final reconstruction, shown along the filament axis. d Local-resolution estimations of the F-actin reconstructions, computed through Relion.
Extended Data Fig. 3
Extended Data Fig. 3. High-resolution cryo-EM structures of F-actin allow for the modelling of water molecules.
a, c, e, g, i, k Local-resolution filtered, sharpened cryo-EM density map of Mg2+-ADP-BeF3 (a), Mg2+-ADP-Pi (c), Mg2+-ADP-F-actin (e), Ca2+-ADP-BeF3 (g), Ca2+-ADP-Pi (i) and Ca2+-ADP-F-actin (k) shown in two orientations. The subunits are labelled based on their location along the filament, ranging from the barbed (A−2) to the pointed (A2) end. The central actin subunit (A0) is coloured blue (a), orange (c), green (e), cyan (g), salmon (i) or pale green (k) the other four subunits are grey. Densities corresponding to water molecules are coloured red. b, d, f, h, j, l Cartoon representation of the of Mg2+-ADP-BeF3 (b), Mg2+-ADP-Pi (d), Mg2+-ADP-F-actin (f), Ca2+-ADP-BeF3 (h), Ca2+-ADP-Pi (j) and Ca2+-ADP-F-actin (l) structures. Waters are shown as spheres to emphasize their location.
Extended Data Fig. 4
Extended Data Fig. 4. Modelling of selected regions and structural similarities between high-resolution F-actin structures.
af Cryo-EM density of residues E214 – A220 with modelled amino acids and water molecules of F-actin in the Mg2+-ADP-BeF3 (a), Mg2+-ADP-Pi (b), Mg2+-ADP (c) Ca2+-ADP-BeF3 (d), Ca2+-ADP-Pi (e), Ca2+-ADP (f) states, shown at two different contour levels. g Superimposition of a single subunit of Mg2+-F-actin in ADP-BeF3 (blue), ADP-Pi (orange) and ADP (green) states. h Superimposition of a single subunit of Ca2+-F-actin in ADP-BeF3 (cyan), ADP-Pi (salmon) and ADP (pale green) states. ik Superimpositions of Mg2+-F-actin and Ca2+-F-actin in the ADP-BeF3 (i), ADP-Pi (j) and ADP (k) states. The colouring is consistent with the descriptions of g and h. For each overlay, the subdomains of actin (SD1 – SD4) are annotated.
Extended Data Fig. 5
Extended Data Fig. 5. Ion coordination at the nucleotide-binding sites and Pi release from Ca2+-F-actin.
a, b Nucleotide conformation and inner-coordination sphere of the cation for Mg2+- (a) and Ca2+-actin (b). The shown G-actin models were selected from high-resolution crystal structures of rabbit G-actin in the following states: Mg2+-ATP (pdb 2v52, 1.45 Å), Mg2+-ADP (pdb 6rsw, 1.95 Å), Ca2+-ATP (pdb 1qz5, 1.45 Å) and Ca2+-ADP (pdb 1j6z, 1.54 Å). All distances are shown in Å. The distances between the cation and the molecules in its coordination sphere were not restrained during model refinement and may therefore deviate from ideal values. In the ADP-BeF3-bound structures, the distance between the oxygen of the β-phosphate (Pβ) of ADP and Be (1.4 Å) is as short as the equivalent distance in ATP (1.5 Å), defining ADP-BeF3 as a mimic of the ATP ground state of F-actin, rather than an ADP-Pi-like state. ce Position of the nucleotide, cation and associated waters with respect to residue Q137 in the Ca2+-ADP-BeF3 (c), Mg2+-ADP-Pi (d) and Ca2+-ADP-Pi (e) states of F-actin. In the Ca2+-ADP-Pi state (panel e), the position of Q137 prevents the binding of one of the Ca2+-coordinating waters (shown in semitransparent magenta), yielding an octahedral inner-coordination sphere of Ca2+ with one missing water, but instead a coordination by Q137. f, g Internal solvent cavities near the Pi binding site in ADP-Pi (f) and ADP (g) structures of Ca2+-F-actin. The upper panel shows the F-actin structure as surface with the bound Pi and water molecules. In the lower panel, F-actin is shown in cartoon representation and the amino acids forming the internal cavity are annotated and shown as sticks. Hydrogen bonds are depicted as dashed line. All distances are shown in Å. The position of the proposed back door is highlighted in purple in the upper panel. In none of the structures, the internal solvent cavity is connected to the exterior milieu.
Extended Data Fig. 6
Extended Data Fig. 6. Rearrangements upon actin flattening and ATP hydrolysis.
a, b Upper panels: Overlay of G- and F-actin structures show the global conformational changes associated with actin flattening for Mg2+- (a) and Ca2+-F-actin (b). Residues Q137 and K336 act as hinges (as calculated by DynDom) and are shown as orange spheres. Lower panels: Internal solvent cavities near the nucleotide-binding site in G- and F-actin. The cavities were calculated by the Castp3 server and are shown as beige, semitransparent surfaces. The nucleotide was not considered in the solvent cavity calculations. c, d Water arrangement in front of the nucleotide in structures of Mg2+-ATP-G-actin (pdb 2v52, left) and Mg2+-ADP-BeF3 F-actin (right) (c), and Ca2+-ATP-G-actin (pdb 1qz5, left) and Ca2+-ADP-BeF3 F-actin (right) (d). The waters that coordinate the nucleotide-associated cation are coloured magenta, whereas the waters important for the hydrolysis mechanism are shown as larger red spheres. e,f front view of the Pγ-mimic BeF3 with densities for the putative Wnuc and Wbridge in structures of Mg2+- (e) and Ca2+-F-actin (f). g Overlay of the amino-acid arrangement in front of ADP-BeF3 in Mg2+- (blue) and Ca2+-F-actin (cyan). The nucleotide arrangement of Ca2+-F-actin is shown to emphasize that Q137 in its Mg2+-F-actin conformation would clash with a water in the inner-coordination sphere of the Ca2+-ion. (h) Mechanism of ATP hydrolysis in Ca2+-F-actin. The isolated amino acid and water arrangement near the nucleotide in Ca2+-ADP-BeF3 F-actin (left) and Ca2+-ADP-Pi F-actin (right) are depicted. Regions unimportant for interactions are depicted as smaller sticks. Amino acids and Wnuc and assisting water Wbridge are annotated. (i) Table depicting the distance and angles of waters in the nucleotide-binding pocket to the Be-atom in structures of Mg2+-ADP-BeF3 and Ca-ADP-BeF3 F-actin. The distances/angles were measured in the central subunit (chain c) of the reconstruction, which displays the highest local resolution. All annotated distances are shown in Å.
Extended Data Fig. 7
Extended Data Fig. 7. Arrangement of the F-actin intrastrand interface.
Merged models of Mg2+-F-actin and Ca2+-F-actin in all nucleotide states. The structures are shown as surface and should be regarded as an infinitely long polymer. For each nucleotide state, a close-up of the observed intrastrand interface is depicted. The open D-loop conformation is likely adopted to a small extent in every F-actin nucleotide state. However, the D-loop is mostly closed in all nucleotide states except the Mg2+-ADP-BeF3 state, where a mixed open/closed conformation is observed.
Extended Data Fig. 8
Extended Data Fig. 8. Conformational differences associated with open and closed D-loop.
a Focused classification strategy for the separation of the D-loop states of the Mg2+-ADP-BeF3 F-actin dataset. The closed D-loop is coloured red, whereas the open D-loop is coloured yellow. b Angular distribution of all particles used in the reconstruction of the Mg2+-ADP-BeF3 structure (top); and of the particles used for the reconstructions of the isolated closed (bottom-left) and open (bottom-right) D-loop. c Superposition of Mg2+-ADP-BeF3 F-actin structures with separated D-loop conformations in the central actin subunit (A0). For both the open (yellow) and closed (red) D-loop states, the A0 and A+2 actin subunits are shown. d, e Close-up of the A0 (d) and A+2 (e) subunits. In panel d, arrows depict the movements in the SD1 and SD3 of the A+2 subunit associated with the change of D-loop conformation from open to closed in the central A0 subunit. The superposition of the Mg2+-ADP-BeF3 structures with the separated open and closed D-loop conformations in the central actin subunit, revealed that the only differences between the two structures, besides the D-loop, are not found in the central subunit, but instead in SD1 (including C terminus) and SD3 of the adjacent actin subunit. Our data therefore suggest that the D-loop conformation in an actin subunit is not affected by changes in the same subunit, but rather by changes in SD1 of its neighbour subunit.
Extended Data Fig. 9
Extended Data Fig. 9. Structural coupling of the nucleotide-binding site to the filament exterior after Pi release.
a, b Overlay of one actin subunit in the Mg2+-ADP-Pi and Mg2+-ADP structures with annotated subdomains, shown in two orientations. The location of the C terminus (C-term) is accentuated with a large arrow. In (b), the surface-contour of other actin subunits within the filament is depicted. c Differences in the SD1 of F-actin in the Mg2+-ADP-Pi and Mg2+-ADP structures. Residues thought to be important for the movement are annotated. d Zoom of the nucleotide-binding site (1.) and C-terminal region (2.) of the SD1. In (c) and (d), arrows depict the direction of the putative movement from the Mg2+-ADP-Pi to the Mg2+-ADP structure. All distances are shown in Å. Distances shown in the Mg2+-ADP-Pi structure are coloured orange, whereas those in the Mg2+-ADP structure are coloured green.
Extended Data Fig. 10
Extended Data Fig. 10. Cofilin-dependent F-actin severing and conformational changes.
a, top: Representative stain-free SDS–PAGE gel images of co-sedimentations of human cofilin-1 at 5, 10 or 20 µM concentrations with 5 µM Ca2+-F-actin or Mg2+-F-actin in ADP-BeF3, ADP-Pi and ADP states. The graph depicts the amount of F-actin severed by cofilin. Values were calculated from 3 independent assays. The proteins used in the assay originated from aliquots from the same batches of purified G-actin and cofilin-1. The data are presented as mean values. Error bars represent the standard deviation and were calculated in parallel from band intensities from the same experiment. Uncropped gel images are available in Supplementary Fig. 1. The data points used to obtain the graph are available as source data. Abbreviations: sup = supernatant, pel = pellet. b Structure of a single subunit of ADP-F-actin (left panel) and cofilin-decorated ADP-F-actin (middle panel). The right panel depicts an overlay between the two structures; cofilin is hidden for clarity. The arrow indicates the SD1 and SD2 rotation in F-actin upon cofilin binding. ci Arrangement of the SD1 and SD3 at the nucleotide-binding sites in Mg2+-ADP-BeF3 (c), Mg2+-ADP-Pi (d), Mg2+-ADP (e), Ca2+-ADP-BeF3 (f), Ca2+-ADP-Pi (g), Ca2+-ADP (h), and cofilin-decorated Mg2+-ADP (i) structures of F-actin. In panel i, the arrow depicts the cofilin—induced SD1 movement. Source data

Comment in

  • Catching actin proteins in action.
    Cossio P, Hocky GM. Cossio P, et al. Nature. 2022 Nov;611(7935):241-243. doi: 10.1038/d41586-022-03343-x. Nature. 2022. PMID: 36289412 No abstract available.

References

    1. Pollard TD, Cooper JA. Actin, a central player in cell shape and movement. Science. 2009;326:1208–1212. - PMC - PubMed
    1. Svitkina T. The actin cytoskeleton and actin-based motility. Cold Spring Harb. Perspect. Biol. 2018;10:a018267. - PMC - PubMed
    1. Pollard TD, Borisy GG. Cellular motility driven by assembly and disassembly of actin filaments review. Cell. 2003;112:453–465. - PubMed
    1. Rould MA, Wan Q, Joel PB, Lowey S, Trybus KM. Crystal structures of expressed non-polymerizable monomeric actin in the ADP and ATP states. J. Biol. Chem. 2006;281:31909–31919. - PubMed
    1. Blanchoin L, Pollard TD. Hydrolysis of ATP by polymerized actin depends on the bound divalent cation but not profilin. Biochemistry. 2002;41:597–602. - PubMed

Publication types

LinkOut - more resources