. 2022 Oct 26;5(1):1133.
doi: 10.1038/s42003-022-04073-6.

An explainable model of host genetic interactions linked to COVID-19 severity

Collaborators, Affiliations

An explainable model of host genetic interactions linked to COVID-19 severity

Anthony Onoja et al. Commun Biol. .

Abstract

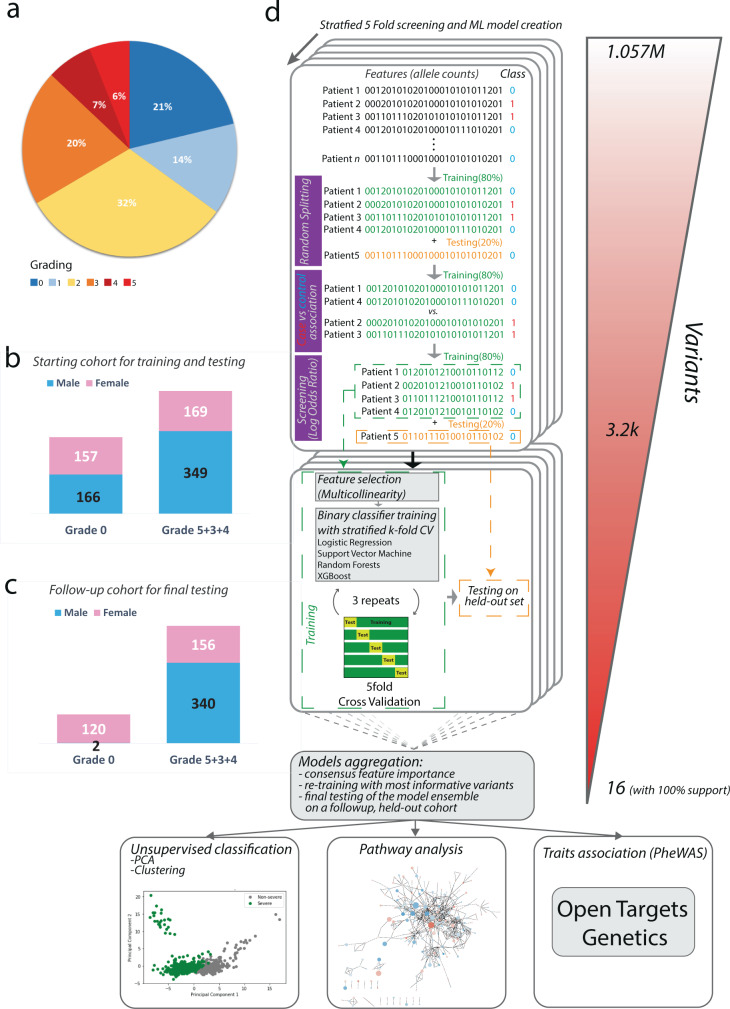
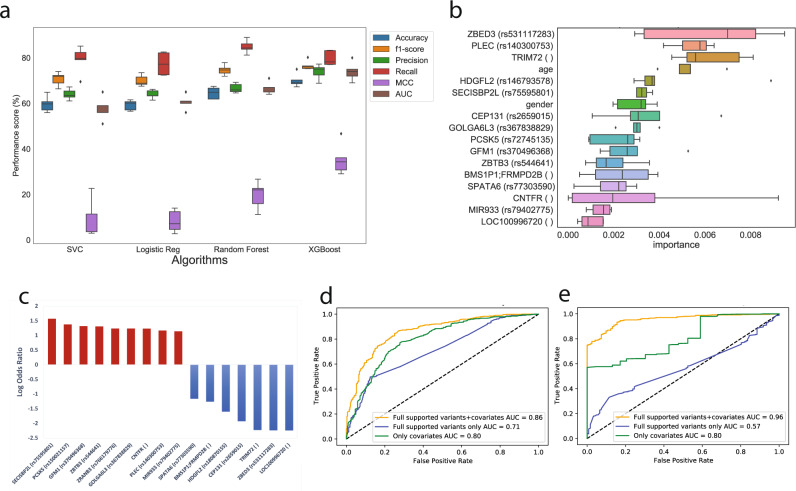
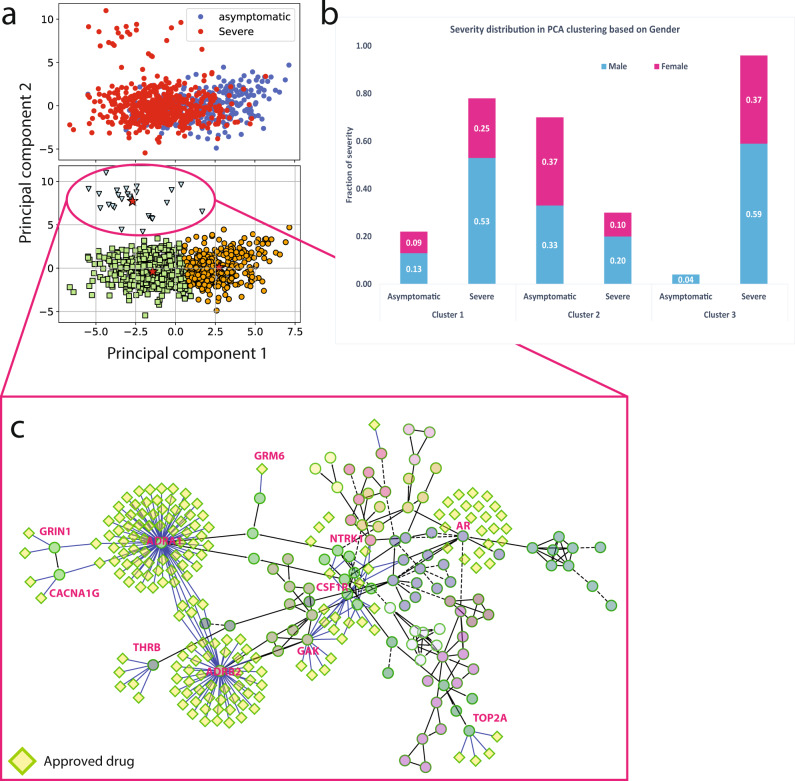
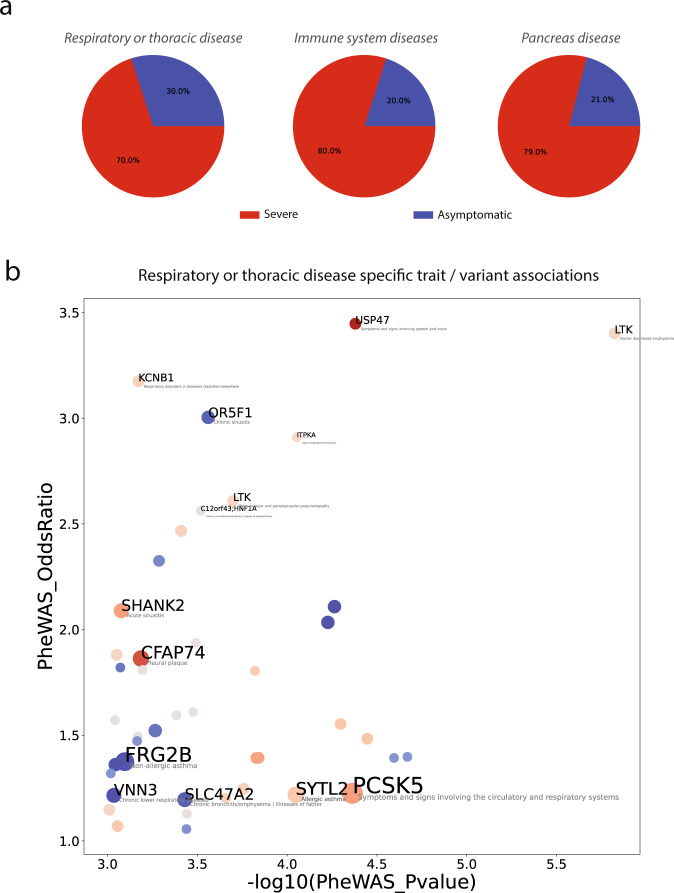
We employed a multifaceted computational strategy to identify the genetic factors contributing to increased risk of severe COVID-19 infection from a Whole Exome Sequencing (WES) dataset of a cohort of 2000 Italian patients. We coupled a stratified k-fold screening, to rank variants more associated with severity, with the training of multiple supervised classifiers, to predict severity based on screened features. Feature importance analysis from tree-based models allowed us to identify 16 variants with the highest support which, together with age and gender covariates, were found to be most predictive of COVID-19 severity. When tested on a follow-up cohort, our ensemble of models predicted severity with high accuracy (ACC = 81.88%; AUCROC = 96%; MCC = 61.55%). Our model recapitulated a vast literature of emerging molecular mechanisms and genetic factors linked to COVID-19 response and extends previous landmark Genome-Wide Association Studies (GWAS). It revealed a network of interplaying genetic signatures converging on established immune system and inflammatory processes linked to viral infection response. It also identified additional processes cross-talking with immune pathways, such as GPCR signaling, which might offer additional opportunities for therapeutic intervention and patient stratification. Publicly available PheWAS datasets revealed that several variants were significantly associated with phenotypic traits such as "Respiratory or thoracic disease", supporting their link with COVID-19 severity outcome.


Conflict of interest statement

The authors declare no competing interests.

Figures

Fig. 1
Fig. 1. Patient cohort and workflow of the computational pipeline.
a piechart with the fraction of sequenced patients for each grading group; b stacked bar-charts with distribution of patients in the two groups (severe=5 + 4 + 3; asymptomatic=0), and their gender composition, whose variants were used for screening, training and initial testing; c stacked bar-charts with distribution of patients in the two groups (severe=5 + 4 + 3; asymptomatic=0), and their gender composition, from a follow-up cohort used for final testing of the model; d workflow of the bottom-up computational strategy to identify and interpret variants linked to COVID-19 severity.
Fig. 2
Fig. 2. Performances of the supervised classifier for prediction of COVID-19 severity.
a Distribution of performance metrics of different algorithms during testing on the five folds. The horizontal line inside each box represents the median value, and the height (whiskers) of each of the boxes depict the standard error (variability) of a particular performance metrics under consideration as scored across the five fold CVs by the employed supervised ML algorithms. The dotted points above and below the individual box-and-whisker lines are potential outliers that are above or below the 25th percentile, and the 75th percentile; b feature importance distribution for features with non-zero importance across the five folds. The characteristics of each box-plot are as in Fig. 2a; c log-odds ratio of the 16 variants with full support in XGBoost trained models; d performances of the predictors with 16 variants plus covariates (age and gender; orange), only co-variates (green), all screened variants plus covariates (blue) in the held-out test set (samples n = 168); e performances of the predictors with 16 variants plus covariates (age and gender; orange), only co-variates (green),all screened variants plus covariates (blue) in a follow-up testing set cohort (new samples n = 618).
Fig. 3
Fig. 3. network analysis and pathway enrichment.
a Pathways overrepresented among variants with non-zero feature in at least one XGB model and enriched in either severe(red) or asymptomatic (blue); b reactome FI network of genes affected by variants with non-zero feature importance from XGBoost. Node diameter is proportional to the number of variants with non-zero coefficients in any tree based models. Node color is instead proportional to the LOR with the highest absolute value among the variants associated to a given gene. The top 3 modules identified within the network are highlighted and corresponding enriched processes displayed as barcharts colored with cluster specific corresponding colors; c FI network zoomed representation of the 2nd largest cluster.
Fig. 4
Fig. 4. detection of distinct clinical groups via PCA and clustering.
a Projection of samples (n = 841) along the 1st and 2nd principal components and coloring based on severity (up) or clusters identified via k-means (bottom); b gender and clinical group composition of the clusters detected via k-means on the 1st and 2nd PCA components; c FI network constructed using mutated genes on the cluster of more severe patients and approved drugs available for any of these genes.
Fig. 5
Fig. 5. PheWAS analysis of most important variants.
a Phenotype categories displaying the greatest fraction of specific trait associations with variants enriched in severe versus asymptomatic patients; b scatter plot showing variant-specific traits associated within the “Respiratory or thoracic disease category”. Dot diameter is proportional to the model support for each variant. The color is proportional to the log-odds ratio of the variant in the two groups of the cohort. Labels are printed only associations with PheWAS P value <0.001 and PheWAS oddsratio >2.5 or for variants having non-zero coefficients in at least one XGBoost model.

References

    1. Marini JJ, Gattinoni L. Management of COVID-19 respiratory distress. JAMA. 2020;323:2329–2330. doi: 10.1001/jama.2020.6825. - DOI - PubMed
    1. Tartof SY, et al. Obesity and mortality among patients diagnosed with COVID-19: Results from an integrated health care organization. Ann. Intern. Med. 2020;173:773–781. doi: 10.7326/M20-3742. - DOI - PMC - PubMed
    1. Zhang, Q. et al. Inborn errors of type I IFN immunity in patients with life-threatening COVID-19. Science370, eabd4570 (2020). - PMC - PubMed
    1. Bastard P, et al. IgG autoantibodies against type I IFNs in patients with severe COVID-19. Sci. (80-.). 2020;4585:1–19.
    1. Van Der Made CI, et al. Presence of genetic variants among young men with severe COVID-19. JAMA. 2020;324:663–673. doi: 10.1001/jama.2020.13719. - DOI - PMC - PubMed

Publication types