. 2022 Nov;23(11):1551-1563.
doi: 10.1038/s41590-022-01327-7. Epub 2022 Oct 26.

Clonal expansion and epigenetic inheritance of long-lasting NK cell memory

Affiliations

Clonal expansion and epigenetic inheritance of long-lasting NK cell memory

Timo Rückert et al. Nat Immunol. 2022 Nov.

Abstract

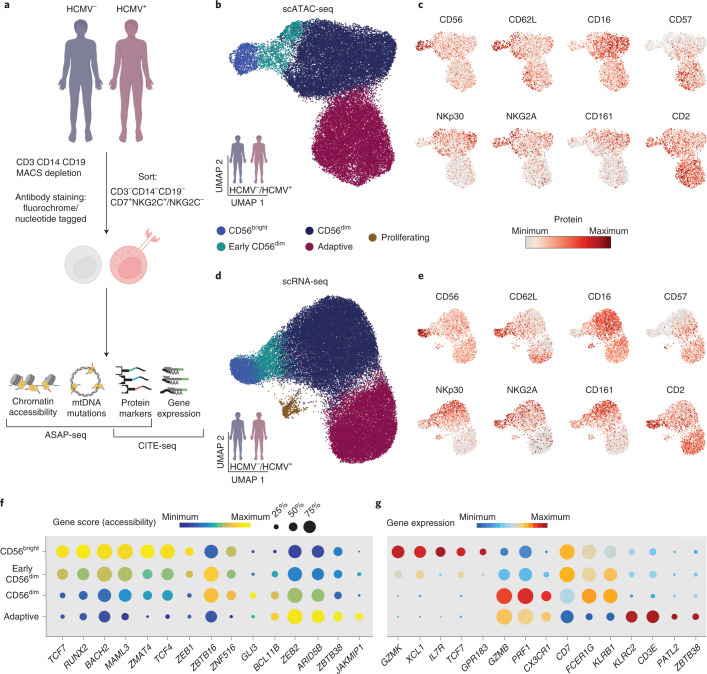
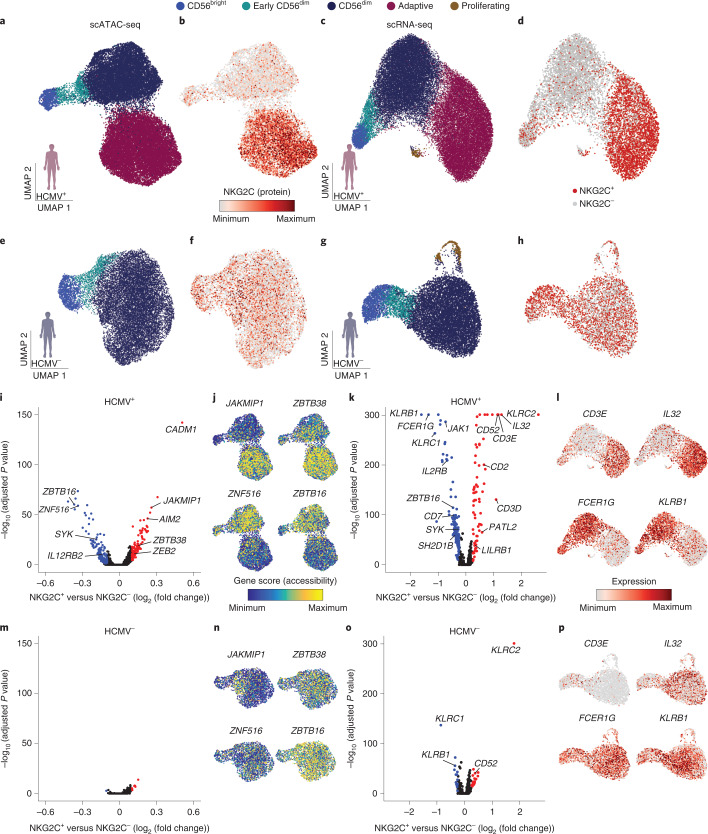
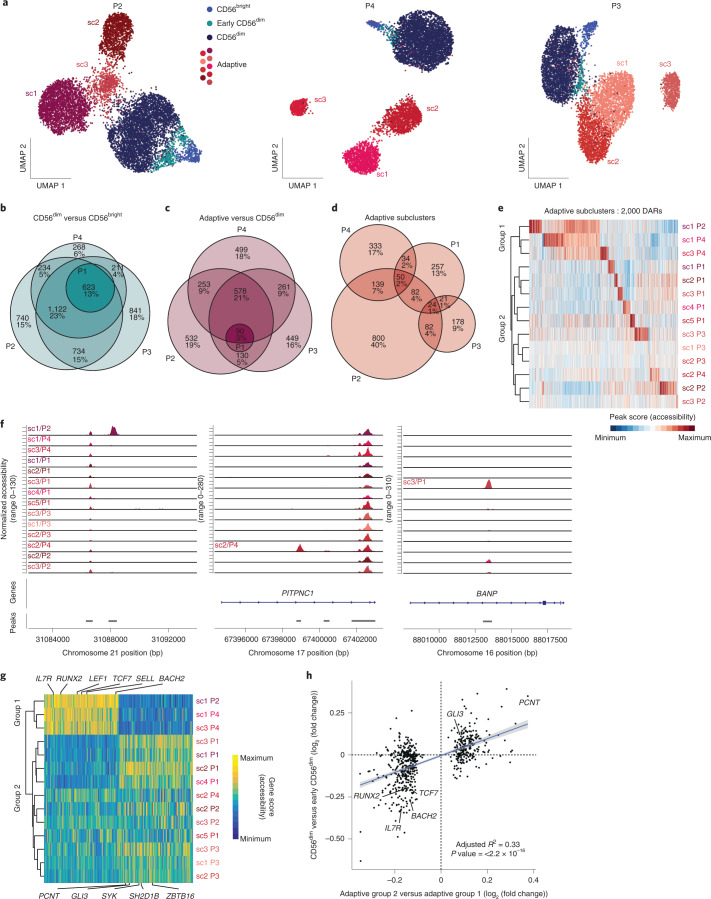
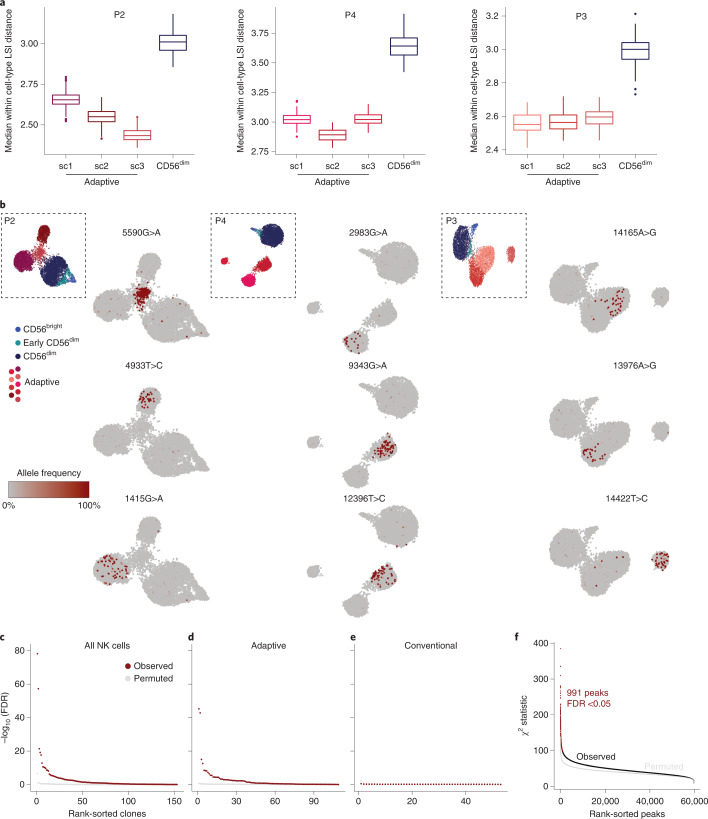
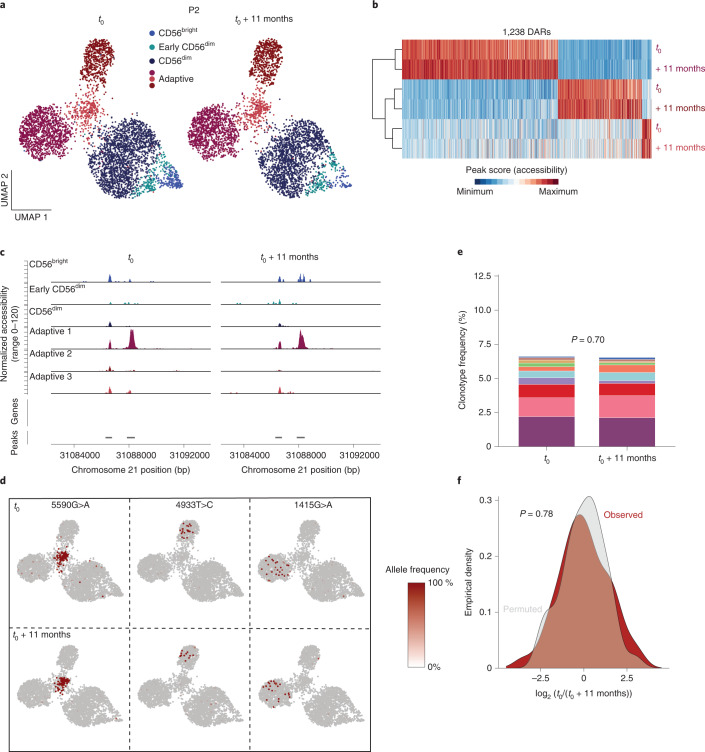
Clonal expansion of cells with somatically diversified receptors and their long-term maintenance as memory cells is a hallmark of adaptive immunity. Here, we studied pathogen-specific adaptation within the innate immune system, tracking natural killer (NK) cell memory to human cytomegalovirus (HCMV) infection. Leveraging single-cell multiomic maps of ex vivo NK cells and somatic mitochondrial DNA mutations as endogenous barcodes, we reveal substantial clonal expansion of adaptive NK cells in HCMV+ individuals. NK cell clonotypes were characterized by a convergent inflammatory memory signature enriched for AP1 motifs superimposed on a private set of clone-specific accessible chromatin regions. NK cell clones were stably maintained in specific epigenetic states over time, revealing that clonal inheritance of chromatin accessibility shapes the epigenetic memory repertoire. Together, we identify clonal expansion and persistence within the human innate immune system, suggesting that these mechanisms have evolved independent of antigen-receptor diversification.


Conflict of interest statement

T.R. and C.R. are listed as inventors on a patent series covering NKG2C-activating peptides. The other authors declare no competing interests.

Figures

Fig. 1
Fig. 1. Mapping NK cell subsets onto transcriptional and epigenetic landscapes.
a, NKG2C+ and NKG2C NK cells were isolated from four to five HCMV+ individuals and two HCMV healthy blood donors, stained with nucleotide barcode-labeled antibodies, mixed at a 1:1 ratio and analyzed by ASAP-seq (n = 6) and CITE-seq (n = 7). b,d, Integrated UMAP embedding of NK cells from donors analyzed by scATAC-seq (b; n = 6) and scRNA-seq (d; n = 7). c,e, Surface protein expression of the indicated markers as measured by ASAP-seq (c) or CITE-seq (e). f,g, Column-scaled accessibility scores (f) and expression (g) per cluster and detection frequencies for the indicated genes. Created with BioRender.com.
Fig. 2
Fig. 2. Distinct signatures of naive and adaptive NKG2C+ NK cells.
a,e, UMAP embedding of NK cells from HCMV+ (a; n = 4) and HCMV (e; n = 4) donors analyzed by scATAC-seq. b,f, NKG2C surface expression as measured by ASAP-seq. c,g, UMAP embedding of NK cells from HCMV+ (c; n = 5) and HCMV (g; n = 2) donors analyzed by scRNA-seq. d,h, Distribution of barcoded NKG2C+ and NKG2C populations. i,m, Differentially accessible genes between NKG2C+ and NKG2C NK cells for HCMV+ (i) and HCMV (m) donors as determined by logistic regression. j,n, Representative accessibility scores of genes defining adaptive NK cells for HCMV+ (j) and HCMV (n) donors. k,o, Differentially expressed genes between NKG2C+ and NKG2C NK cells for HCMV+ (k) and HCMV (o) donors determined by two-sided Wilcoxon rank-sum test with Bonferroni adjustment. l,p, Representative expression of genes defining adaptive NK cells for HCMV+ (l) and HCMV (p) donors. Created with BioRender.com.
Fig. 3
Fig. 3. HCMV infection leaves an inflammatory memory footprint enriched in AP1 motifs.
a, Heat map of differentially active motifs represented as average chromVAR deviation scores per cluster. b, FOS–JUNB motif activity projected on UMAP embedding. c, DARs between adaptive and CD56dim NK cells determined by two-sided Wilcoxon rank-sum test with Bonferroni adjustment. AP1-motif-containing regions are marked in red, and selected regions are annotated by gene proximity. d, Motif enrichment in chromatin regions specifically accessible in adaptive NK cells as determined by one-sided hypergeometric test with Benjamini–Hochberg adjustment. e, De novo motif analysis results on chromatin regions specifically accessible in adaptive NK cells. P values were calculated by comparing enrichment to the cumulative binomial distribution. Created with BioRender.com.
Fig. 4
Fig. 4. Synergistic imprinting by HCMV peptides and proinflammatory cytokines.
a, NK cells from two HCMV individuals were cocultured for 12 h with RMA-S/HLA-E target cells pulsed with the indicated peptides and 10 ng ml–1 IL-15 in the presence (dark shades) or absence (light shades) of IL-12 and IL-18. Different conditions were marked with nucleotide-labeled hashtags and were analyzed by ASAP-seq. b, UMAP embedding, clusters were annotated based on clear enrichment of cells from the indicated conditions. c,d, Surface expression of CD137 (c) and NKG2A (d) per cluster; data were analyzed by two-sided Wilcoxon rank-sum test with a Benjamini–Hochberg adjustment. e, Euler diagram illustrating overlap of DARs between clusters. f, Motif activity of differentially active motifs represented as average chromVAR deviation scores per cluster. gi, DARs between LFL and control (g), IL-12 + IL-18 and control (h) and LFL + IL-12 + IL-18 and control (i) by logistic regression. j,k, Prediction scores for classification as adaptive (j) and CD56dim (k) NK cells based on integration with the ex vivo dataset as reference; data were analyzed by two-sided Wilcoxon rank-sum test with a Benjamini–Hochberg adjustment. Created with BioRender.com.
Fig. 5
Fig. 5. Convergent and divergent epigenetic features of adaptive NK cells.
a, UMAP embedding of NK cells from three HCMV+ individuals analyzed by scATAC-seq; sc, subcluster. bd, Euler diagrams illustrating the overlap of DARs across donors comparing CD56dim and CD56bright (b), adaptive and CD56dim (c) or adaptive subclusters (d). e, Column-scaled accessibility of subcluster-defining DARs and hierarchical clustering of adaptive subclusters for all individuals. f, Accessibility of representative subcluster-specific chromatin regions for each donor; bp, base pairs. g, Top 100 differential column-scaled gene scores for each adaptive subcluster group by Wilcoxon rank-sum test. h, Linear correlation between DARs comparing the two adaptive subcluster groups and CD56dim to early CD56dim NK cells; error bands show 95% confidence interval. The P value was determined by two-sided F-test.
Fig. 6
Fig. 6. Clonal expansion underlies divergent epigenetic signatures of adaptive NK cells.
a, Cluster heterogeneity as assessed by measuring the median distance of 200 randomly sampled cells to their 10 nearest neighbors and repeating this process 100 times. The upper and lower hinges of the box plots correspond to the first and third quartiles, respectively. The upper and lower whiskers extend to the largest/smallest value no further than 1.5× the interquartile range from the hinges. Outliers beyond the whiskers are displayed as individual points. b, Allele frequency of representative somatic mtDNA mutations projected onto UMAP embedding for each HCMV+ donor. ce, Association of clonotypes to clusters defined by chromatin accessibility for all NK cells (c), adaptive NK cells (d) and conventional NK cells (e); false discovery rate (FDR) from χ2 tests for the observed and randomly permuted clonotype–cluster relationships for all donors. f, Association of clonotypes to open chromatin regions as assessed by χ2 test for the observed and randomly permuted clonotype–peak relationships.
Fig. 7
Fig. 7. Adaptive NK cell clonotypes are stably maintained over time.
a, UMAP embedding of NK cells from HCMV+ donor P2 analyzed by scATAC-seq at two different time points. b,c, Stability of overall (b) and representative (c) subcluster-defining DARs over time; data are column scaled. d, Representative clonotype-defining mutations projected onto UMAP embeddings at the two time points. e, Clonotype frequency of adaptive NK cell clonotypes within the total adaptive NK cell compartment over time; data were analyzed by Fisher’s exact test with Monte Carlo simulation. f, Observed and permuted distribution of clonotype log2 (fold change) values between time points; data were analyzed by two-sided Kolmogorov–Smirnov test.
Extended Data Fig. 1
Extended Data Fig. 1. Mapping NK cell subsets onto transcriptional and epigenetic landscapes.
(a) Sorting strategy for one representative HCMV and HCMV+ donor, respectively. (b) Transcription start site (TSS) enrichment plot overlaid for all donors. (c) Expression of proliferation genes MKI67 and STMN1. (d-f) Row-scaled differentially accessible regions (D), genes (E) and differentially expressed genes (F) per cluster. Exemplary cluster-associated genes are listed in the respective colors. (h) Gene accessibility, imputed expression (violins), and their Pearson correlation (indicated as links) for RUNX2 and ZEB2. Created with BioRender.com. Source data
Extended Data Fig. 2
Extended Data Fig. 2. Integration of chromatin accessibility and gene expression.
(a) Pearson correlation between open chromatin regions and gene expression, p-value from one-sided z-test of background-normalized correlation-coefficient as implemented in Signac. (b-e) Chromatin accessibility, imputed expression (violins) and their Pearson correlation (indicated as links) for indicated genes TCF7 (B), RUNX2 (C), ZEB2 (D), KLRC2 and KLRC1 (E).
Extended Data Fig. 3
Extended Data Fig. 3. Distinct signatures dissect NKG2C+ NK cells into naïve and adaptive.
(a + d) UMAP embedding of scATAC-seq (A) and scRNA-seq (D) of NKG2C+ NK cells from HCMV+ individuals. (b + e) Accessibility (B) and expression (E) of key genes regulated in adaptive NK cells. (c + f) Row-scaled accessibility (C) and expression (F) of NK cell subset-specific signatures from fully integrated datasets (Fig. 1) in NKG2C+ NK cell clusters from HCMV+ donors. (g−i) Representative expression (G) and frequencies (H) of FCER1G+ NKp30+ (‘Naive’) and FCER1G- NKp30 (‘Adaptive’) NKG2C+ NK cells and distribution of naïve NKG2C+ NK cells into CD56bright and CD56dim subsets (I) in HCMV (n = 9) and HCMV+ (n = 9) donors. Kruskal-Wallis test with Dunn’s post-hoc test. Created with BioRender.com.
Extended Data Fig. 4
Extended Data Fig. 4. HCMV infection leaves a persistent chromatin footprint enriched for AP1 motifs.
(a) Differentially active motifs between CD56dim and CD56bright NK cells by Wilcoxon rank sum test. (b-c) Motif enrichment in chromatin regions specifically accessible in CD56bright (B) and CD56dim NK cells as determined by hypergeometric test. (d) Differentially active motifs between adaptive and CD56dim NK cells by Wilcoxon rank sum test. (e) Activity of the respective TF motifs projected onto UMAP embedding. (f) Accessibility of IFNG-associated open-chromatin regions containing AP1 or STAT4 and NFκB motifs. (g) Per cluster accessibility of AP1-motif containing chromatin regions in the proximity of CADM1 and AIM2. Created with BioRender.com.
Extended Data Fig. 5
Extended Data Fig. 5. Synergistic imprinting by HCMV peptides and pro-inflammatory cytokines.
(a) Distribution of cells colored by donor origin and quantification per cluster. (b) Distribution of cells colored by culture condition and quantification per cluster, utilized for cluster annotation. (c) Transcription start site (TSS) enrichment plot overlaid for all clusters. (d + e) Representative (D) and mean (E) CD137 expression on NKG2C+ NKG2A NK cells from HCMV donors (n = 9) cultured under the indicated conditions; One-way ANOVA with Holm-Šídák adjustment. (f) JUNB motif activity per cluster; Wilcoxon rank sum test with Benjamini-Hochberg adjustment. (g-h) Representative (G) and quantification (H) of NKG2A expression in naïve and adaptive NKG2C+ NK cells from HCMV (n = 9) and HCMV+ (n = 9) donors; see Extended Data Fig. 2g for gating strategy; Kruskal-Wallis test with Dunn’s post-hoc test. (i) Accessibility of regions near key adaptive NK cell-related genes regulated after stimulation. (j) Linear correlation between differentially accessible regions both induced by in vitro activation and observed ex vivo between adaptive and CD56dim NK cells; error bands show 95 % confidence interval, p-value from two-sided F-test. (k) Motif enrichment in open chromatin regions displayed in (J) as determined by one-sided hypergeometric test with Benjamini-Hochberg adjustment. Created with BioRender.com. Source data
Extended Data Fig. 6
Extended Data Fig. 6. Convergent and divergent epigenetic features of adaptive NK cells.
(a) UMAP embedding of NK cells from HCMV+ individual P1 analyzed by scATAC-seq. (b) Surface expression of the indicated proteins projected on the UMAP embeddings for each donor. Educating KIRs are underlined, see Supplementary Table 2. (c) Column-scaled accessibility of differentially accessible regions (DARs) shared between at least three donors comparing the total adaptive and CD56dim compartments. (d) Accessibility of adaptive NK-cell defining AIM2 region within each donor and adaptive subcluster. (e) FOS::JUNB motif activity within each donor. (f) Accessibility of representative subcluster-specific chromatin regions for each donor.
Extended Data Fig. 7
Extended Data Fig. 7. Adaptive subcluster groups are defined by a maturation gradient.
(a) Linear correlation between DARs comparing the two adaptive subcluster groups and CD56dim to early CD56dim NK cells; error bands show 95 % confidence interval, p-value from two-sided F-test. (b) Accessibility of adaptive group-defining regions within TCF7 and PCNT for each donor and adaptive subcluster. (c) TCF7L2 and CTCF motif activity for each donor and adaptive subcluster; two-sided Wilcoxon test with Bonferroni adjustment. (d) FOS::JUNB motif activity for each donor and adaptive subcluster; two-sided Wilcoxon test with Bonferroni adjustment. (e) Normalized CD62L surface expression per cluster; two-sided Wilcoxon rank sum test with Bonferroni adjustment.
Extended Data Fig. 8
Extended Data Fig. 8. Clonal expansion underlies divergent epigenetic signatures of adaptive NKG2C+ NK cells.
(a) Cluster heterogeneity of donor P1 NK cells as assessed by measuring the median distance of 200 randomly sampled cells to their k nearest neighbors and repeating this process 100 times. (b) The k parameter was varied from 5-30 for donor P4 to assess robustness of this heterogeneity metric. The upper and lower hinges of boxplots correspond to the first and third quartiles, respectively. The upper and lower whiskers extend to the largest/smallest value no further than 1.5 times the interquartile range from the hinges. Outliers beyond whiskers are displayed as individual points. (c) Strand-concordance and variance-to-mean ratio applied for extraction of informative mutations for each donor. (d) Allele frequency of representative somatic mtDNA mutations projected onto UMAP embedding for donor P1.
Extended Data Fig. 9
Extended Data Fig. 9. Adaptive clonotypes are associated to unique epigenetic identities.
(A) Clonotypes defined by clustering on per-cell allele frequency for all high-confidence variants. (b) Allele frequency of representative somatic mtDNA mutation within the conventional compartment of donor P2. (c) Association of clonotypes to clusters defined by chromatin accessibility for all NK cells from HCMV donors (n = 3). (d-e) Representative open chromatin regions specifically associated to individual clonotypes.
Extended Data Fig. 10
Extended Data Fig. 10. Adaptive NK cell clonotypes are stably maintained over time.
(a) UMAP embedding of NK cells from HCMV+ donor P3 and P4 analyzed by scATAC-seq at two different time points. (c-f) Stability of overall (C-D) and representative (E-F) subcluster-defining differentially accessible regions (DARs) over time; column-scaled. (g-h) Representative clonotype-defining mutations projected onto UMAP embeddings at the two time points. (i + k) Clonotype frequency of adaptive NK cell clonotypes within total adaptive NK cell compartment over time; Fisher’s exact test with Monte Carlo simulation. (j + l) Observed and permuted distribution of clonotype log2 fold-changes between time points; two-sided Kolmogorov-Smirnov test.

Comment in

References

    1. Pradeu T, Du Pasquier L. Immunological memory: what’s in a name? Immunol. Rev. 2018;283:7–20. - PubMed
    1. Netea MG, et al. Defining trained immunity and its role in health and disease. Nat. Rev. Immunol. 2020;20:375–388. - PMC - PubMed
    1. Kaufmann E, et al. BCG educates hematopoietic stem cells to generate protective innate immunity against tuberculosis. Cell. 2018;172:176–190. - PubMed
    1. Larsen SB, et al. Establishment, maintenance, and recall of inflammatory memory. Cell Stem Cell. 2021;28:1758–1774.e8. - PMC - PubMed
    1. Kleinnijenhuis J, et al. Bacille Calmette–Guerin induces NOD2-dependent nonspecific protection from reinfection via epigenetic reprogramming of monocytes. Proc. Natl Acad. Sci. USA. 2012;109:17537–17542. - PMC - PubMed

Publication types