. 2022 Nov;23(11):1614-1627.
doi: 10.1038/s41590-022-01337-5. Epub 2022 Oct 26.

Divergent clonal differentiation trajectories of T cell exhaustion

Affiliations

Divergent clonal differentiation trajectories of T cell exhaustion

Bence Daniel et al. Nat Immunol. 2022 Nov.

Abstract

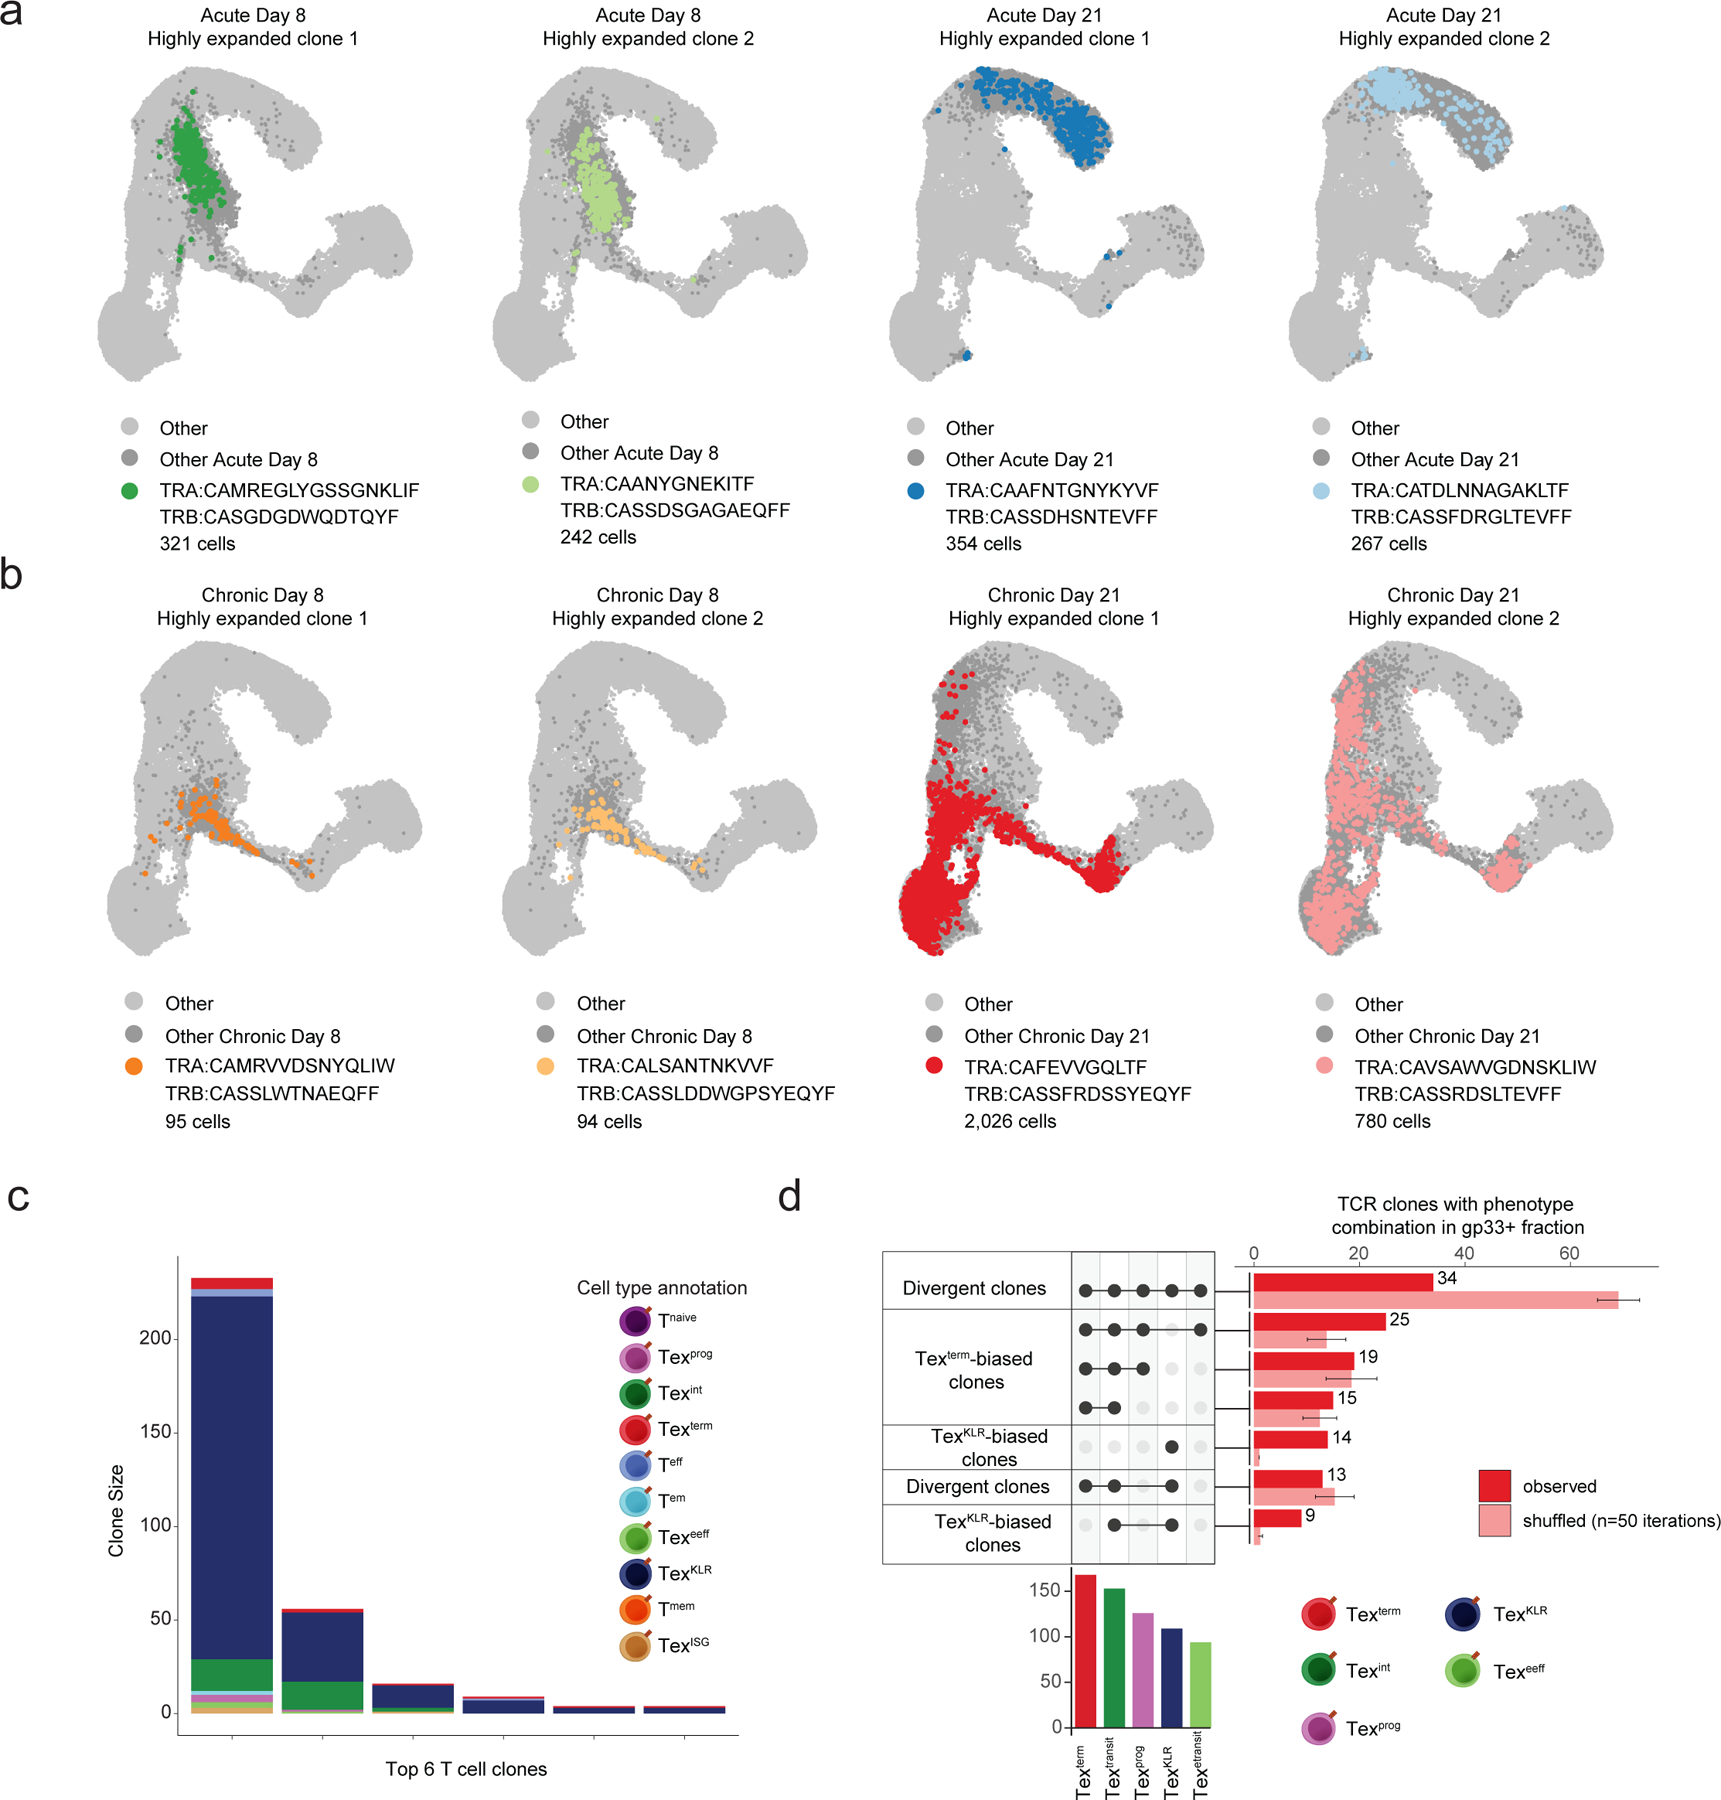
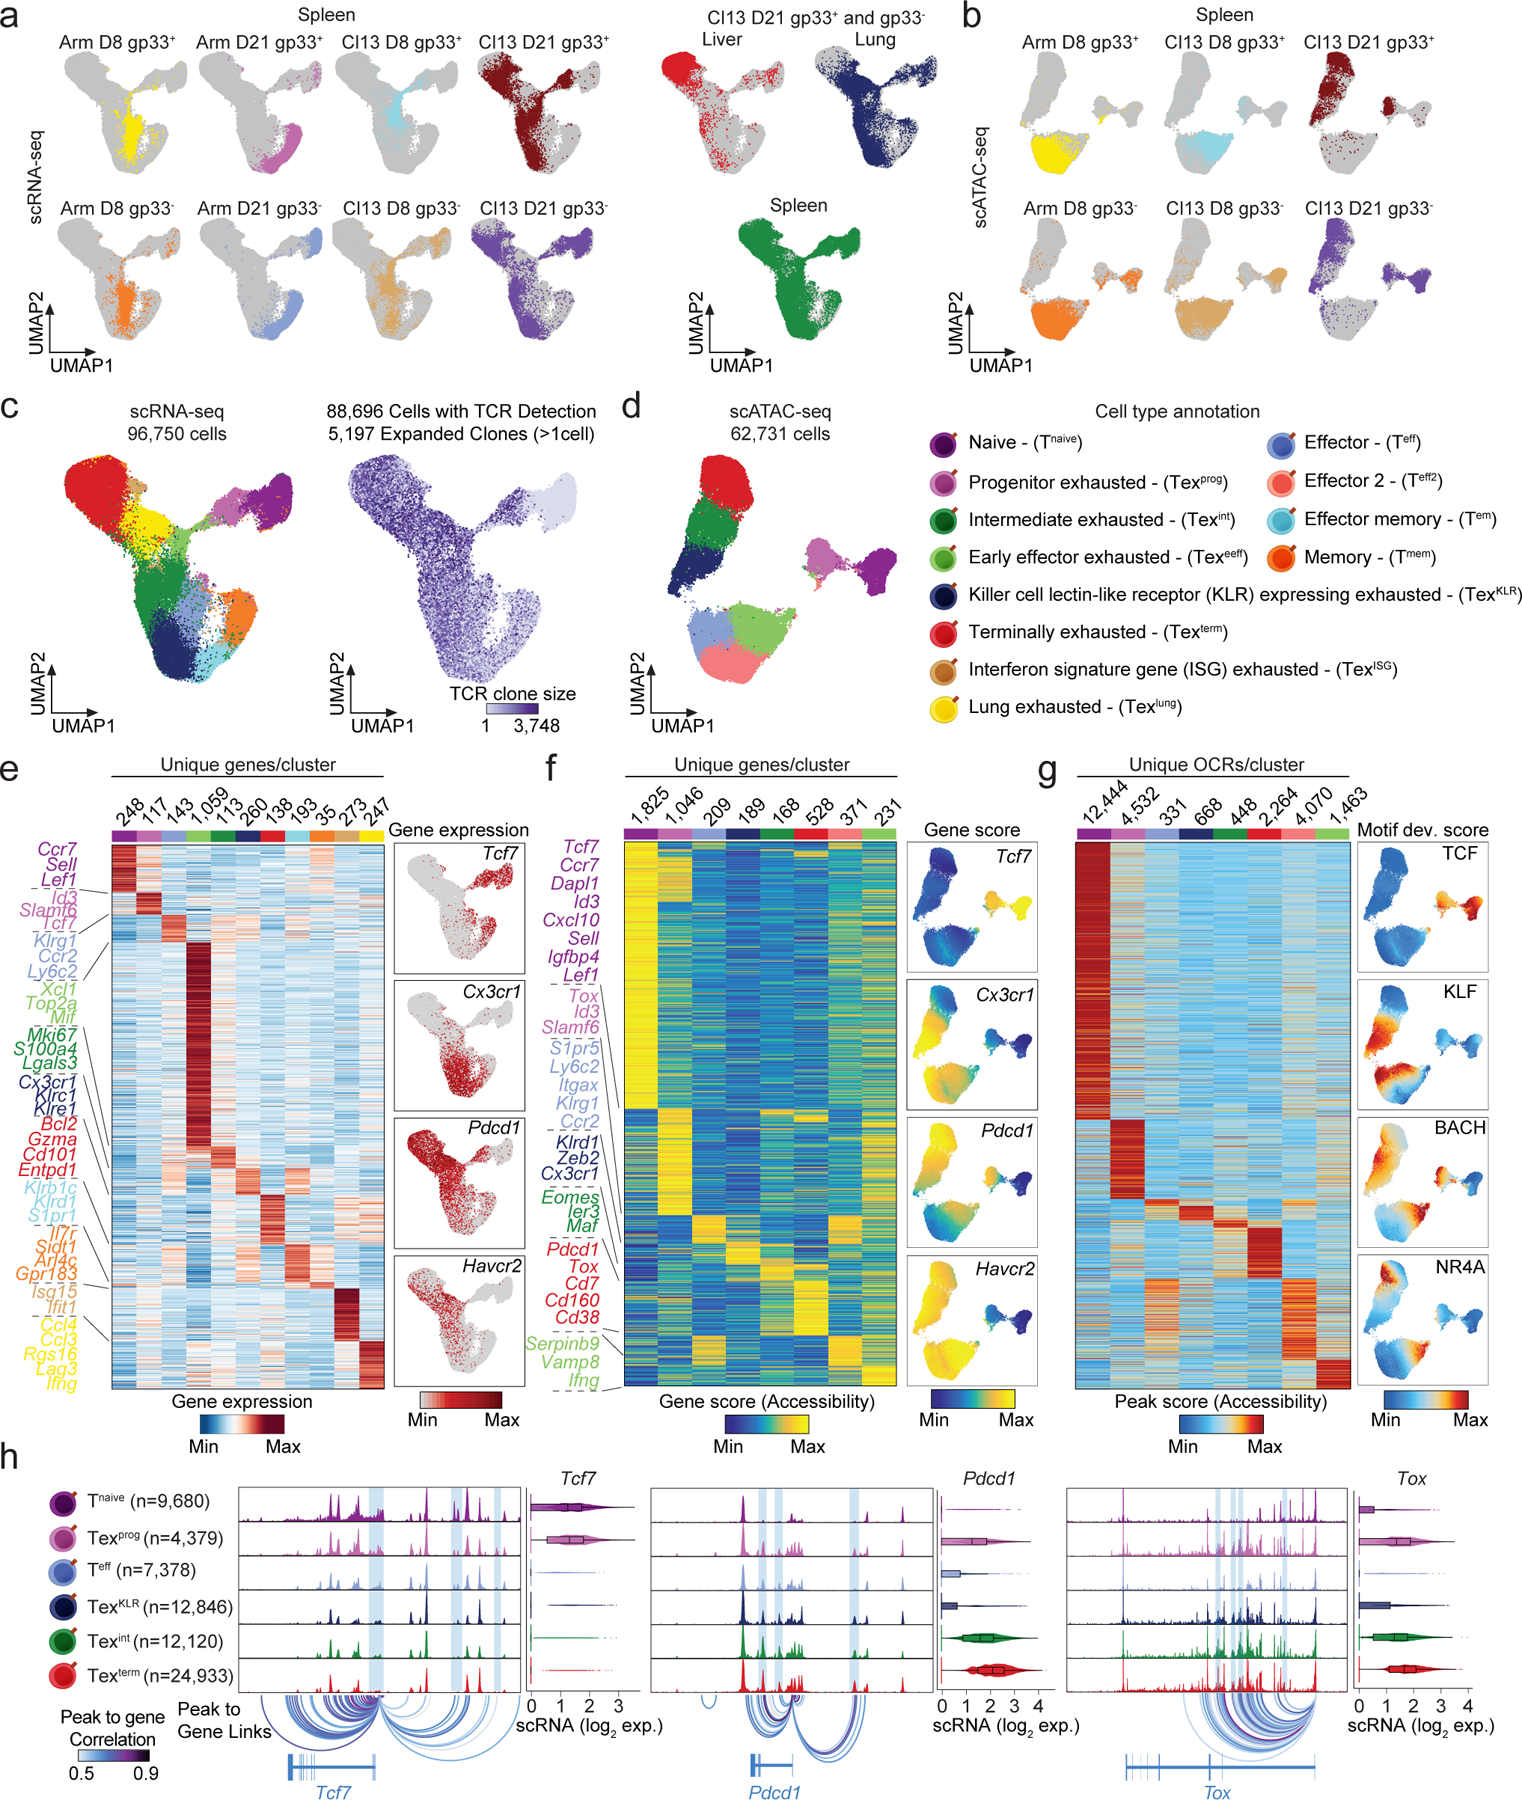
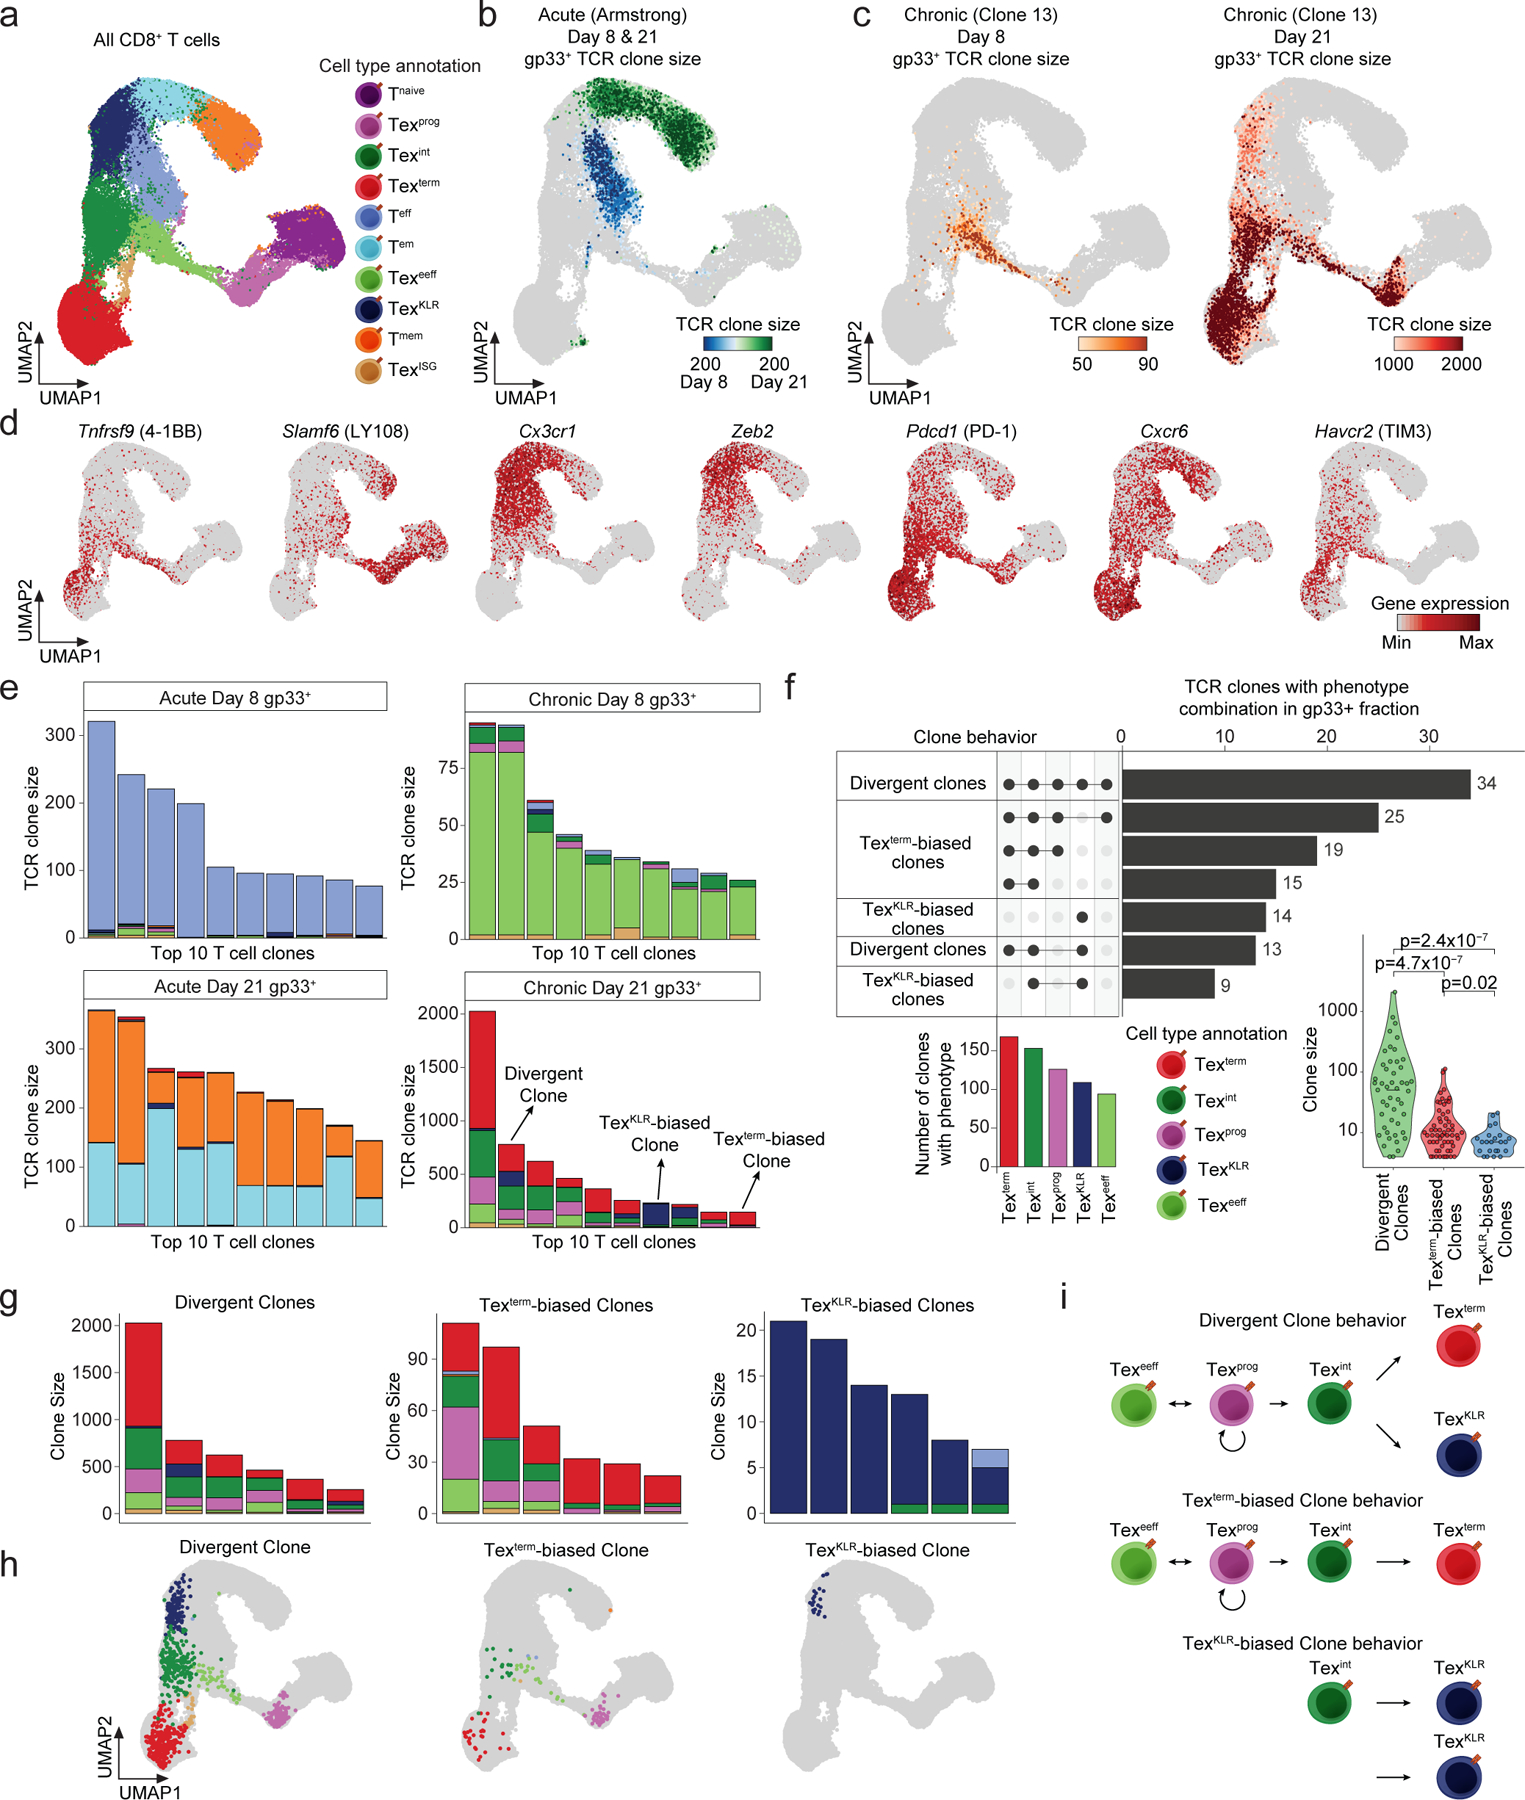
Chronic antigen exposure during viral infection or cancer promotes an exhausted T cell (Tex) state with reduced effector function. However, whether all antigen-specific T cell clones follow the same Tex differentiation trajectory remains unclear. Here, we generate a single-cell multiomic atlas of T cell exhaustion in murine chronic viral infection that redefines Tex phenotypic diversity, including two late-stage Tex subsets with either a terminal exhaustion (Texterm) or a killer cell lectin-like receptor-expressing cytotoxic (TexKLR) phenotype. We use paired single-cell RNA and T cell receptor sequencing to uncover clonal differentiation trajectories of Texterm-biased, TexKLR-biased or divergent clones that acquire both phenotypes. We show that high T cell receptor signaling avidity correlates with Texterm, whereas low avidity correlates with effector-like TexKLR fate. Finally, we identify similar clonal differentiation trajectories in human tumor-infiltrating lymphocytes. These findings reveal clonal heterogeneity in the T cell response to chronic antigen that influences Tex fates and persistence.


Figures

Extended Data Figure 1.
Extended Data Figure 1.. Sorting strategy and quality controls for scATAC-seq data.
(a) Sorting strategy to obtain antigen specific gp33+ and gp33 CD8+ T cells from different organs. (b) Sorting strategy to obtain the main Tex subsets (left). UMAPs of scRNA-seq and scATAC-seq results, originating from the indicated Tex subsets. (c) Bar plot of cell counts from the scRNA-seq samples (top). Stacked bar plot of the phenotypic composition of the indicated scRNA-seq samples (bottom). (d) Quality control of scATAC-seq data. Histogram shows normalized read enrichment on the transcription start sites (TSS) of genes from the indicated samples (top). Density plots depict the cells that passed the TSS enrichment and Log10 unique fragment count threshold. Median TSS enrichment (MTE) is also indicated. (e) Density plots of scATAC-seq data from the main Tex populations depicting the same quality controls as panel (c). (f) UMAP of scATAC-seq data colored by integrated scRNA-seq cluster labels. (g) Heat map of TF motif enrichment at the specific open chromatin regions (OCRs) of the annotated T cell populations (p-values determined by hypergeometric enrichment and adjusted using the Bonferroni correction method).
Extended Data Figure 2.
Extended Data Figure 2.. Characterization of Texint and TexKLR subsets and organ-specific exhaustion signatures.
(a) Ingenuity pathway analyses of the differentially expressed genes identifying enriched biological pathways between the two subsets (Texint versus TexKLR). Top 6 hits are shown. (b) Representative flow cytometry plots that quantify CXCR6 expression in Texterm, Texint and Texprog. Barplots summarize the quantification across three biological replicates. Significant changes were determined by two tailed, unpaired t-test at p<0.05 (n=3). Shown are means with SDs. (c) Representative flow cytometry plots show the MKI67+ fractions of the indicated Tex subsets. Boxplot depicts the quantification of MKI67+ Tex subsets. Significant changes were determined by two tailed, unpaired t-test at p<0.05 (n=5 biologically independent animals). Box center line, mean; limits, upper and lower quartiles; whiskers, minimum and maximum values. (d) Volcano plots of differentially expressed genes comparing Texterm populations from different organs (log2 FC > 0.25, Bonferroni adjusted p-value < 0.01, p-values determined by two-sided Wilcoxon Rank Sum test). Ingenuity pathway analysis results on the differentially expressed gene groups (bottom). Top 3 hits are shown. (e) Violin plots of the Cell Cycle score of the indicated T cell populations across organs (n = number of scRNA-seq profiles, box center line, median; box limits, upper and lower quartiles; box whiskers, 1.5× interquartile range). P-values determined by two-sided Wilcoxon Rank Sum test relative to overall distribution of single cells from the indicated Tex subsets across all organs. (f) Representative flow cytometry of the MKI67+ fraction of Texterm subsets in the indicated organs. Bar plot summarizes MKI67+ fractions across organs. Significant changes were determined by two tailed, unpaired t-test at p<0.05 (n=3 biologically independent animals). Shown are means with SDs.
Extended Data Figure 3.
Extended Data Figure 3.. Analysis of highly-expanded T cell clones in Arm and Cl13 infection.
(a) UMAPs of highly expanded clones from the Arm infection model at the indicated time points. (b) UMAPs of highly expanded clones of the Cl13 infection model at the indicated time points. (c) Stacked bar plot of the phenotypic composition of individual T cell clones with a bias towards the TexKLR fate that also contain some cells with the Texterm phenotype. Top 6 clones are shown. (d) Upset plot of the phenotype combinations of the observed and shuffled TCR clones. Bar represents the mean and error bars represent standard deviation for 50 randomized TCR shuffling iterations performed to obtain the shuffled distribution.
Extended Data Figure 4.
Extended Data Figure 4.. RNA velocity analysis of a divergent clone and regulatory programs of exhaustion.
(a) Heat maps depict the gene expression program of a gp33-reactive divergent clone, differentiating from the Texint stage into either Texterm or TexKLR fates (left). Pseudotime order (direction of differentiation) was determined by RNA velocity analysis and is presented on a UMAP (right). (b) UMAPs of gp33+ CD8+ T cells from Arm infection at D8 and D21 and gp33 at D21. Color gradient (RNA velocity pseudotime order) indicates directions of T cell differentiation fates determined by RNA velocity analysis. (c) UMAP of scATAC-seq results of D8 and D21 gp33+ and gp33 T cells from Cl13 infection. UMAP is colored by the annotated T cell subsets. Small UMAPs (right) show T cells that originate from the indicated gp33 fractions and timepoints. (d) Heat map of Peak score values at the unique open chromatin regions (OCRs) of the T cell subsets determined by scATAC-seq with a list of annotated putative target genes based on proximity (left, log2 FC > 1, FDR < 0.05, p-values determined by two-sided Wilcoxon Rank Sum test and adjusted using the Benjamini & Hochberg procedure to obtain FDRs). Heat map of motif enrichment results at the unique OCR sets of the annotated T cell subsets (right, p-values determined by hypergeometric enrichment and adjusted using the Bonferroni correction method). (e) Upset plot of differentially accessible OCRs relative to Tnaive at the Tox gene locus and their overlap among the different Tex subsets (log2 FC > 1, FDR < 0.01, p-values determined by two-sided Wilcoxon Rank Sum test and adjusted using the Benjamini & Hochberg procedure to obtain FDRs). Violin plot shows the gene expression level of Tox in the identified Tex subsets. Box center line, median; box limits, upper and lower quartiles; box whiskers, 1.5× interquartile range.
Extended Data Figure 5.
Extended Data Figure 5.. Molecular programs of early effector- and progenitor-exhausted T cells and fate mapping experiments.
(a) UMAPs of scATAC-seq (left) and scRNA-seq (right) results from the infection models. Small UMAPs are colored by sample of origin (bottom). (b) Stacked bar plot depicts the phenotypic distribution of gp33+ CD8 T cells from scRNA-seq. (c) Volcano plot of differentially expressed genes (DEGs) between memory precursor T cells (Tmp) from Arm and the precursor exhausted T cells (Texprec) from Cl13 infections (top left). Differential gene expression analyses were performed as follows: log2 FC > 0.25, Bonferroni adjusted p-value < 0.01, p-values determined by two-sided Wilcoxon Rank Sum test.. Ingenuity pathway analyses of the Tmp and Texprog specific gene sets. Volcano plot of the differential open chromatin regions (OCRs) of the Tmp and Texprec populations (top right). Differential OCR analyses were performed as follows: log2 FC > 1, FDR < 0.1, p-values determined by two-sided Wilcoxon Rank Sum test and adjusted using the Benjamini & Hochberg procedure to obtain FDRs. Enriched transcription factor (TF) motifs in specific OCRs of Tmp and Texprog subsets are shown (p-values determined by hypergeometric enrichment and adjusted using the Bonferroni correction method). (d) DEGs between the D8 effector T cells (Teff) from Arm and early effector Tex cells (Texeeff) from Cl13 infections (top left). Same statistical approach was used as in (c). Ingenuity pathway analyses of the Teff and Texeeff specific gene sets (bottom left). Volcano plot depicts the differentially accessible OCRs of Teff and Texeeff populations (right). Same statistical approach was used as in (c). Enriched TF motifs in Teff and Texeeff specific OCR sets (p-values determined by hypergeometric enrichment and adjusted using the Bonferroni correction method). (e) Expression of the indicated genes profiled by scRNA-seq. Box center line, mean; limits, upper and lower quartiles; whiskers, minimum and maximum values. (f) Schematic of the Texeeff adoptive transfer experiment with pre-transfer sorting strategy (top). Representative flow cytometry plots show the analysis of the phenotypic content of recovered T cells. Stacked bar plots show the phenotypic distribution from 3 biologically independent animals (mean % of each subset is shown with SDs). (g) Heat map of differentially expressed TFs in Tex subsets. (h) Upset plot of differentially accessible OCRs of TexKLR and Texterm relative to Texint (log2 FC > 1, FDR < 0.01, p-values determined by two-sided Wilcoxon Rank Sum test and adjusted using the Benjamini & Hochberg procedure to obtain FDRs) and their overlap. (i) Schematic of lineage tracing experiment (left). Gating strategy to analyze tdTomato+ fractions of Tex subsets. Boxplot of the % of tdTomato+ Tex subsets are shown. Box center line, mean; limits, upper and lower quartiles; whiskers, minimum and maximum values (n = 4 biologically independent animals).
Extended Data Figure 6.
Extended Data Figure 6.. scRNA/TCR-seq reveals T cell clone behaviors in different organs.
(a) Heat map of the fraction overlap between the TCR repertoires of the indicated gp33+ and gp33 CD8+ T cell subsets from different organs. (b) Stacked bar plot of the phenotypic composition of individual clones with divergent behavior across organs. (c) Schematic of the definition of an expanded, organ-shared T cell clone for clone behavior analysis. Only clones that had at least 5 T cells present in each organ were considered. Shared clone numbers across the organs are indicated (left). Table depicting the number of expanded clones that are shared across tissues and their clone behaviors (right). (d) Gene expression analysis of LCMV-gp transcript (left) and Il21 transcript (right) in indicated organs at D22 following Cl13 infection. Significant changes were determined by two tailed, unpaired t-test (n=10 biologically independent animals). Box center line, mean; limits, upper and lower quartiles; whiskers, minimum and maximum values.
Extended Data Figure 7.
Extended Data Figure 7.. scRNA-seq reveals the phenotypic composition of gp33, gp33int, and gp33high T cell subsets.
(a) UMAPs of cell profiled by scRNA-seq in the three gp33 T cell fractions colored by the annotated T cell subsets. (b) Venn diagram shows the overlap of all detected TCR clones among the three gp33 T cell fractions. (c) Heat map depicting TCR repertoire overlap (Morisita index) among the different gp33 fractions from the indicated samples. (d) Pie chart representation of the fraction of the detected clone sizes in the three gp33 T cell fractions. (e) Stacked bar plot of the phenotypic distribution of the unique clones from the three gp33 T cell fractions. (f) UMAPs of unique TCR clones determined by scRNA/TCR-seq and colored by the phenotypic distribution of the three gp33 fractions of T cells. (g) Representative flow cytometry plots depict the gating strategy to analyze the fractions of Tex subsets in gp33, gp33int, and gp33high CD8+ T cells. Bar plots quantify the frequencies of the indicated Tex subsets in each gp33 fraction. Significant changes were determined by two tailed, unpaired t-test at p<0.05 (n=3 biologically independent animals). Shown are means with SDs. (h) Representative flow cytometry plots depict the gating strategy to analyze the functionality (IFNG/LAMP1 double positive CD8+ T cells) of gp33, gp33int, and gp33high CD8+ T cells. Boxplot quantifies the double positive fractions of T cells in each gp33 fraction. Significant changes were determined by two tailed, unpaired t-test at p<0.05 (n=7 biologically independent animals). Box center line, mean; limits, upper and lower quartiles; whiskers, minimum and maximum values. (i) Stacked bar plots show the phenotypic content of TCR clones that were tested for TCR signaling avidity. CDR3 amino acid sequences are indicated.
Extended Data Figure 8.
Extended Data Figure 8.. Human expanded TILs exhibit divergent, Texterm- and TexKLR-biased clone behaviors.
(a) Upset plot depicting the combination of phenotypes (clone behaviors) for expanded TIL clones. For clarity, the top 10 most common clone behaviors are shown. Bar plot shows the number of clones with the indicated phenotypes. (b) UMAPs of representative expanded TIL clones with the indicated clone behaviors.
Figure 1.
Figure 1.. Single-cell genomic atlas of T cell exhaustion during LCMV infection.
(a) scRNA-seq UMAPs colored by sample. (b) scATAC-seq UMAPs colored by sample. (c) scRNA-seq UMAP colored by annotated T cell subsets (left) or T cell clone size assigned by scTCR-seq (right). (d) scATAC-seq UMAP colored by annotated T cell subsets. (e) Heat map of subset specific marker genes determined by scRNA-seq (left, log2 FC >0.25, Bonferroni adjusted p-value <0.01, two-sided Wilcoxon Rank Sum test). Feature plots of T cell subset specific gene markers (right). (f) Heat map of Gene score values (weighted accessibility at gene locus) determined by scATAC-seq (left, log2 FC >0.5, FDR <0.01, two-sided Wilcoxon Rank Sum test adjusted using Benjamini & Hochberg procedure). Feature plots of T cell subset specific Gene score values (right). (g) Heat map of Peak score values at unique open chromatin regions (OCRs) of T cell subsets determined by scATAC-seq (left, log2 FC >1, FDR <0.05, two-sided Wilcoxon Rank Sum test adjusted using Benjamini & Hochberg procedure). Feature plots of chromVAR deviation scores for T cell subset specific motifs (right). (h) Genome accessibility tracks of indicated gene loci in Tex subsets. Violin plots of gene expression determined by scRNA-seq (n = number of scRNA-seq profiles; box center line, median; limits, upper and lower quartiles; whiskers, 1.5× interquartile range).
Figure 2.
Figure 2.. Identification of intermediate, KLR-expressing, and organ-specific Tex subsets.
(a) scRNA-seq UMAP colored by T cell subset from sorted PD-1+CX3CR1+CD8+ T cells (left). Stacked bar plot of the sorted population phenotypic distribution (right) (b) Volcano plots of differentially expressed genes between indicated Tex populations (log2 FC >0.25, Bonferroni adjusted p-value <0.01, two-sided Wilcoxon Rank Sum test). (c) Heat map of scaled marker gene expression of terminal effector memory (T-Tem) cells (Milner et al. 2020) in indicated T cell subsets. (d) Violin plot of T-Tem gene signature score in indicated T cell subsets (n = number of scRNA-seq profiles, box center line, median; limits, upper and lower quartiles; whiskers, 1.5× interquartile range). (e) Representative IFNG/LAMP-1 flow cytometry plots of indicated Tex subsets (left). Boxplot quantifying IFNG+LAMP1+ percentage for indicated Tex subsets. Significance determined by two tailed, unpaired t-test (n = 5 biologically independent animals). Box center line, mean; limits, upper and lower quartiles; whiskers, minimum and maximum values. (f) scRNA-seq UMAP from three organs at D21 following Cl13 infection colored by annotated T cell subsets (g) Stacked bar plot of gp33+ phenotypic distribution of annotated T cell subsets in three organs (left). UMAPs colored by organ (right). (h) Heat map of scaled gene expression values of common exhaustion gene signature among Texterm from three organs. (i) Violin plot of Texterm exhaustion scores from the three organs (Im et al. 2016; n = number of scRNA-seq profiles; box center line, median; limits, upper and lower quartiles; whiskers, 1.5× interquartile range). P-values determined by two-sided Wilcoxon Rank Sum test. (j) Representative flow cytometry plots of Tex subsets detected in organs. (k) Quantification of the PD-1+ and PD-1 fractions of CD8+ T cells across organs. Significance determined by two tailed, unpaired t-test (n = 3 biologically independent animals). Shown are means with SDs. (l) Quantification of fractions of indicated Tex subsets across organs. Significance determined by two tailed, unpaired t-test (n = 3 biologically independent animals). Shown are means with SDs.
Figure 3.
Figure 3.. TCR-based lineage tracing reveals divergent Tex clonal trajectories.
(a) UMAP of scRNA-seq results from the gp33+ and gp33 T cell fractions in the spleen at D8 and D21 of Arm and Cl13 infection. UMAP is colored by the annotated T cell subsets. (b) UMAP of scRNA-seq results of gp33+ T cells colored by the size of the detected TCR clones at D8 and D21 in the Arm infection model. (c) UMAP of scRNA-seq results of gp33+ T cells colored by the size of the detected TCR clones at D8 in the Cl13 infection model (left). Same UMAP of gp33+ T cells colored by the TCR clone size at the D21 time point in the Cl13 infection model (right). (d) UMAPs colored by the expression of the indicated gene transcripts by scRNA-seq. (e) Stacked bar plot of the phenotypic distribution of the top 10 expanded clones in the gp33+ fraction at D8 and D21 of Arm infection (left) and Cl13 infection (right). (f) Upset plot depicting the number of expanded clones with specific phenotype combinations (clone behaviors). For clarity the top 7 most common clone behaviors are shown. Barplot of the number of clones with the indicated phenotypes (bottom left). Violin plot of the clone size distribution of the detected clone behaviors (bottom right,p-values determined by two-sided Wilcoxon Rank Sum test). (g) Stacked bar plots show the top 6 expanded clones with the indicated clone behaviors. (h) UMAPs show representative examples of T cell clones with the detected clone behaviors. (i) Schematic of the phenotypic composition and the potential differentiation trajectories of the identified clone behaviors.
Figure 4.
Figure 4.. Texint represent a bifurcation point of exhausted T cell fate differentiation.
(a) UMAPs of scRNA-seq results of D8 and D21 gp33+ T cells from the Cl13 infection model. UMAP is colored by the annotated T cell subsets and arrows represent Tex differentiation fate directions predicted by RNA velocity analysis. (b) UMAPs of individual Tex clones with the indicated clone behavior. Color gradient (RNA velocity pseudotime order) indicates directions of Tex differentiation fates determined by RNA velocity analysis. (c) Scatter plots of the expression level and spliced:unspliced ratio of the indicated gene transcripts in T cells of a divergent clone over pseudotime as determined by RNA velocity analysis. Expression of spliced and unspliced transcripts is derived from mean expression (first moment) of each gene calculated using k-nearest neighbors to alleviate dropout. (d) Pseudotime trajectory analyses of three potential Tex differentiation paths in scATAC-seq space (top). Heat maps of transcription factor motif deviation scores and gene integration scores (integrated scRNA-seq expression values) over the pseudotime trajectories (middle). Gene integration scores for Tox expression in the three pseudotime trajectories (bottom). (e) Schematic of adoptive transfer experiments of Texint subset (top). Pre-transfer enrichment strategy for Texint cells (middle). Stacked bar plot of the phenotypic composition of transferred T cells with all Tex subsets shown or only the CX3CR1+ subsets (bottom, n = 5 biologically independent animals). Mean % of each subset is indicated.
Figure 5.
Figure 5.. Conserved clonal T cell trajectories across organs and depletion of TexKLR in the liver microenvironment.
(a) UMAP of organ-derived T cells at D21 in Cl13 infection colored by the annotated T cell subsets. (b) UMAPs colored by the detected TCR clone sizes in the different organs. (c) Scatterplots comparing the frequencies of expanded T cell clones from the indicated organs. The correlation coefficient (Pearson’s R), and specific and shared clone numbers are indicated for each comparison. (d) Venn diagram depicting the overlap of expanded T cell clones in the gp33+ fraction of the indicated organs. (e) Stacked bar plot of the phenotypic composition of individual clones across organs. (f) UMAPs of individual clones with specific clone behaviors across organs. (g) Scatter plots comparing the fraction of cells in individual clones with TexKLR and Texterm phenotypes between the indicated organs. Correlation coefficient calculated using Pearson’s R and p-value determined using a two-sided t-distribution with n-2 degrees of freedom. Shaded area represents 95% confidence interval of linear model. (h) Violin plot of TexKLR-biased clone frequencies across the organs, defined as clones with >50% TexKLR phenotype in the spleen (left). Violin plot of Texterm-biased and divergent clone frequencies across the organs (right; n = number of scRNA-seq profiles; box center line, median; box limits, upper and lower quartiles; box whiskers, 1.5× interquartile range). P-values determined by two-sided Wilcoxon Rank Sum test.
Figure 6.
Figure 6.. Clonal differentiation of TexKLR and Texterm correlates with TCR signaling avidity.
(a) Sorting strategy to obtain gp33, gp33int and gp33high CD8+ T cell populations from the spleen of LCMV-Cl13 infected animals 21-days following infection. (b) Venn diagram of the overlap of expanded clones from the gp33 T cell fractions. (c) UMAPs colored by size of the unique expanded clones in the three gp33 T cell fractions. (d) Stacked bar plot of the top 10 uniquely expanded T cell clones from gp33 T cell fractions colored by T cell phenotype. (e) Upset plots of phenotype combinations (clone behavior) in unique expanded clones from the three gp33 T cell fractions. For clarity the top 7 most common clone behaviors are shown. Bar plots show the number of clones with the indicated phenotypes. Dominant clone behaviors are indicated at the bottom. (f) Dose response curves of gp33 peptide stimulation of the indicated TCRs in an NFAT-GFP reporter T cell hybridoma cell line. TCRs were selected from gp33high (divergent clones) and gp33int (TexKLR-biased clones) fractions. Peptide concentration that triggers half of the maximum signaling avidity is indicated based on % of GFP+ cells (log10EC50 values). Clone size and phenotype distribution of each clone is shown as a stacked bar plot. Bar plot shows normalized (to TCR expression) % of GFP+ cells (Norm. reporter activity) for all TCRs stimulated with a constant peptide concentration (100nM, bottom left). P14 LCMV-specific TCR was used as a positive control and OT-1 TCR (ovalbumin peptide specific) as a negative control. The mean of two technical replicates are shown of a representative experiment out of three independent experiments which all showed the same results.
Figure 7.
Figure 7.. Human TILs exhibit shared Tex transcriptional programs and divergent clonal differentiation trajectories.
(a) UMAP of TILs profiled by scRNA-seq from Zheng et al., 2021, colored by T cell phenotypes. (b) UMAPs colored by the indicated LCMV Cl13 Tex gene signature scores (top). Violin plots of LCMV Cl13 Tex gene signature scores across human TIL clusters (bottom, box center line, median; box limits, upper and lower quartiles; box whiskers, 1.5× interquartile range). For each violin plot, n = number of scRNA-seq profiles: Tnaive = 6,879; Tem = 37,057; Trm = 18,348; TexTCF7+ = 757; TmNME1+ = 593; Texterm = 13,024; TemraCX3CR1+ = 11,702. (c) Violin plots of additional LCMV Cl13 Tex gene signature scores across human TIL clusters (box center line, median; box limits, upper and lower quartiles; box whiskers, 1.5× interquartile range). Human TIL clusters are ranked in decreasing order with cluster with highest enrichment of LCMV Cl13 Tex gene signature score on the left. For each violin plot, cell numbers are same as (b). (d) Schematic of the relationships found between human TIL subsets and mouse LCMV-reactive (gp33+) Tex subsets. (e) Stacked bar plots of the phenotype distribution of top 10 human expanded TIL clones for the indicated clone behaviors that were detected among LCMV-reactive mouse T cells.

References

    1. Hashimoto M et al. CD8 T Cell Exhaustion in Chronic Infection and Cancer: Opportunities for Interventions. Annu Rev Med 69, 301–318 (2018). - PubMed
    1. McLane LM, Abdel-Hakeem MS & Wherry EJ CD8 T Cell Exhaustion During Chronic Viral Infection and Cancer. Annu Rev Immunol 37, 457–495 (2019). - PubMed
    1. Blank CU et al. Defining ‘T cell exhaustion’. Nat Rev Immunol 19, 665–674 (2019). - PMC - PubMed
    1. Scott AC et al. TOX is a critical regulator of tumour-specific T cell differentiation. Nature 571, 270–274 (2019). - PMC - PubMed
    1. Paley MA et al. Progenitor and terminal subsets of CD8+ T cells cooperate to contain chronic viral infection. Science 338, 1220–1225 (2012). - PMC - PubMed

Publication types

Substances