. 2022 Oct 26;41(1):315.
doi: 10.1186/s13046-022-02516-w.

LAMC2 marks a tumor-initiating cell population with an aggressive signature in pancreatic cancer

Affiliations

LAMC2 marks a tumor-initiating cell population with an aggressive signature in pancreatic cancer

Donatella Delle Cave et al. J Exp Clin Cancer Res. .

Abstract

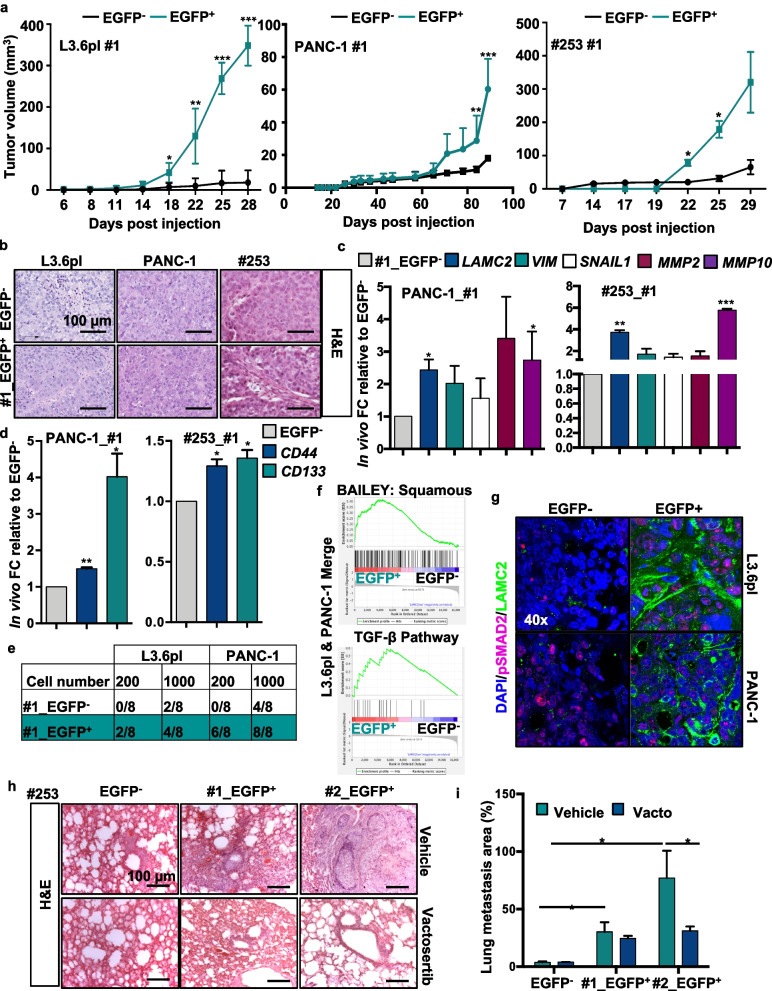
Background: Tumor-initiating cells (TIC), also known as cancer stem cells, are considered a specific subpopulation of cells necessary for cancer initiation and metastasis; however, the mechanisms by which they acquire metastatic traits are not well understood.

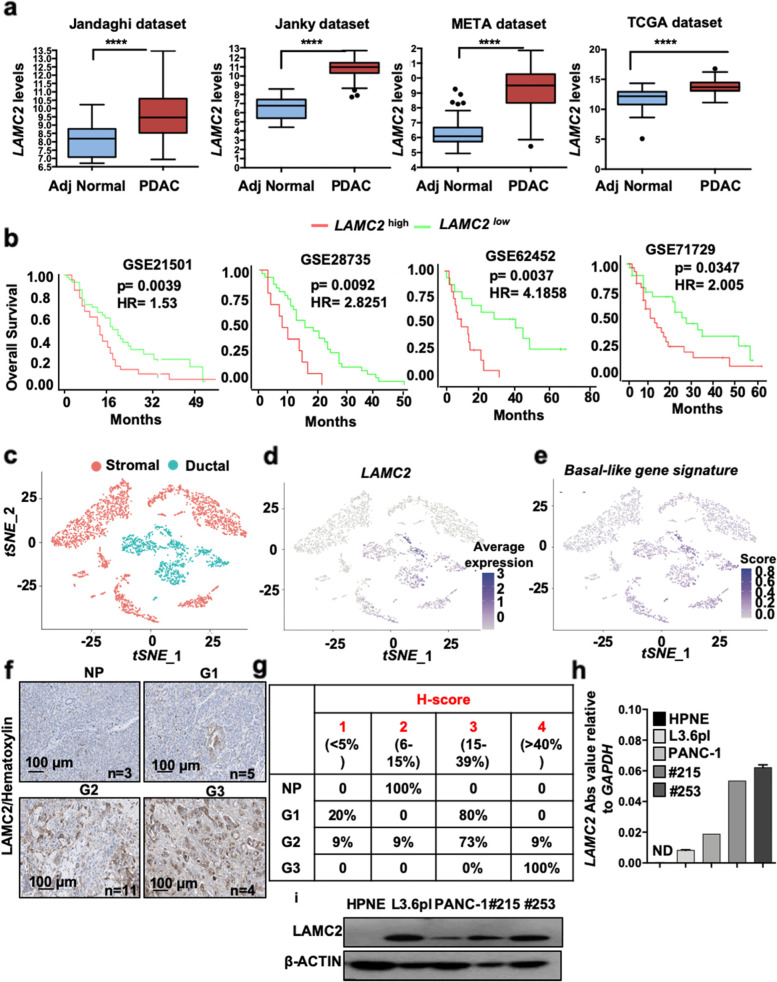
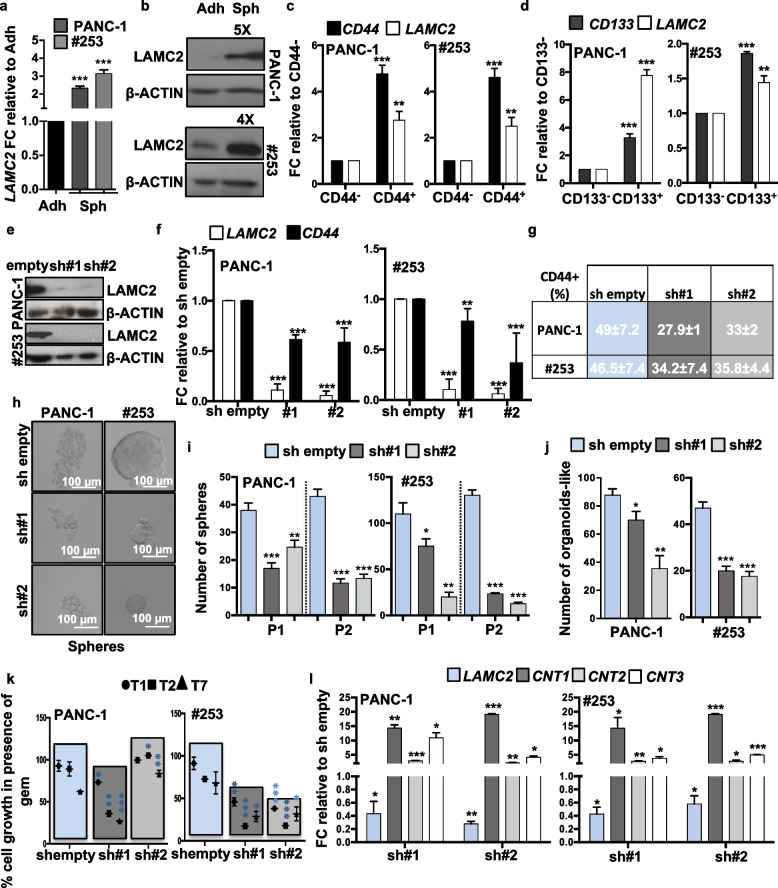
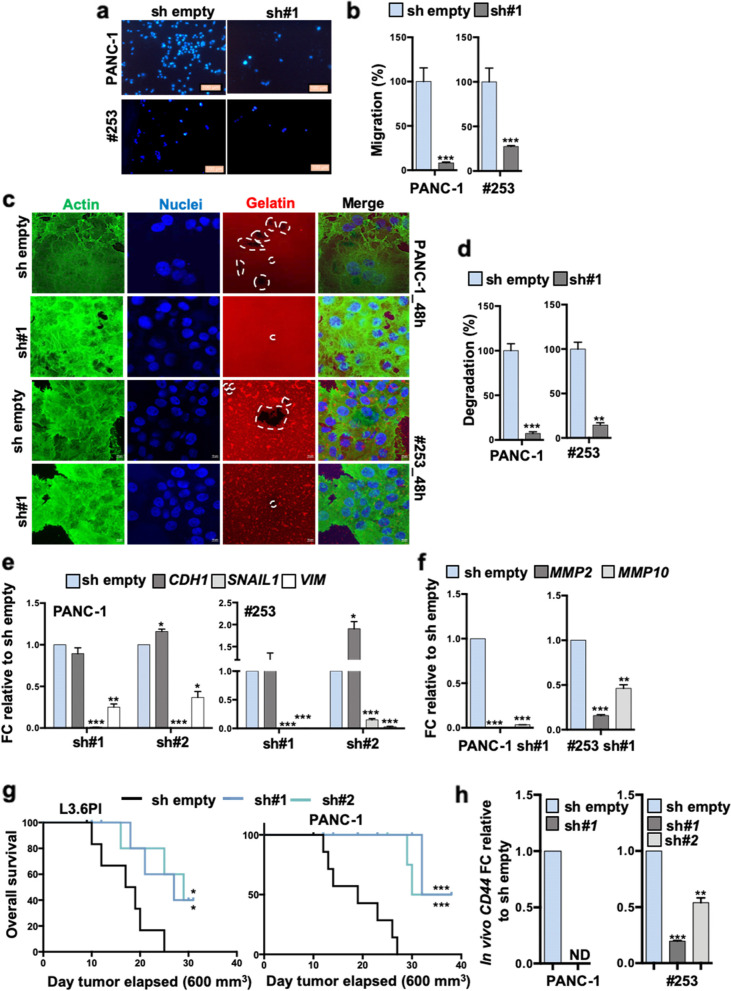
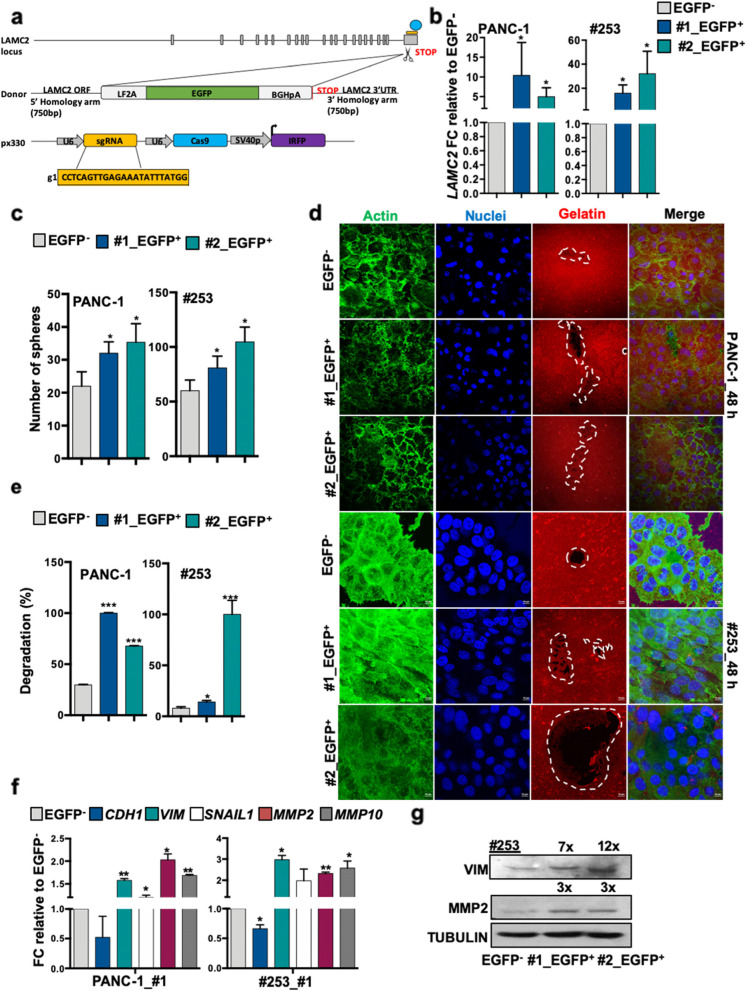
Methods: LAMC2 transcriptional levels were evaluated using publicly available transcriptome data sets, and LAMC2 immunohistochemistry was performed using a tissue microarray composed of PDAC and normal pancreas tissues. Silencing and tracing of LAMC2 was performed using lentiviral shRNA constructs and CRISPR/Cas9-mediated homologous recombination, respectively. The contribution of LAMC2 to PDAC tumorigenicity was explored in vitro by tumor cell invasion, migration, sphere-forming and organoids assays, and in vivo by tumor growth and metastatic assays. mRNA sequencing was performed to identify key cellular pathways upregulated in LAMC2 expressing cells. Metastatic spreading induced by LAMC2- expressing cells was blocked by pharmacological inhibition of transforming growth factor beta (TGF-β) signaling.

Results: We report a LAMC2-expressing cell population, which is endowed with enhanced self-renewal capacity, and is sufficient for tumor initiation and differentiation, and drives metastasis. mRNA profiling of these cells indicates a prominent squamous signature, and differentially activated pathways critical for tumor growth and metastasis, including deregulation of the TGF-β signaling pathway. Treatment with Vactosertib, a new small molecule inhibitor of the TGF-β type I receptor (activin receptor-like kinase-5, ALK5), completely abrogated lung metastasis, primarily originating from LAMC2-expressing cells.

Conclusions: We have identified a highly metastatic subpopulation of TICs marked by LAMC2. Strategies aimed at targeting the LAMC2 population may be effective in reducing tumor aggressiveness in PDAC patients. Our results prompt further study of this TIC population in pancreatic cancer and exploration as a potential therapeutic target and/or biomarker.

Keywords: Laminin γ2 (LAMC2); Pancreatic ductal adenocarcinoma (PDAC); TGF-β signaling; Tumor-initiating cells (TICs); Vactosertib.


Conflict of interest statement

The authors declare no conflict of interest.

Figures

Fig. 1
Fig. 1
LAMC2 expression in PDAC correlates with poorer outcome. a Boxplots illustrating differential expression of LAMC2 in PDAC tissue versus normal adjacent tissue using the indicated series of transcriptomic data. **** p < 0.0001. Statistical significance was assessed by Student's t-test. b Kaplan–Meier curves showing overall survival of PDAC patients, stratified according to the median value of LAMC2 expression. c Dimensional reduction plot (DimPlot) of stromal versus ductal (tumor) cells identified in PDAC primary tumors by scRNA-Seq. The clusters are color-coded based on cell types identified using known cell type-specific markers and are visualized using t-SNE. d Feature Plot for LAMC2 expression in multiple cell types identified in PDAC primary tumors by scRNA-Seq. The clusters are color-coded based on LAMC2 expression and are visualized using t-SNE. e Feature Plot for basal-like gene signature expression score in multiple cell types identified in PDAC primary tumors by scRNA-Seq. The clusters are color-coded based on LAMC2 expression and are visualized using t-SNE. f Representative images of IHC staining for LAMC2 (brown) in tissue sections from normal pancreas (P) and patients with PDAC tumors at G1, G2 and G3 grade. g H-score for LAMC2 expression. h qPCR analysis for LAMC2 expression in adherent cells. Data are normalized to GAPDH expression. i Western blot analysis of LAMC2 in adherent cells. Parallel β-ACTIN immunoblotting was performed. n 3
Fig. 2
Fig. 2
LAMC2 expression correlates with stemness and chemoresistance. a qPCR analysis for LAMC2 gene expression in adherent cells versus spheres. Data are normalized to GAPDH and are presented as fold change in gene expression relative to adherent cells. b Western blot analysis for LAMC2 in adherent cells versus spheres. Parallel β-ACTIN immunoblotting was performed. c qPCR analysis for CD44 and LAMC2 gene expression in CD44+ sorted cells. Data are normalized to GAPDH and are presented as fold change in gene expression relative to CD44 cells. d qPCR analysis for CD133 and LAMC2 gene expression in CD133+ sorted cells. Data are normalized to GAPDH and are presented as fold change in gene expression relative to CD133 cells. e Western blot analysis for LAMC2 in sh empty and LAMC2 knockdown cells. Parallel β-ACTIN immunoblotting was performed. f qPCR analysis for LAMC2 and CD44 expression for sh empty versus LAMC2 knockdown cells. Data are normalized to GAPDH expression and are presented as fold change in gene expression relative to sh empty. g Flow cytometry quantification of CD44 in sh empty and LAMC2 knockdown cells. h Representative images of sh empty and LAMC2 knockdown cells grown as spheres. i Sphere formation capacity of sh empty and LAMC2 knockdown cells. P1 = 1st generation; P2 = 2nd generation. j Organoid formation capacity for sh empty versus LAMC2 knockdown cells. k Growth capacity of sh empty and LAMC2 knockdown cells in the presence of 100 μM Gemcitabine (GEM). l qPCR analysis for LAMC2, CNT1, CNT2 and CNT3 genes in sh empty versus LAMC2 knockdown cells. Data are normalized to GAPDH expression and are presented as fold change in gene expression relative to sh empty. *p < 0.05, **p < 0.005, ***p < 0.0005. n 3. Statistical significance was assessed by Student's t-test
Fig. 3
Fig. 3
Loss of LAMC2 reduces tumorigenicity. a Migration assay for sh empty versus LAMC2 knockdown cells. The nuclei were stained with DAPI (blue). b Migratory potential of sh empty versus LAMC2 knockdown cells. c Representative images of gelatin degradation for sh empty versus LAMC2 knockdown cells. Nuclei were stained with Hoechst 33342 (blue), green represents actin (Alexa Fluor™ 488 Phalloidin) and red illustrates gelatin (Rodhamine). The white dashed lines circles indicates the areas of degradation. d Invasive potential of sh empty versus LAMC2 knockdown cells. e qPCR analysis for EMT genes in sh empty and LAMC2 knockdown cells. Data are normalized to GAPDH and are presented as fold change in gene expression relative to sh empty. f qPCR analysis for MMP2 and MMP10 gene expression in sh empty and LAMC2 knockdown cells. Data are normalized to GAPDH and are presented as fold change in gene expression relative to sh empty. g Kaplan–Meier curve for sh empty and LAMC2 knockdown cells subcutaneously xenografted into nude athymic mice. n ≥ 10. h qPCR analysis for CD44 gene expression in sh empty and LAMC2 knockdown cells isolated from respective tumors. Data are normalized to GAPDH and are presented as fold change in gene expression relative to sh empty. *p < 0.05, **p < 0.005, ***p < 0.0005. n 3. Statistical significance was assessed by Student's t-test. For the Kaplan–Meier curve, the statistical significance was assessed by the log-rank (Mantel-Cox) test
Fig. 4
Fig. 4
Generation of LAMC2-EGFP knock-in human pancreatic cancer cells. a Design of LAMC2‐EGFP donor and CRISPR/Cas9 sgRNA vectors. Blue circle represents the CRISPR/Cas9 protein complex and the yellow box underneath illustrates the guide RNA. b qPCR analysis for LAMC2 gene expression in EGFP+ and EGFP cells. Data are normalized to GAPDH and are presented as fold change in gene expression relative to the EGFP counterpart. c Sphere formation capacity for EGFP+ versus EGFP cells. d Representative images of gelatin degradation for EGFP+ versus EGFP cells. Nuclei were stained with Hoechst 33342 (blue), green represents actin (Alexa Fluor™ 488 Phalloidin) and red illustrates gelatin (Rodhamine). The white dashed line circles indicates the areas of degradation. e Invasive potential of sh empty versus LAMC2 knockdown cells. f qPCR analysis for EMT and MMP2 and MMP10 gene expression for EGFP+ versus EGFP cells. Data are normalized to GAPDH and are presented as fold change in gene expression relative to the EGFP cells. g Western blot analysis of VIM and MMP2 in EGFP+ and EGFP cells. Parallel Tubulin immunoblotting was performed. *p < 0.05, **p < 0.005, ***p < 0.0005. n 3. Statistical significance was assessed by Student's t-test
Fig. 5
Fig. 5
Pharmacological inhibition of TGF-β signaling blocks LAMC2-induced metastasis. a Volume of tumors formed following subcutaneously injection of EGFP+ and EGFP cells in nude athymic mice. n ≥ 10. b Representative H&E-stained sections of xenografts derived from EGFP+ or EGFP cells. c qPCR analysis for LAMC2, EMT, MMP2 and MMP10 gene expression in EGFP+ or EGFP cells, isolated from tumors. Data are normalized to GAPDH and are presented as fold change relative to EGFP. d qPCR analysis or CD44 and CD133 expression in EGFP+ or EGFP cells isolated from tumors. Data are normalized to GAPDH and are presented as fold change in gene expression relative to EGFP. e Number of tumors generated by subcutaneous injection of EGFP+ or EGFP cells. f Enrichment plot for EGFP+ versus EGFP cells isolated by FACS from subcutaneous tumors. g Representative immunofluorescence images for pSMAD2 (violet), LAMC2 (green) and nuclei (blue, DAPI) in tumor sections derived from EGFP or EGFP+ cells subcutaneously xenografted in nude athymic mice. h qPCR analysis for LAMC2 expression in PDAC cells treated with 10 ng/ml of rTGF-β1 in the presence or absence of 80 μM Vactosertib. Data are normalized to GAPDH and are presented as fold change in gene expression relative to control. i Representative H&E-stained sections of lungs following tail vein injection of EGFP+ or EGFP tumor cells. Mice were treated with Vactosertib (40 mg/kg mice) or vehicle. *p < 0.05, **p < 0.005, ***p < 0.0005. n 5. Statistical significance was assessed by Student's t-test

References

    1. Fitzmaurice C, Global Burden of Disease Cancer Collaboration Global, regional, and national cancer incidence, mortality, years of life lost, years lived with disability, and disability-adjusted life-years for 29 cancer groups, 2006 to 2016: a systematic analysis for the Global Burden of Disease study. J Clin Oncol. 2018;36:1568–1568. - PMC - PubMed
    1. Gresham GK, Wells GA, Gill S, Cameron C, Jonker DJ. Chemotherapy regimens for advanced pancreatic cancer: a systematic review and network meta-analysis. BMC Cancer. 2014;14:471. - PMC - PubMed
    1. Abel EV, Simeone DM. Biology and clinical applications of pancreatic cancer stem cells. Gastroenterology. 2013;144:1241–1248. - PubMed
    1. Lonardo E, Hermann PC, Mueller M-T, Huber S, Balic A, Miranda-Lorenzo I, et al. Nodal/Activin signaling drives self-renewal and tumorigenicity of pancreatic cancer stem cells and provides a target for combined drug therapy. Cell Stem Cell. 2011;9:433–446. - PubMed
    1. Cave DD, Rizzo R, Sainz B. The Revolutionary Roads to Study Cell–Cell Interactions in 3D In Vitro Pancreatic Cancer Models. 2021. p. 19. - PMC - PubMed