. 2022 Sep 20;10(10):2334.
doi: 10.3390/biomedicines10102334.

The Oncogenic and Tumor Suppressive Long Non-Coding RNA-microRNA-Messenger RNA Regulatory Axes Identified by Analyzing Multiple Platform Omics Data from Cr(VI)-Transformed Cells and Their Implications in Lung Cancer

Affiliations

The Oncogenic and Tumor Suppressive Long Non-Coding RNA-microRNA-Messenger RNA Regulatory Axes Identified by Analyzing Multiple Platform Omics Data from Cr(VI)-Transformed Cells and Their Implications in Lung Cancer

Osama Sweef et al. Biomedicines. .

Abstract

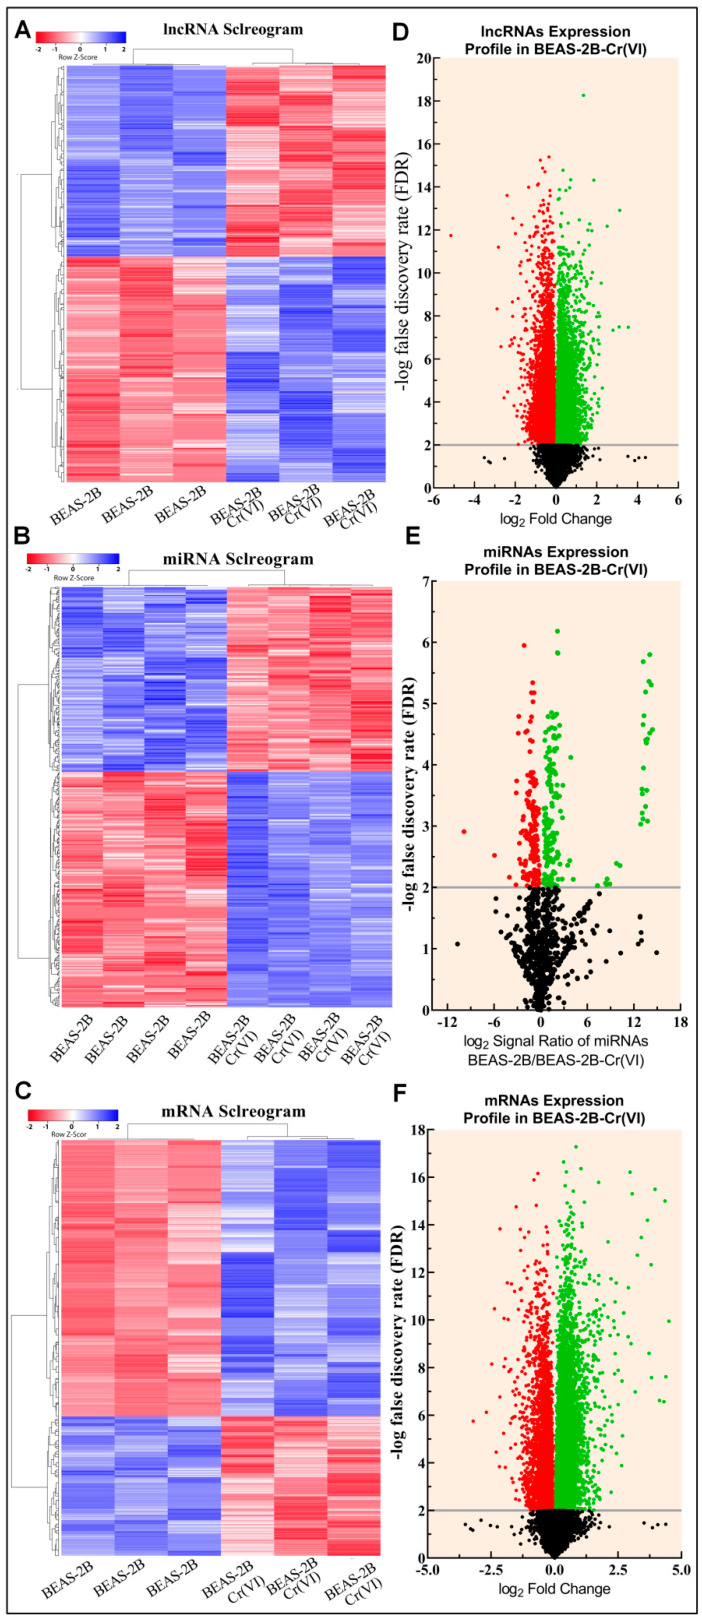
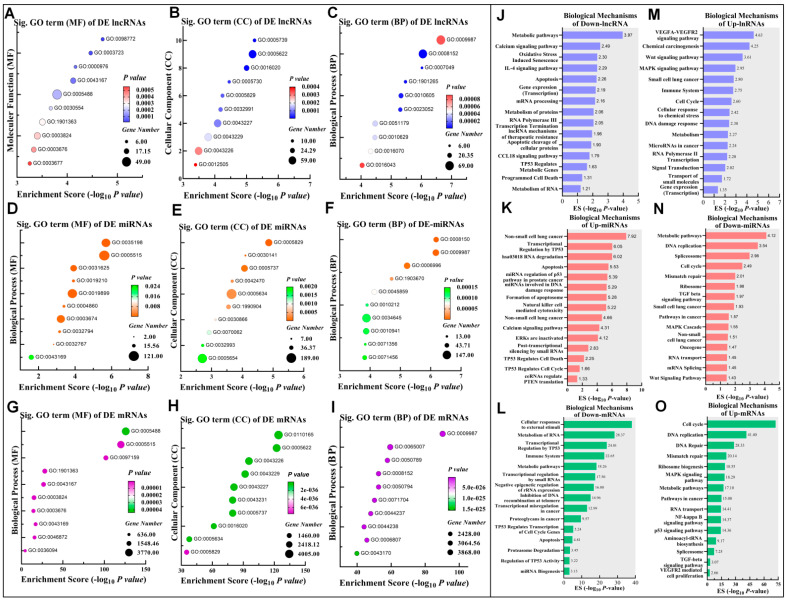
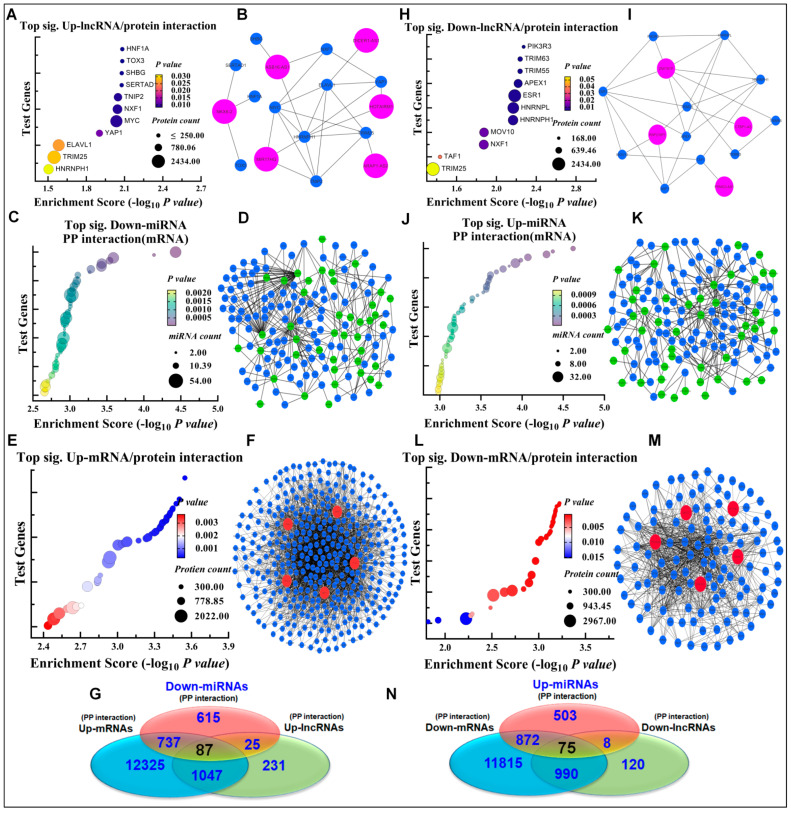
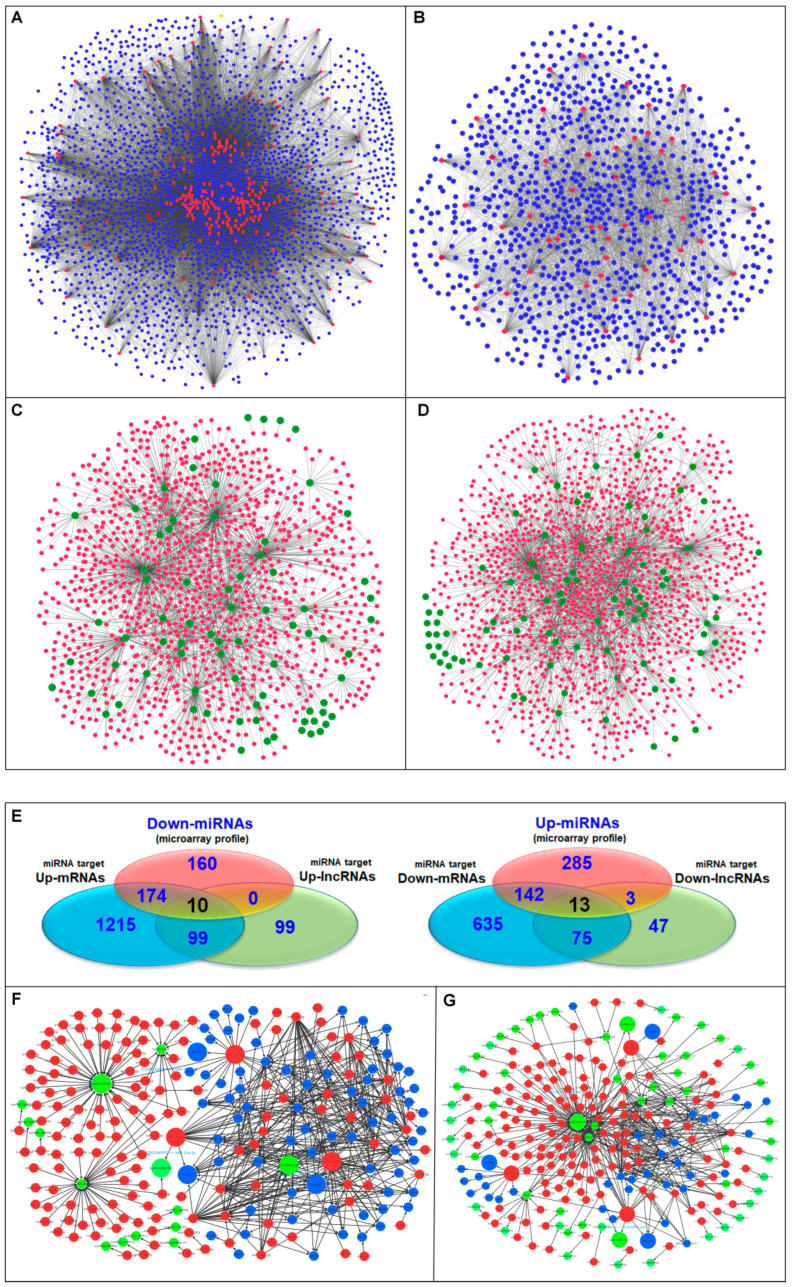
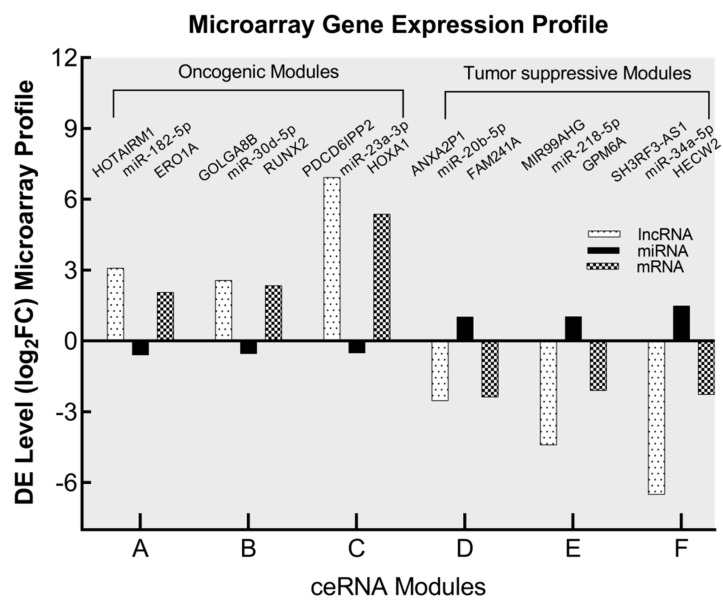
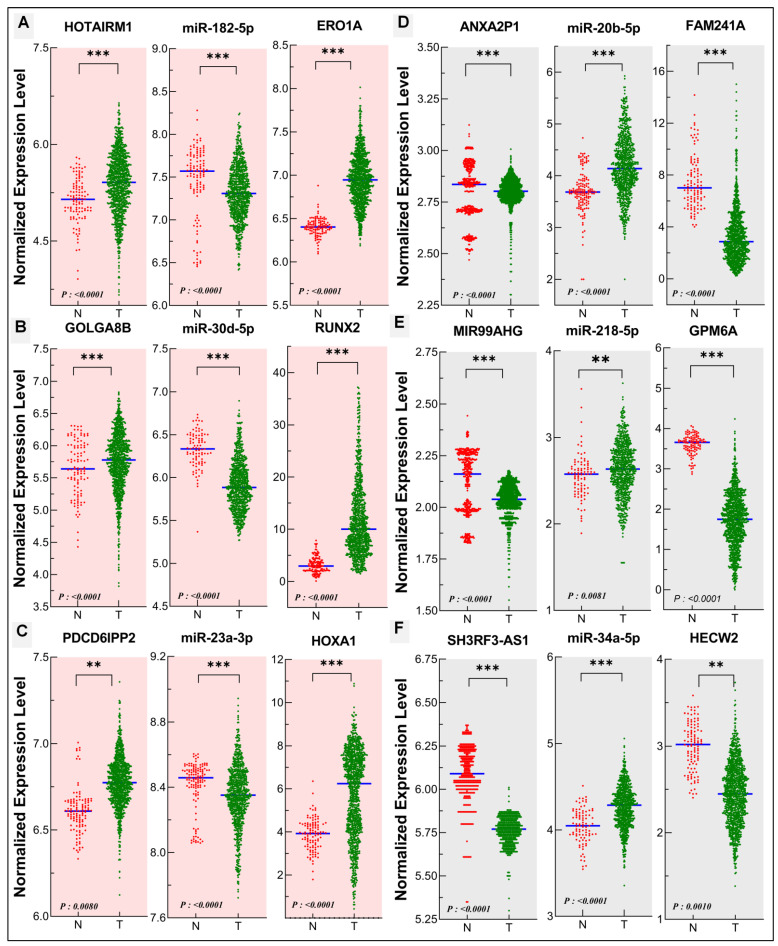
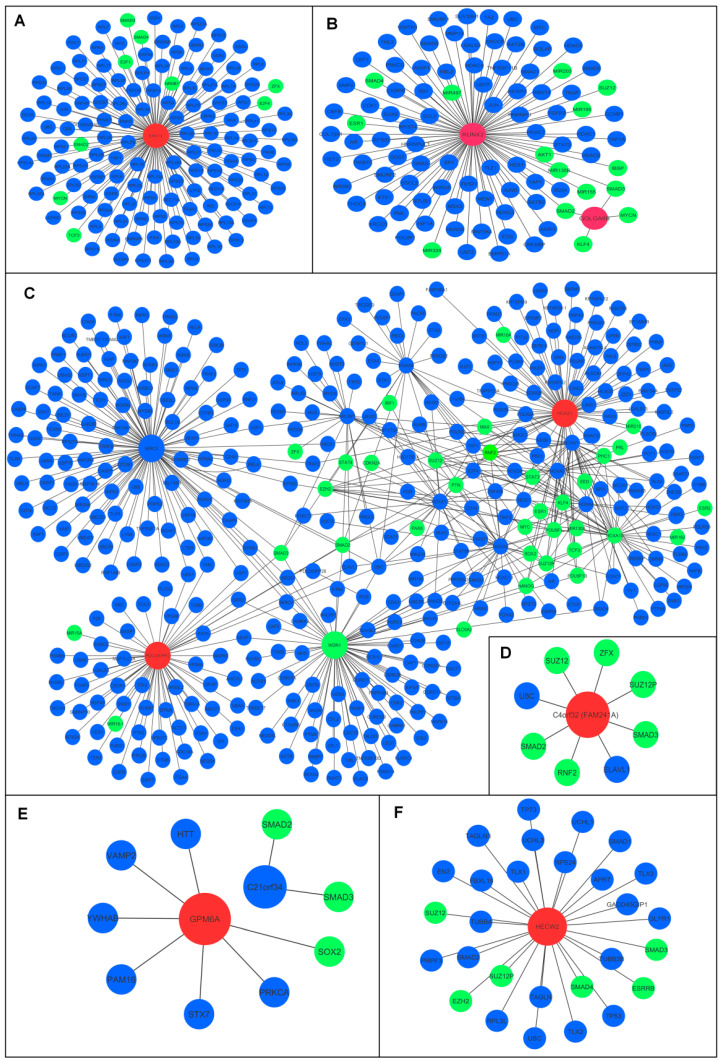
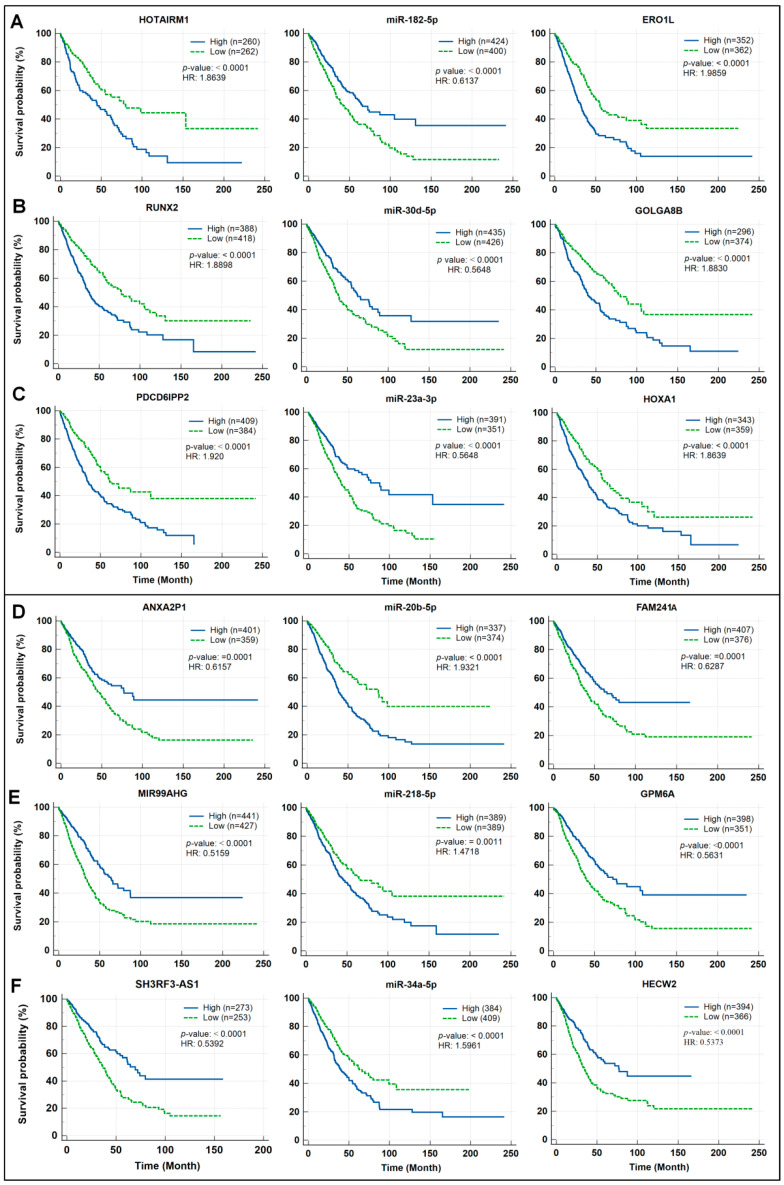
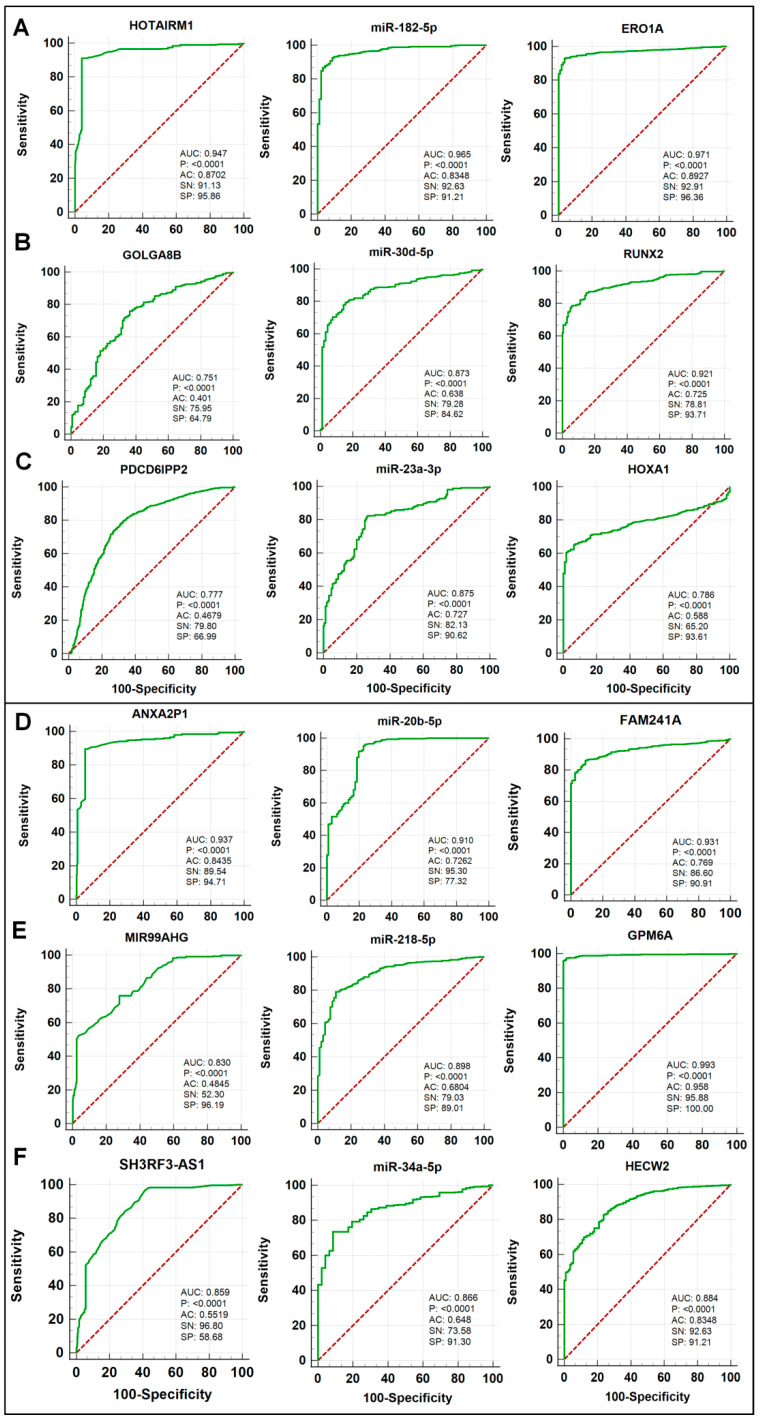
Chronic exposure to hexavalent chromium (Cr(VI)) causes lung cancer in humans, however, the underlying mechanism has not been well understood. Long non-coding RNAs (lncRNAs) and microRNAs (miRNAs) are commonly studied non-coding RNAs. miRNAs function mainly through interaction with the 3'-untranslated regions of messenger RNAs (mRNAs) to down-regulate gene expression. LncRNAs have been shown to function as competing endogenous RNAs (ceRNAs) to sponge miRNAs and regulate gene expression. It is now well accepted that lncRNAs and miRNAs could function as oncogenes or tumor suppressors. Dysregulations of lncRNAs and miRNAs have been shown to play important roles in cancer initiation, progression, and prognosis. To explore the mechanism of Cr(VI) lung carcinogenesis, we performed lncRNA, mRNA, and miRNA microarray analysis using total RNAs from our previously established chronic Cr(VI) exposure malignantly transformed and passage-matched control human bronchial epithelial BEAS-2B cells. Based on the differentially expressed lncRNAs, miRNAs, and mRNAs between the control (BEAS-2B-Control) and Cr(VI)-transformed (BEAS-Cr(VI)) cells and by using the lncRNA-miRNA interaction and miRNA target prediction algorithms, we identified three oncogenic (HOTAIRM1/miR-182-5p/ERO1A, GOLGA8B/miR-30d-5p/RUNX2, and PDCD6IPP2/miR-23a-3p/HOXA1) and three tumor suppressive (ANXA2P1/miR-20b-5p/FAM241A (C4orf32), MIR99AHG/miR-218-5p/GPM6A, and SH3RF3-AS1/miR-34a-5p/HECW2) lncRNA-miRNA-mRNA regulatory axes. Moreover, the relevance of these three oncogenic and three tumor suppressive lncRNA-miRNA-mRNA regulatory axes in lung cancer was explored by analyzing publicly available human lung cancer omics datasets. It was found that the identified three oncogenic lncRNA-miRNA-mRNA regulatory axes (HOTAIRM1/miR-182-5p/ERO1A, GOLGA8B/miR-30d-5p/RUNX2, and PDCD6IPP2/miR-23a-3p/HOXA1) and the three tumor suppressive lncRNA-miRNA-mRNA regulatory axes (ANXA2P1/miR-20b-5p/FAM241A (C4orf32), MIR99AHG/miR-218-5p/GPM6A, and SH3RF3-AS1/miR-34a-5p/HECW2) have significant diagnostic and prognosis prediction values in human lung cancer. In addition, our recent studies showed that Cr(VI)-transformed cells display cancer stem cell (CSC)-like properties. Further bioinformatics analysis identified the oncogenic lncRNA-miRNA-mRNA regulatory axes as the potential regulators of cancer stemness. In summary, our comprehensive analysis of multiple platform omics datasets obtained from Cr(VI)-transformed human bronchial epithelial cells identified several oncogenic and tumor suppressive lncRNA-miRNA-mRNA regulatory axes, which may play important roles in Cr(VI) carcinogenesis and lung cancer in general.

Keywords: ROC curve; cancer stemness; ceRNA; hexavalent chromium (Cr(VI)); lncRNA; lung cancer; miRNA; prognosis.


Conflict of interest statement

The authors declare there are no conflicts of interest connected to this manuscript.

Figures

Figure 1
Figure 1
Transcriptomic profiles of BEAS-2B-Control and BEAS-2B-Cr(VI) cells. (AC) Hierarchical clustering correlogram of DE lncRNA, miRNA, and mRNA transcripts, respectively. In the two-color system, blue indicates increased expression, while red indicates decreased expression. (DF) Volcano graphs show the DE RNA transcripts of the lncRNA, miRNA, and mRNA transcripts, respectively. The significantly up-regulated candidates are marked by green dots; the significantly down-regulated candidates are marked by red dots whereas the non-significant candidates are marked by black dots under the gray line.
Figure 2
Figure 2
Biological profiles of DE lncRNA, miRNA, and mRNA transcripts. (A) Top significant GO terms of linked MF DE lncRNA profile. (B) Top significant CC. (C) Top significant BP of DE lncRNA profile. (DF) Top significant MF, CC, and BP from the DE miRNAs, respectively. The top significant terms of MF, CC, and BP from the DE mRNAs are represented in (GI), respectively. The top significant biological pathways of down-lncRNA, up-miRNA, and down-mRNA (tumor suppressor axis) are shown in (JL). The significant biological pathways of the oncogenic axis of Up-lncRNA, Down-miRNA, and Up-mRNA are represented in (MO). The dot size reflects the number of shared genes in each biological function and the dot two-color system indicates the p-values.
Figure 3
Figure 3
RNA–protein binding networks of oncogenic and tumor suppressive axes. (A) Top up-lncRNAs/protein–protein (PP) interaction, demonstrating considerable one seed interaction through the examined tested genes. (B) The top up-lncRNAs and PP interaction network, which illustrates all the roles of up-lncRNAs and PP interactions as network panels. (C) Top 50 down-miRNAs that bind to mRNA. (D) Connections between down-miRNAs and mRNA in the top 50 partners. (E) The top 5 up-mRNAs interacting with PP interactions (one seed). (F) A connection between the PP network (one seed) and the top five down-mRNAs. (G) Venn diagram illustrating the shared proteins interacting with the oncogenic axis components, 87 proteins are interacting with the oncogenic axis components. (H) The linkage between top down-regulated lncRNAs and PP interaction (one seed). (I) The network panel of PP interaction with the top down-regulated lncRNAs. (J) The highly significant top 50 interactions of up-miRNAs with their partners (mRNA). (K): Up-miRNA–PP interaction network (mRNA) (top 50 interactions). (L) The highly significant top 5 interactions of down-mRNAs with their protein partners. (M) The network connections between the PP interactions and the top 5 down-mRNAs. (N) Venn diagram depicting common proteins interacting with the tumor suppressor system components, 75 proteins are involved. The dot size reflects the interactant counts of proteins and the dot two-color system indicates the p-value significance of RNA/PP interaction. The lncRNAs, miRNAs, mRNAs and proteins are labeled in violet, green, red, and blue colors, respectively, in the RNA–protein binding network.
Figure 4
Figure 4
miRNA interactions with lncRNA and mRNA of BEAS-2B-Cr(VI). The miRNA interactions with mRNAs that have been up- and down-regulated are shown in (A,B). miRNA interactions with lncRNAs that have been up- and down-regulated are shown in (C,D), respectively. (E) The shared miRNAs in array profile and predictably interacting with DE lncRNAs and mRNAs in oncogenic and tumor suppressor activities. Triple networks comprising lncRNA/miRNA/mRNA in oncogenic and tumor suppressor activities are shown in (F,G), respectively. The three-color system of green, red, and blue represents lncRNA, miRNA, and mRNA, respectively. Gene ID of mRNA and lncRNA (last 6 digits only) was used in each node of the network.
Figure 5
Figure 5
The potential oncogenic and tumor suppressor RNAs in BEAS-2B-Cr(VI) cells. The fold changes (compared to control cells) of expression levels of each RNA component are calculated using values from each type of RNA microarray expression profile.
Figure 6
Figure 6
Validation of expression levels of lncRNAs, miRNAs, and mRNAs in identified oncogenic and tumor suppressive ceRNA modules in human lung cancer using gene expression profiling interactive analysis. (AC) The oncogenic axes HOTAIRM1/miR-182-5p/ERO1A, GOLGA8B/miR-30d-5p/RUNX2, and PDCD6IPP2/miR-23a-3p/HOXA1. (DF) The tumor suppressor axes ANXA2P1/miR-20b-5p/FAM241A, MIR99AHG/miR-218-5p/GPM6A, and SH3RF3-AS1/miR-34a-5p/HECW2. N: normal tissue samples (n = 110); T: tumor tissue samples (n = 1050) (for tumor suppressive MIR99AHG, SH3RF3-AS1, and ANXA2P1 n = 450 and T = 2050). **, p ≤ 0.05; ***, p ≤ 0.0001.
Figure 7
Figure 7
Predicated stemness signatures of selected ceRNA modules. (A) ERO1L’s physical and regulatory interactions with stemness-related genes and stemness TFs. (B) The interaction of GOLGA8B and RUNX2 partners with the stemness TFs in both the physical and regulatory ways. (C) The stemness signature of PDCD6IPP2/miR-23a-3p/HOXA1 module represented via PDCD6IPP2 and HOXA1. (D) The stemness signature of ANXA2P1/miR-20b-5p/FAM241A via interaction with stemness-related genes by FAM241A. (E) GPM6A interaction with stemness-related genes. (F) HECW2 interaction with stemness TFs. The red–green color system represents regulatory interaction, the red–blue color system indicates physical interaction.
Figure 8
Figure 8
Survival analysis and prognostic performance of selected ceRNA modules in lung cancer. The Kaplan–Meier survival analysis of oncogenic regulatory axes (AC) and tumor suppressor regulatory axes (DF).
Figure 9
Figure 9
ROC curve and diagnostic performance of ceRNA modules in lung cancer. The ROC curve analysis of oncogenic and tumor suppressor regulatory axes (AC) and (DF), respectively. AC: accuracy; SN: sensitivity; SP: specificity.

References

    1. Chromium I. IARC Monograph on the Evaluation of Carcinogenic Risks to Humans. World Health Organization; Lyon, France: 1990. Nickel, and welding.
    1. ATSDR (Agency for Toxic Substances and Disease Research) Top 20 Hazardous Substances: ATSDR/EPA Priority List for 2017. U.S. Department of Health and Human Services Public Health Service/U.S. Environmental Protection Agency. [(accessed on 10 June 2021)];2019 Available online: https://www.atsdr.cdc.gov/SPL/index.html#2019spl.
    1. DesMarias T.L., Costa M. Mechanisms of chromium-induced toxicity. Curr. Opin. Toxicol. 2019;14:1–7. doi: 10.1016/j.cotox.2019.05.003. - DOI - PMC - PubMed
    1. Salnikow K., Zhitkovich A. Genetic and epigenetic mechanisms in metal carcinogenesis and cocarcinogenesis: Nickel, arsenic, and chromium. Chem. Res. Toxicol. 2008;21:28–44. doi: 10.1021/tx700198a. - DOI - PMC - PubMed
    1. Wang Z., Yang C. Metal carcinogen exposure induces cancer stem cell-like property through epigenetic reprograming: Anovel mechanism of metal carcinogenesis. Semin. Cancer Biol. 2019;57:95–104. doi: 10.1016/j.semcancer.2019.01.002. - DOI - PMC - PubMed

LinkOut - more resources