. 2022 Oct 20;10(10):2644.
doi: 10.3390/biomedicines10102644.

Neuroprotective Effects of gH625-lipoPACAP in an In Vitro Fluid Dynamic Model of Parkinson's Disease

Affiliations

Neuroprotective Effects of gH625-lipoPACAP in an In Vitro Fluid Dynamic Model of Parkinson's Disease

Teresa Barra et al. Biomedicines. .

Abstract

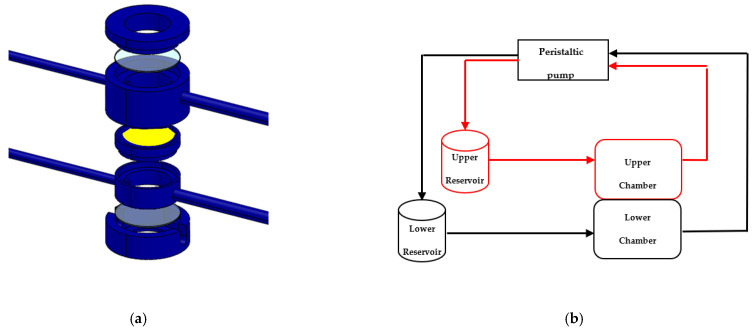
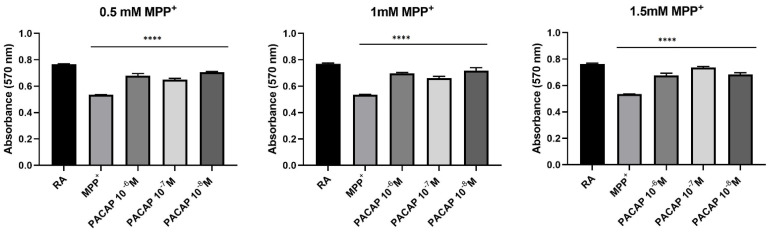
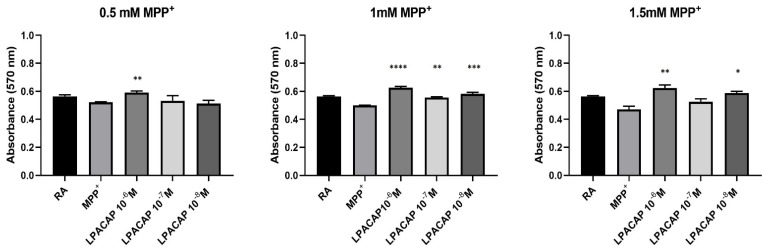
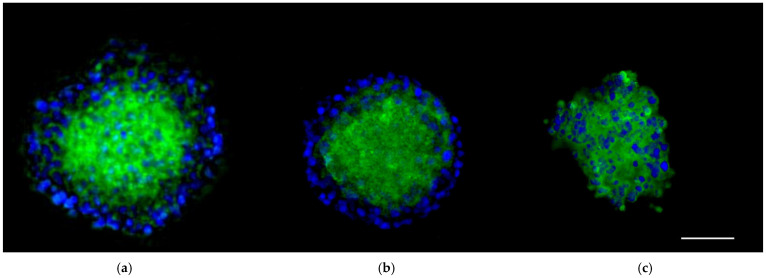
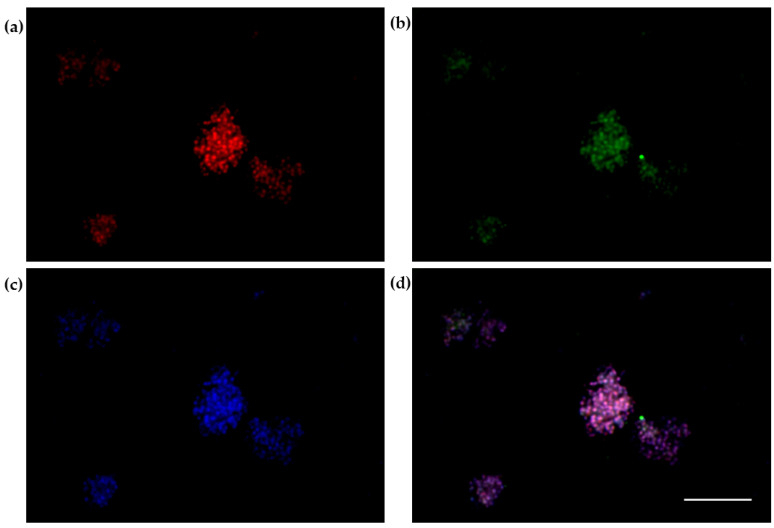
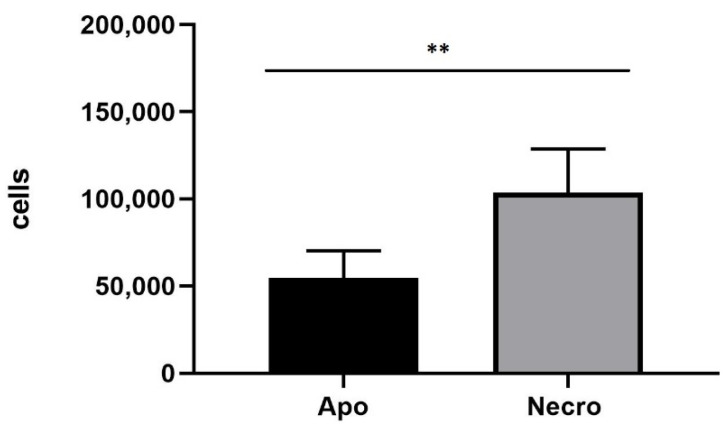
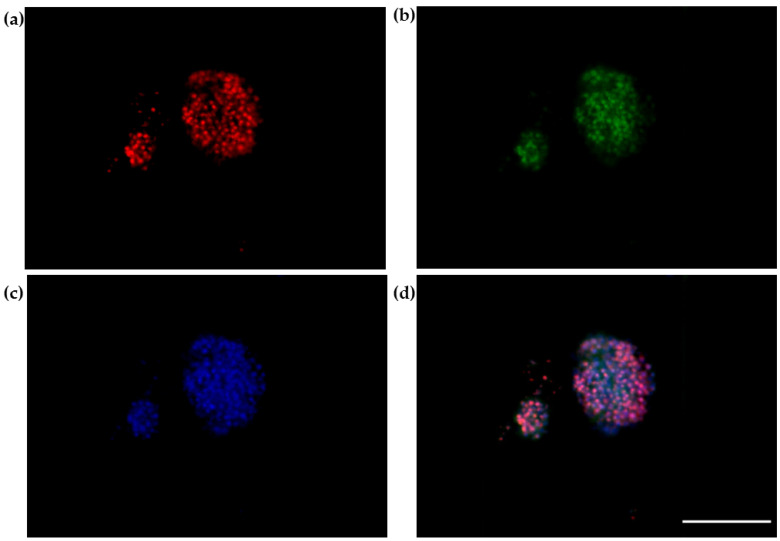
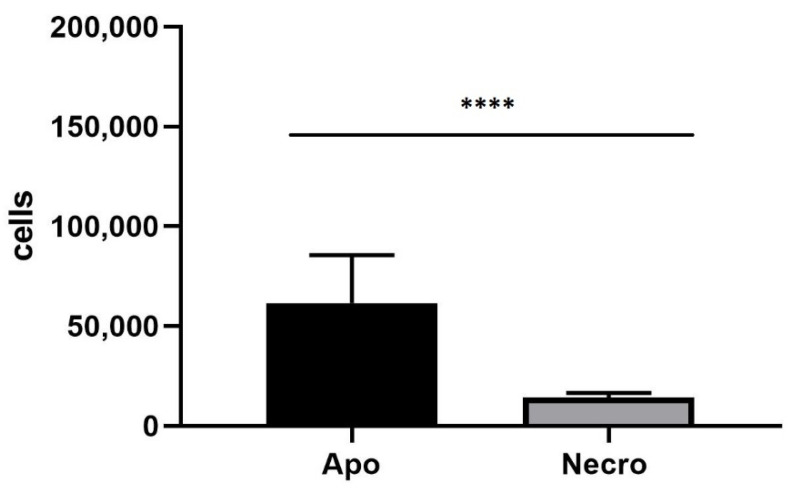
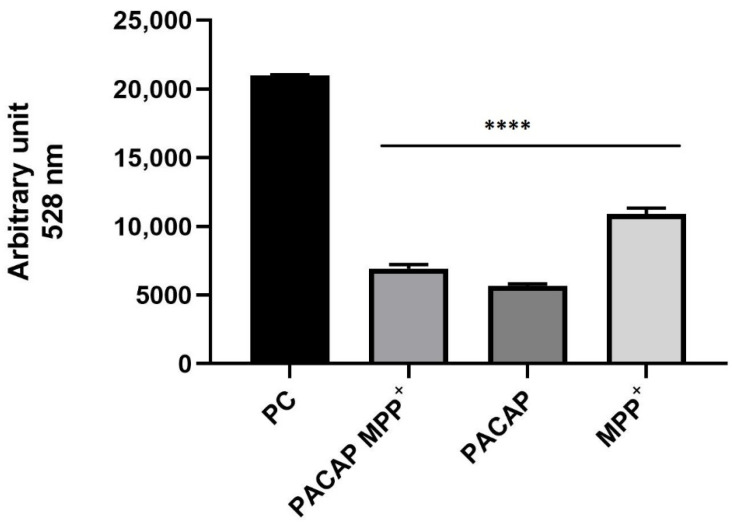
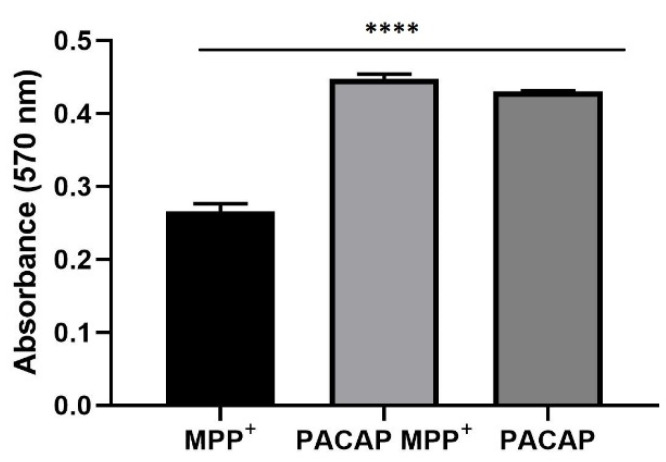
Parkinson's disease (PD) is an aggressive and devastating age-related disorder. Although the causes are still unclear, several factors, including genetic and environmental, are involved. Except for symptomatic drugs, there are not, to date, any real cures for PD. For this purpose, it is necessary develop a model to better study this disease. Neuroblastoma cell line, SH-SY5Y, differentiated with retinoic acid represents a good in vitro model to explore PD, since it maintains growth cells to differentiated neurons. In the present study, SH-SY5Y cells were treated with 1-methyl-4-phenylpyridinium (MPP+), a neurotoxin that induces Parkinsonism, and the neuroprotective effects of pituitary adenylate cyclase-activating polypeptide (PACAP), delivered by functionalized liposomes in a blood-brain barrier fluid dynamic model, were evaluated. We demonstrated PACAP neuroprotective effects when delivered by gH625-liposome on MPP+-damaged SH-SY5Y spheroids.

Keywords: PACAP; Parkinson’s disease; millifluidic model.


Conflict of interest statement

The authors declare no conflict of interest.

Figures

Figure 1
Figure 1
The 3D schematic exploded view of Livebox2 dynamic bioreactor composed by an upper chamber and a lower chamber separated by a porous membrane (yellow) with an appropriate rounded microscopy coverslip (a). Chambers of the bioreactor are connected to their respective reservoirs and to a peristaltic pump (b).
Figure 2
Figure 2
Spectrophotometric analysis on the effects of PACAP on cell viability following MPP+ treatment on dopaminergic neurons (SH-SY5Y/RA). The results show exposure after 24 h. The graph shows the means ± SEM of three experiments. Statistical analysis was performed through the analysis of variance (ANOVA) and the Dunnet’s post-test. Values were considered significant, compared to the control MPP+. **** p < 0.0001.
Figure 3
Figure 3
Spectrophotometric analysis on the effects of gH-lipoPACAP-Rho (LPACAP) on cell viability following MPP+ treatment on dopaminergic neurons (SH-SY5Y/RA). The results show exposure after 24 h. The graph shows the means ± SEM of three experiments. Statistical analysis was performed through the analysis of variance (ANOVA) and the Dunnet’s post-test. Values were considered significant, compared to the control MPP+. * p < 0.05, ** p < 0.01, *** p < 0.001, **** p < 0.0001.
Figure 4
Figure 4
Representative image of spheroids obtained by culturing human neuroblastoma 3D SH-SY5Y/RA cells in the LB1 after 24 h of fluid condition (100 μL/min). Spheroids were immunoreacted with PAC1-R primary antibody (GFP, (a)), VPAC1 primary antibody (GFP, (b)), VPAC2 primary antibody (GFP, (c)). Nuclei, DAPI. Images were acquired as Z stack with the JuLI Stage fluorescence recorder and maximum intensity projection was shown. Scale bar: 250 µm.
Figure 5
Figure 5
Annexin/PI labelling of neural spheroids treated with 1.5 mM MPP+: apoptotic cells ((a)-red); necrotic cells ((b)-green); DAPI ((c)-blue); Merge (d). Scale bar: 100 µm.
Figure 6
Figure 6
Annexin/PI on neural spheroids (3D SHSY5Y/RA) treated with 1.5 mM MPP+. The number of necrotic cells is higher, compared to apoptotic cells. The graph shows the means ± SEM of three experiments. Statistical analysis was performed through the analysis of variance (ANOVA) and the Dunnet’s post-test. The differences were statistically significant between apoptotic and necrotic cells. ** p < 0.01.
Figure 7
Figure 7
Annexin/PI labelling of neural spheroids without 1.5 mM MPP+: apoptotic cells ((a)-red); necrotic cells ((b)-green); DAPI ((c)-blue); Merge (d). Scale bar: 100 µm.
Figure 8
Figure 8
Annexin/PI on neural spheroids without 1.5mM MPP+. The number of apoptotic cells is higher compared to necrotic cells. The graph shows the means ± SEM of three experiments. Statistical analysis was performed through the analysis of variance (ANOVA) and the Dunnet’s post-test. The differences were considered significantly between apoptotic and necrotic cells. **** p < 0.01.
Figure 9
Figure 9
Spectrofluorometric analysis of rhodaminated PACAP (gH625-lipoPACAP-Rho) delivery across a BBB dynamic in vitro model (LB2) with bEnd.3 in the upper chamber and 3D SH-SY5Y/RA in the lower chamber. Functionalized liposome was loaded with PACAP-Rho and injected in the upper flow. The passage beyond the endothelial cell layer were then evaluated by sampling downstream the upper chamber (UC) and the lower chamber (LC), respectively. The graph shows the means ± SEM of three experiments. Statistical analysis was performed through the analysis of Mann–Whitney test. The differences were considered significant between gH625-lipoPACAP-Rho UC and gH625-lipoPACAP-Rho LC. **** p < 0.001.
Figure 10
Figure 10
Spectrofluorometric analysis of rhodaminated PACAP (gH625-lipoPACAP-Rho) delivery across BBB dynamic in vitro model (LB2) with bEnd.3 in the upper chamber and 3D SH-SY5Y/RA/MPP+ in the lower chamber. Functionalized liposome was loaded with PACAP-Rho and injected in the upper flow. The passage beyond the endothelial cell layer was then evaluated by sampling downstream the upper chamber (UC) and the lower chamber (LC), respectively. The graph shows the means ± SEM of three experiments. Statistical analysis was performed through the analysis of Mann–Whitney test. The differences were considered significant between gH625-lipoPACAP-Rho UC and gH625-lipoPACAP-Rho LC. **** p < 0.001.
Figure 11
Figure 11
Expression of cell junctions’ proteins in bEnd.3 cells cultured on the porous membrane of Livebox2 after one week of flow conditions (100 µL/min). Western blotting analysis: lane 1 (a), ZO-1 tight junctions’ expression; lane 2 (b), N-Cadherin adherens junctions’ expression; lane 3 (c) β-catenin adherens junctions’ expression. The blot was stripped and re-probed with an anti-β-actin polyclonal antibody to ensure equal loading of proteins in the remaining lanes (d). Molecular mass markers are indicated on the left of the Western blotting panels.
Figure 12
Figure 12
Semiquantitative analysis of cell junctions’ proteins in bEnd.3 cells cultured on the porous membrane of Livebox2 after one week of flow conditions (100 µL/min). Cell lysates were normalized, with respect to anti-β-actin polyclonal antibody. ZO-1, tight junctions’ protein results expressed more than N-Cadherin and β-Catenin, adherens junctions proteins. The graph shows the means ± SEM of three different Western blotting. Statistical analysis was performed through the analysis of Mann–Whitney test. The differences were considered significant among junctions’ proteins. **** p < 0.001.
Figure 13
Figure 13
DCFH2-DA assay on 3D SH-SY5Y/RA treated with both gH625-lipoPACAP-Rho and MPP+ (PACAP MPP+), 3D SH-SY5Y/RA treated with gH625-lipoPACAP-Rho (PACAP) and 3D SH-SY5Y/RA treated with MPP+ (MPP+). Spheroids treated with gH625-lipoPACAP-Rho show a decrease in ROS concentration, mainly compared to MPP+. The graph shows the means ± SEM of three experiments. Statistical analysis was performed through the analysis of variance (ANOVA) and the Dunnet’s post-test. The differences were considered significant, compared to the MPP+. **** p < 0.01.
Figure 14
Figure 14
Prestoblue assay on 3D SH-SY5Y/RA/MPP+ (MPP+) and 3D SH-SY5Y/RA/MPP+ treated with gH625-lipoPACAP-Rho (PACAP MPP+) and 3D SH-SY5Y/RA treated only with gH625-lipoPACAP-Rho (PACAP). The 3D SH-SY5Y/RA spheroids show higher viability when treated with gH625-lipoPACAP-Rho (PACAP MPP+ and PACAP), compared to 3D SH-SY5Y/RA/MPP+ (MPP+). The graph shows the means ± SEM of three experiments. Statistical analysis was performed through the analysis of variance (ANOVA) and the Dunnet’s post-test. The differences were considered significant, compared to spheroids (3D SH-SY5Y/RA) treated with MPP+ (MPP+). **** p < 0.01.

Similar articles

Cited by

References

    1. Dorsey E.R., Constantinescu R., Thompson J.P., Biglan K.M., Holloway R.G., Kieburtz K. Projected number of people with Parkinson disease in the most populous nations, 2005 through 2030. Neurology. 2007;68:384–386. doi: 10.1212/01.wnl.0000247740.47667.03. - DOI - PubMed
    1. Lo Bianco C., Schneider B.L., Bauer M., Sajadi A., Brice A., Iwatsubo T., Aebischer P. Lentiviral vector delivery of parkin prevents dopaminergic degeneration in an asynuclein rat model of Parkinson’s disease. Proc. Natl Acad. Sci. USA. 2004;101:17510–17515. doi: 10.1073/pnas.0405313101. - DOI - PMC - PubMed
    1. Wirdefeldt K., Adami H.O., Cole P., Trichopoulos D., Mandel J. Epidemiology and etiology of Parkinson’s disease: A review of the evidence. Eur. J. Epidemiol. 2011;26:1–58. doi: 10.1007/s10654-011-9581-6. - DOI - PubMed
    1. Chaudhuri K.R., Schapira A.H. Non-motor symptoms of Parkinson’s disease: Dopaminergic pathophysiology and treatment. Lancet Neurol. 2009;8:464–474. doi: 10.1016/S1474-4422(09)70068-7. - DOI - PubMed
    1. Xia R., Mao Z.H. Progression of motor symptoms in Parkinson’s disease. Neurosci. Bull. 2012;28:39–48. doi: 10.1007/s12264-012-1050-z. - DOI - PMC - PubMed

LinkOut - more resources