. 2022 Oct 19;11(10):1531.
doi: 10.3390/biology11101531.

Machine-Learning-Assisted Analysis of TCR Profiling Data Unveils Cross-Reactivity between SARS-CoV-2 and a Wide Spectrum of Pathogens and Other Diseases

Affiliations

Machine-Learning-Assisted Analysis of TCR Profiling Data Unveils Cross-Reactivity between SARS-CoV-2 and a Wide Spectrum of Pathogens and Other Diseases

Georgios K Georgakilas et al. Biology (Basel). .

Abstract

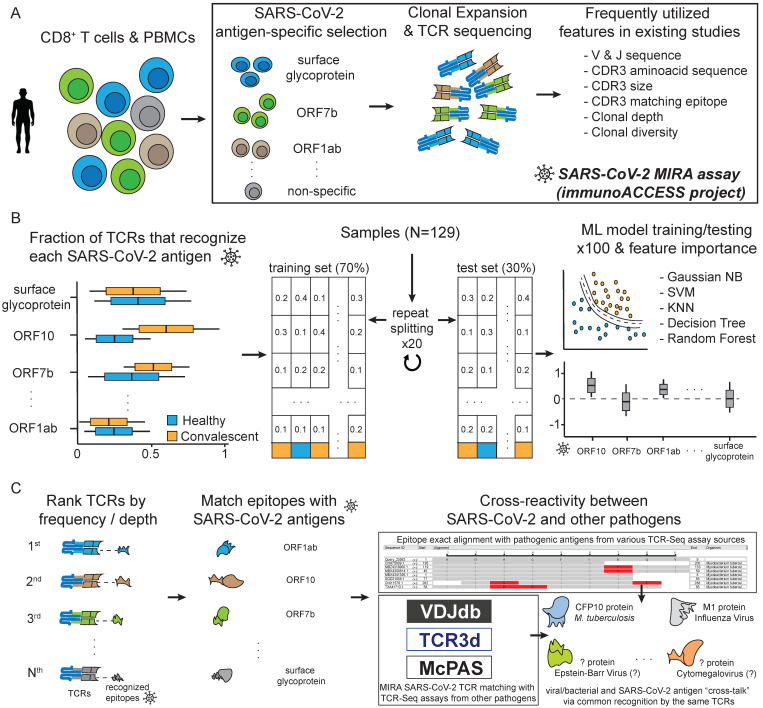
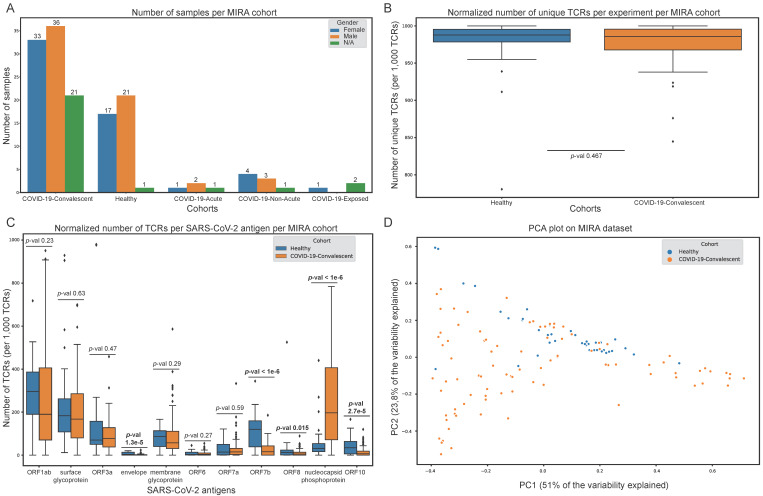
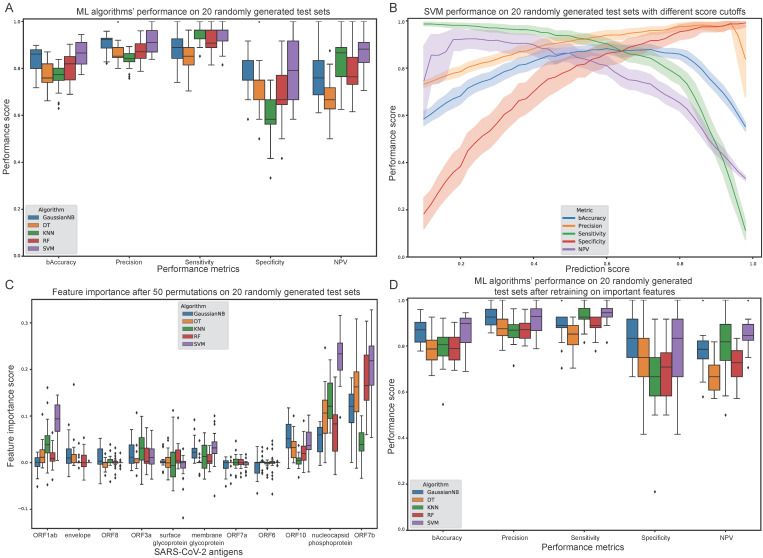
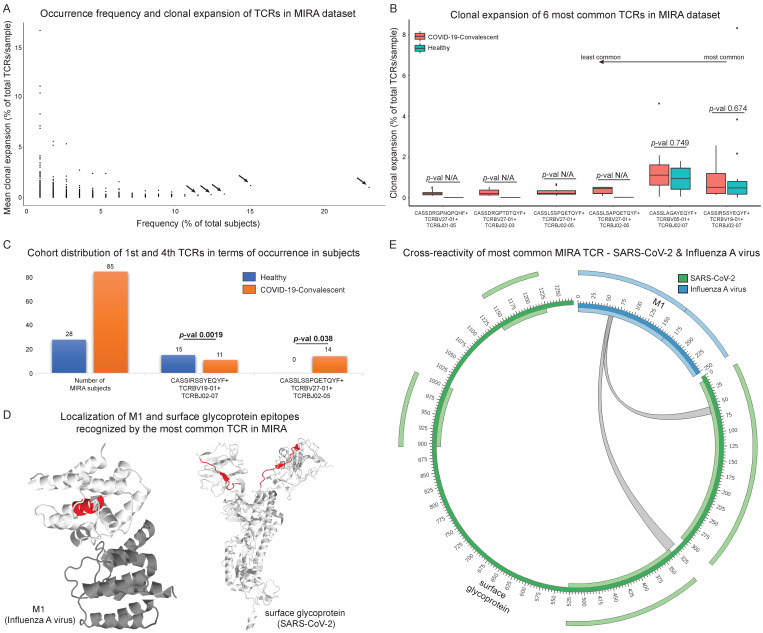
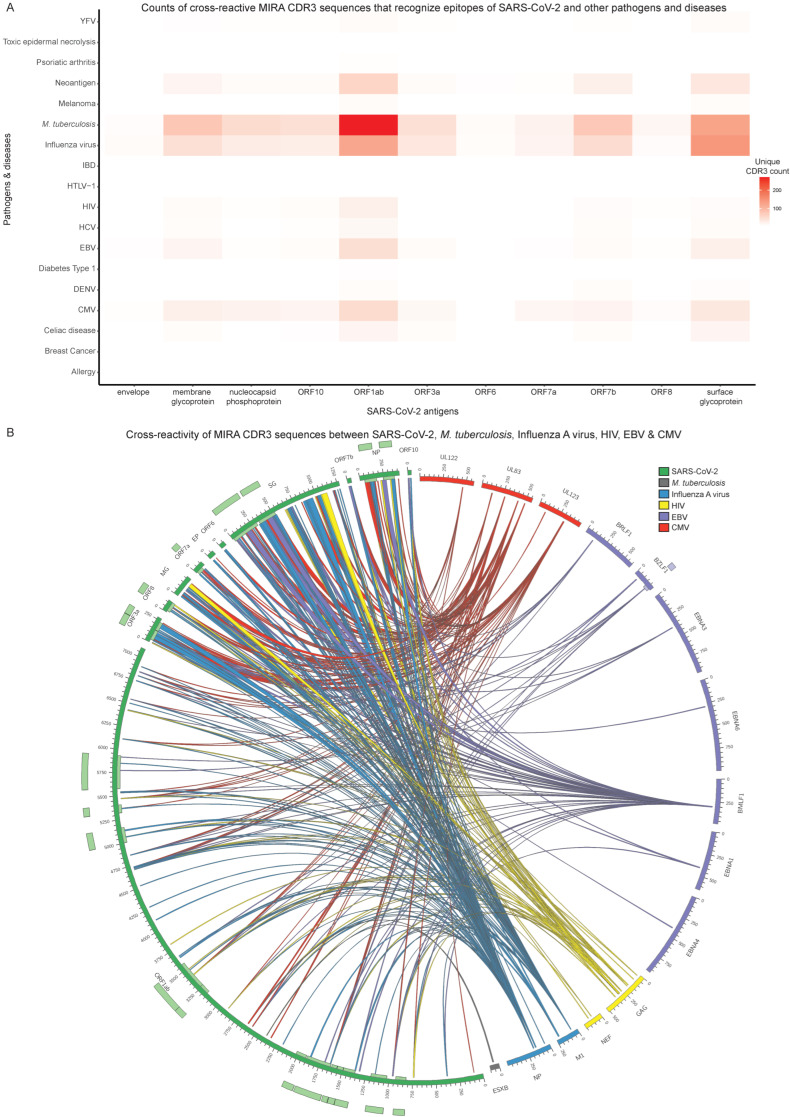
During the last two years, the emergence of SARS-CoV-2 has led to millions of deaths worldwide, with a devastating socio-economic impact on a global scale. The scientific community's focus has recently shifted towards the association of the T cell immunological repertoire with COVID-19 progression and severity, by utilising T cell receptor sequencing (TCR-Seq) assays. The Multiplexed Identification of T cell Receptor Antigen (MIRA) dataset, which is a subset of the immunoACCESS study, provides thousands of TCRs that can specifically recognise SARS-CoV-2 epitopes. Our study proposes a novel Machine Learning (ML)-assisted approach for analysing TCR-Seq data from the antigens' point of view, with the ability to unveil key antigens that can accurately distinguish between MIRA COVID-19-convalescent and healthy individuals based on differences in the triggered immune response. Some SARS-CoV-2 antigens were found to exhibit equal levels of recognition by MIRA TCRs in both convalescent and healthy cohorts, leading to the assumption of putative cross-reactivity between SARS-CoV-2 and other infectious agents. This hypothesis was tested by combining MIRA with other public TCR profiling repositories that host assays and sequencing data concerning a plethora of pathogens. Our study provides evidence regarding putative cross-reactivity between SARS-CoV-2 and a wide spectrum of pathogens and diseases, with M. tuberculosis and Influenza virus exhibiting the highest levels of cross-reactivity. These results can potentially shift the emphasis of immunological studies towards an increased application of TCR profiling assays that have the potential to uncover key mechanisms of cell-mediated immune response against pathogens and diseases.

Keywords: COVID-19; MIRA dataset; Machine Learning; T cell receptor; cross-reactivity phenomenon; diseases; pathogens.


Conflict of interest statement

The authors declare no conflict of interest.

Figures

Figure 1
Figure 1
Overview of this study. (A) Outline of the Multiplexed Identification of T cell Receptor Antigen (MIRA) assay and the corresponding dataset available from the immunoACCESS© project web resource. (B) Analytic steps in this study, regarding the novel utilisation of the MIRA dataset for training Machine Learning algorithms that can highlight important SARS-CoV-2 antigens for distinguishing samples between healthy and COVID-19-convalescent cohorts. (C) Strategy for exploring T cell cross-reactivity between SARS-CoV-2 and other pathogens and diseases.
Figure 2
Figure 2
Exploratory analysis of the Multiplexed Identification of T cell Receptor Antigen (MIRA) dataset. (A) Number of samples in each MIRA cohort. (B) Per sample normalised number of unique T cell receptors (TCRs) in the healthy and convalescent cohorts. (C) Per sample normalised number of TCRs that recognise each SARS-CoV-2 antigen in the healthy and convalescent cohorts. (D) Projection of healthy and convalescent samples on the principal component analysis (PCA) space. Healthy and convalescent distributions in (B,C) were compared with the Mann-Whitney test.
Figure 3
Figure 3
Evaluation of Machine Learning (ML) algorithms trained on the healthy and convalescent cohorts in the Multiplexed Identification of T cell Receptor Antigen (MIRA) dataset. (A) Balanced accuracy, precision, sensitivity, specificity and negative predictive value (NPV) of each algorithm after selecting a prediction score cut-off of 0.5. (B) Support Vector Machines (SVM) performance on multiple prediction score cut-offs. (C) Feature importance score after 50 permutations on all 20 randomly generated test sets. (D) ML algorithms’ performance after selecting only the important features for each algorithm and retraining.
Figure 4
Figure 4
Exploration of the most common Multiplexed Identification of T cell Receptor Antigen (MIRA) T cell receptors (TCRs) in terms of clonal expansion and cross-reactivity. (A) Occurrence frequency and clonal expansion of all MIRA TCRs. The arrows point to the six most common TCRs (present in at least 11.5% of total number of subjects) that were further analysed in terms of clonal expansion in the two cohorts based on Mann-Whitney test (B). The statistical test could not be performed for some TCRs (denoted as p-val N/A). (C) Cohort distribution of the first and fourth most common MIRA TCRs that were found to be enriched in either cohort after applying Fisher’s exact test. (D) Secondary structure of surface glycoprotein (SARS-CoV-2) and Matrix protein 1 (M1) with cross-reactive sections, based on the most common MIRA TCR, highlighted with red colour. Locations highlighted with red colour consist of epitopes recognised by the cross-reactive TCRs and putatively reflect protein domains with similar structural or physicochemical properties. (Ε) Circular plot, as an alternative view of (D), depicting the cross-reactive property of the most common MIRA TCR that recognises epitopes from surface glycoprotein and M1. The inner and outer light-colored tracks represent the annotated domains.
Figure 5
Figure 5
Cross-reactivity analysis of all Multiplexed Identification of T cell Receptor Antigen (MIRA) T cell receptors (TCRs). (A) Heatmap of unique MIRA complementarity-determining region 3 (CDR3) counts that exhibit cross-reactivity between SARS-CoV-2 (x-axis) and other pathogens and diseases (y-axis). The heatmap values correspond to the number of unique cross-reactive CDR3 sequences. (B) Circular plot that depicts the cross-reactivity of MIRA CDR3 regions between antigens that originate from SARS-CoV-2 and a selected subset of pathogens from (A). The inner and outer light-coloured tracks represent the annotated protein domains. Each connection represents the ability of a single CDR3 region to recognise a part of a SARS-CoV-2 antigen and a part of another pathogen’s protein. The connections are coloured based on their corresponding non-SARS-CoV-2 pathogens.

Similar articles

Cited by

References

    1. JHCRC . John Hopkins Coronavirus Resource Center. Johns Hopkins University School of Medicine; Baltimore, MD, USA: [(accessed on 23 September 2022)]. Available online: https://coronavirus.jhu.edu/covid-19-daily-video.
    1. Eastin C., Eastin T. Clinical Characteristics of Coronavirus Disease 2019 in China. J. Emerg. Med. 2020;58:711–712. doi: 10.1016/j.jemermed.2020.04.004. - DOI
    1. Velavan T.P., Meyer C.G. The COVID-19 Epidemic. Trop. Med. Int. Health. 2020;25:278–280. doi: 10.1111/tmi.13383. - DOI - PMC - PubMed
    1. Lopez-Leon S., Wegman-Ostrosky T., Perelman C., Sepulveda R., Rebolledo P.A., Cuapio A., Villapol S. More than 50 Long-Term Effects of COVID-19: A Systematic Review and Meta-Analysis. Sci. Rep. 2021;11:16144. doi: 10.1038/s41598-021-95565-8. - DOI - PMC - PubMed
    1. Whitley R. Molnupiravir—A Step toward Orally Bioavailable Therapies for COVID-19. N. Engl. J. Med. 2021;386:592–593. doi: 10.1056/NEJMe2117814. - DOI - PMC - PubMed

LinkOut - more resources