Bone Molecular Modifications Induced by Diagenesis Followed-Up for 12 Months
- PMID: 36290445
- PMCID: PMC9598178
- DOI: 10.3390/biology11101542
Bone Molecular Modifications Induced by Diagenesis Followed-Up for 12 Months
Abstract
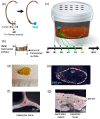
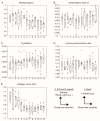
After death, diagenesis takes place. Numerous processes occur concomitantly, which makes it difficult to identify the diagenetic processes. The diagenetic processes refer to all processes (chemical or physical) that modify the skeletal remains. These processes are highly variable depending on the environmental factors (weather, temperature, age, sex, etc.), especially in the early stages. Numerous studies have evaluated bone diagenetic processes over long timescales (~millions of years), but fewer have been done over short timescales (between days and thousands of years). The objective of the study is to assess the early stages of diagenetic processes by Raman microspectroscopy over 12 months. The mineral and organic matrix modifications are monitored through physicochemical parameters. Ribs from six humans were buried in soil. The modifications of bone composition were followed by Raman spectroscopy each month. The decrease in the mineral/organic ratio and carbonate type-B content and the increase in crystallinity reveal that minerals undergo dissolution-recrystallization. The decrease in collagen cross-linking indicates that collagen hydrolysis induces the fragmentation of collagen fibres over 12 months.
Keywords: bone diagenesis; collagen; cross-links; mineral; raman spectroscopy; taphonomy.
Conflict of interest statement
The authors declare no conflict of interest.
Figures


Similar articles
-
Diagenetic processes in Quaternary fossil bones from tropical limestone caves.Sci Rep. 2020 Dec 8;10(1):21425. doi: 10.1038/s41598-020-78482-0. Sci Rep. 2020. PMID: 33293631 Free PMC article.
-
Raman hyperspectral imaging as an effective and highly informative tool to study the diagenetic alteration of fossil bones.Talanta. 2018 Mar 1;179:167-176. doi: 10.1016/j.talanta.2017.10.059. Epub 2017 Oct 31. Talanta. 2018. PMID: 29310218
-
Taphonomy and diagenesis of submerged bone: An experimental approach.Forensic Sci Int. 2025 May;370:112416. doi: 10.1016/j.forsciint.2025.112416. Epub 2025 Feb 28. Forensic Sci Int. 2025. PMID: 40054340
-
Contributions of Raman spectroscopy to the understanding of bone strength.Bonekey Rep. 2015 Jan 7;4:620. doi: 10.1038/bonekey.2014.115. eCollection 2015. Bonekey Rep. 2015. PMID: 25628882 Free PMC article. Review.
-
Nail Properties and Bone Health: A Review.J Funct Biomater. 2018 Apr 23;9(2):31. doi: 10.3390/jfb9020031. J Funct Biomater. 2018. PMID: 29690604 Free PMC article. Review.
Cited by
-
Biological sex estimation in experimentally burnt patellae: exploring sexual dimorphism through comparative analysis.Int J Legal Med. 2025 Jul;139(4):1971-1982. doi: 10.1007/s00414-025-03467-5. Epub 2025 Mar 14. Int J Legal Med. 2025. PMID: 40085240 Free PMC article.
References
-
- Hedges R.E.M. Bone diagenesis: An overview of processes. Archaeometry. 2002;44:319–328. doi: 10.1111/1475-4754.00064. - DOI
-
- Nielsen-Marsh C.M., Hedges R.E. Patterns of Diagenesis in Bone I: The Effects of Site Environments. J. Archaeol. Sci. 2000;27:1139–1150. doi: 10.1006/jasc.1999.0537. - DOI
-
- Fernández-Jalvo Y., Andrews P., Pesquero D., Smith C., Marín-Monfort D., Sánchez B., Geigl E.-M., Alonso A. Early bone diagenesis in temperate environments. Palaeogeogr. Palaeoclimatol. Palaeoecol. 2010;288:62–81. doi: 10.1016/j.palaeo.2009.12.016. - DOI
-
- Kendall C., Eriksen A.M.H., Kontopoulos I., Collins M.J., Turner-Walker G. Diagenesis of archaeological bone and tooth. Palaeogeogr. Palaeoclim. Palaeoecol. 2018;491:21–37. doi: 10.1016/j.palaeo.2017.11.041. - DOI
LinkOut - more resources
Full Text Sources

