Review
. 2022 Oct 1;11(10):1973.
doi: 10.3390/antiox11101973.

Glutathione and Glutaredoxin in Redox Regulation and Cell Signaling of the Lens

Affiliations
Review

Glutathione and Glutaredoxin in Redox Regulation and Cell Signaling of the Lens

Marjorie F Lou. Antioxidants (Basel). .

Abstract

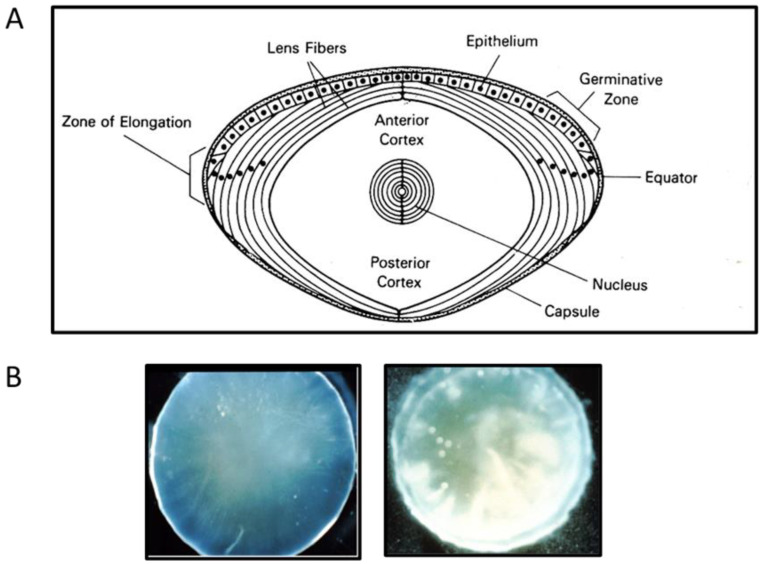
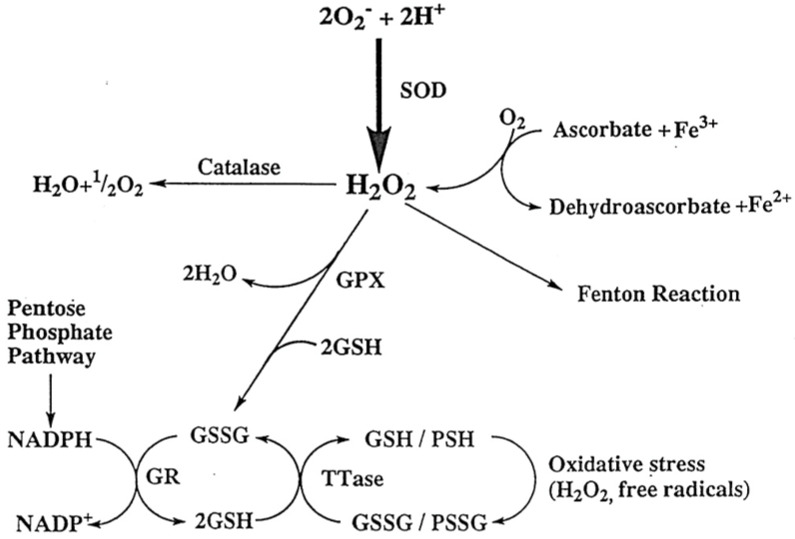
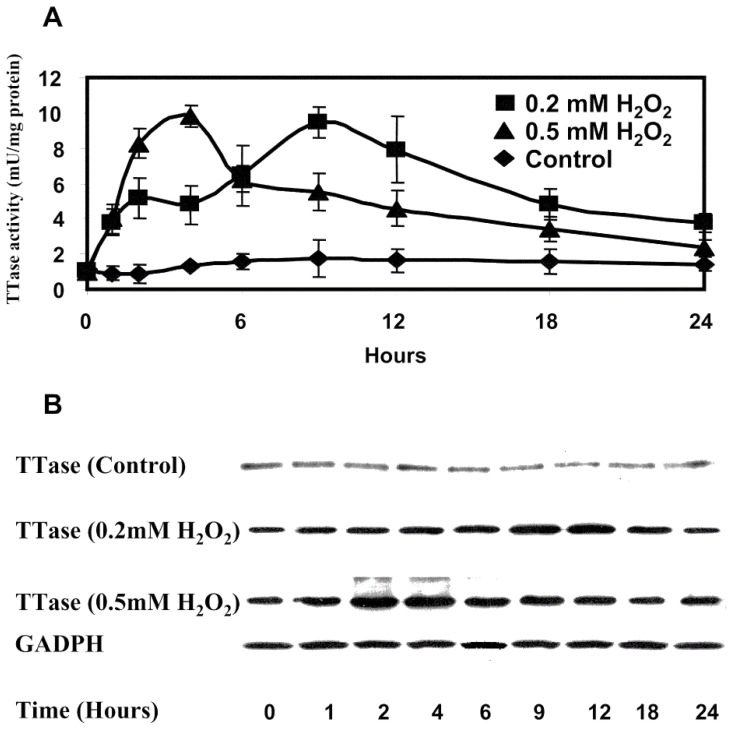
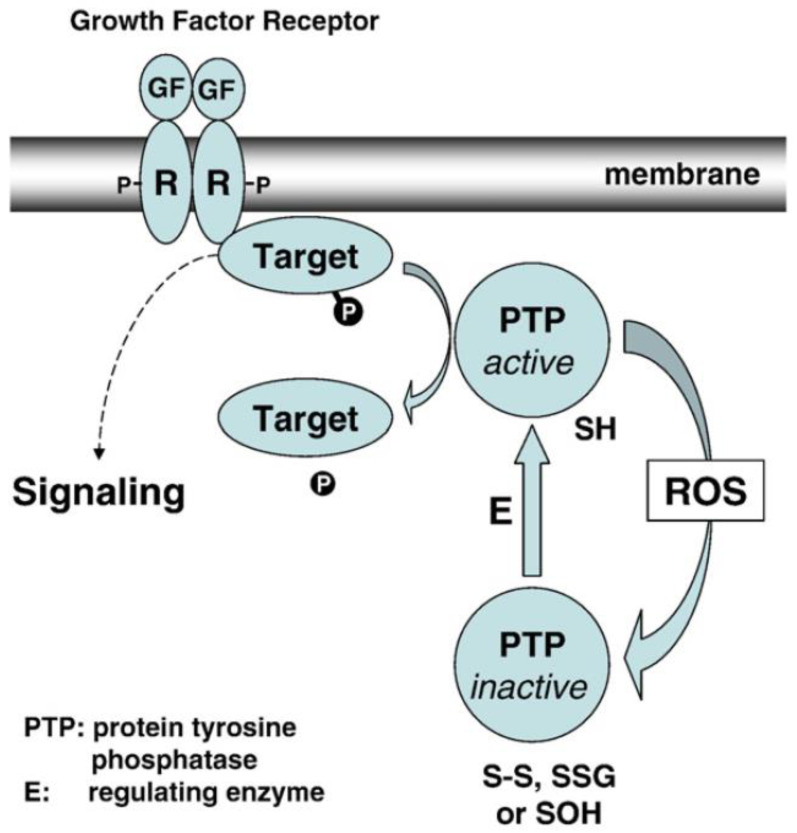
The ocular lens has a very high content of the antioxidant glutathione (GSH) and the enzymes that can recycle its oxidized form, glutathione disulfide (GSSG), for further use. It can be synthesized in the lens and, in part, transported from the neighboring anterior aqueous humor and posterior vitreous body. GSH is known to protect the thiols of the structural lens crystallin proteins from oxidation by reactive oxygen species (ROS) so the lens can maintain its transparency for proper visual function. Age-related lens opacity or senile cataract is the major visual impairment in the general population, and its cause is closely associated with aging and a constant exposure to environmental oxidative stress, such as ultraviolet light and the metabolic end product, H2O2. The mechanism for senile cataractogenesis has been hypothesized as the results of oxidation-induced protein-thiol mixed disulfide formation, such as protein-S-S-glutathione and protein-S-S-cysteine mixed disulfides, which if not reduced in time, can change the protein conformation to allow cascading modifications of various kinds leading to protein-protein aggregation and insolubilization. The consequence of such changes in lens structural proteins is lens opacity. Besides GSH, the lens has several antioxidation defense enzymes that can repair oxidation damage. One of the specific redox regulating enzymes that has been recently identified is thioltransferase (glutaredoxin 1), which works in concert with GSH, to reduce the oxidative stress as well as to regulate thiol/disulfide redox balance by preventing protein-thiol mixed disulfide accumulation in the lens. This oxidation-resistant and inducible enzyme has multiple physiological functions. In addition to protecting structural proteins and metabolic enzymes, it is able to regulate the redox signaling of the cells during growth factor-stimulated cell proliferation and other cellular functions. This review article focuses on describing the redox regulating functions of GSH and the thioltransferase enzyme in the ocular lens.

Keywords: cataract; cell proliferation; glutathione (GSH); protein-thiol mixed disulfide; reactive oxygen species (ROS); redox regulation; redox signaling; the ocular lens; thioltransferase (glutaredoxin).


Conflict of interest statement

Author declares that there is no conflict of interest.

Figures

Figure 1
Figure 1
Schematic diagram and photos of a mammalian lens. (A) Diagram depicts the capsule, epithelium layer, outer cortical (younger), inner cortical (older) fiber cells, and nucleus regions of a mammalian lens. (B) Photos of a clear (left) and an opaque, cataractous (right) human lens.
Figure 2
Figure 2
The reactive oxygen species and the antioxidant systems in the lens. H2O2-generated by the dismutation of superoxide anion or by the reaction between ascorbate and Fe3+ can be degraded by several pathways. These include Catalase, glutathione peroxidase and the Fenton reaction. The decrease in the SH/S-S ration by oxidation can be reversed by the glutathione reductase (GR)-pentose phosphate shunt cycle and by thioltransferase (TTase). These mechanisms protect the lens from oxidative damage. GR: glutathione reductase; GPx: glutathione peroxidase; SOD: superoxide dismuase; TTase: thioltransferase. Reprinted with permission from Lou, PRER (2003); Copyright Elsevier 2003 [8].
Figure 3
Figure 3
Hypothesized mechanism of the role of protein-S-S-glutathione in lens protein aggregation during cataract formation. Initial step, lens GSH is oxidized to GSSG and accumulated. 2nd step, GSSGs conjugate randomly with the thiol groups of crystallin proteins (native protein) to form protein-S-S-glutathione mixed disulfides (PSSGs). 3rd step, PSSG formation causes conformation change in crystallin proteins. Final step, Protein-S-S-protein (PSSP) crosslinking and/or other protein modifications occur with protein–protein aggregation. These changes lead to protein insolubility, opacification, and even pigmentation. Reprinted with permission from Lou, PRER (2003); Copyright Elsevier 2003 [8].
Figure 4
Figure 4
Formation and recovery of protein-thiol mixed disulfides in rat lenses during long term incubation with H2O2 (0.5 mM). The lenses were exposed to a constant concentration of H2O2 (0.5 mM). (A) Protein-S-S-glutathione (measured as GSO3H). (B). Protein-S-S-cysteine (measured as CSO3H). Five lenses of the same group were pooled and used for the analysis. Data are expressed as μmole/g dry wt., Mean ± SD, n = 5. The standard deviation values of the control and the recovery groups are too small to show in the plot. -○-: control group (untreated); -●-: H2O2 treated group (continuous H2O2 exposure); ⟥: recovery group (only first 24 h H2O2 exposure). Reprinted with permission from Cui and Lou, EER (1993); Copyright Elsevier 1993 [24].
Figure 5
Figure 5
The effect of H2O2 on TTase activity and expression in cultured porcine lenses. Fresh porcine lenses were divided into three groups with three lenses per group. Group one (control) was incubated in the absence of oxidant, groups two and three were was incubated in medium containing 0.2 mM H2O2 and 0.5 mM H2O2, respectively. Lenses were taken at indicated times, epithelial layers were removed, and the total soluble fraction prepared. (A) The lysate of the pooled three lens epithelial layers of each group was obtained at 0, 1, 2, 4, 6, 9, 12, 18, and 24 hours and analyzed for TTase activity. Data are the average of six determinations. Error bars, SEM. (B) Total soluble fractions (40 μg of protein) from the lysates in (A) were subjected to immunoblot analysis with antibody specific to TTase. GAPDH was used as the internal control. Reprinted with permission from Moon et al., IOVS (2005); Copyright ARVO 2005 [49].
Figure 6
Figure 6
Effect of a bolus of H2O2 on the activities of oxidation defense enzymes in HLE B3 cells. The activity is expressed as % of control untreated cells in three separate experiments (mean ± S.D.). The basal enzyme activity (untreated cells) was 7.8 ± 1.3 mU/mg protein for TTase; 142.4 ± 8.0 mU/mg protein for GST; 12.8 ± 1.4 mU/mg protein for GR and 18.7 ± 4.7 mU/mg protein for GPx. -Δ- GR, ⟥ GPx, -- GST, -■- TTase. Reprinted with permission from Xing and Lou, EER (2002); Copyright Elsevier 2002 [55].
Figure 7
Figure 7
Possible mechanism for redox signaling-induced TTase expression. Ras, Rac, Cdc42, Rho are small GTP-binding proteins; MAPK: mitogen activated protein kinase; MAPKK: MARK kinase; MAPKKK: MAPKK kinase; Raf-1-MEK 1,2-ERK1,2 represents the mitogenic pathway; MEKK 1,3-MEK 4,7-JNK/SAPK represents stress/mitogenic-pathway; TAK 1-MEK 3,6-p38 represents stress-associated pathway; AP-1 represents the transcription factor consists of c-Jun and c-fos heterodimer; ref-1 represents the redox sensor for AP-1; httase: human thioltransferase gene and TTase: thioltransferase. Reprinted with permission from Lou, PRER (2003); Copyright Elsevier 2003 [8].
Figure 8
Figure 8
Confocal images of intracellular ROS generation upon platelet-derived growth factor (PDGF) stimulation in live HLE cells. Live HLE cells were preloaded with DCFH-DA (50 μM) to capture the ROS generated upon PDGF (1 ng/mL) stimulation. Confocal cell images represent a random field after PDGF exposure. (A) PDGF-stimulated cells at 10 min. (B) Non-PDGF-stimulated cells at 10 min. (C) Catalase (I mg/mL) preloaded cells at 10 min after PDGF exposure. (D) Inhibition of PDGF-stimulated ROS generation by antioxidants and free radical scavengers. Inhibition of the DCF fluorescence induced by PDGF (1 ng/mL) in situ is expressed as a function of time in the presence of catalase (1 mg/mL), N-acetylcysteine (NAC, 30 mM) or mannitol (Man, 100 μM). The data are expressed as the mean ± SD with n = 3. ♦, cells stimulated by 1 ng/mL PDGF alone with no preloading; , cells preloaded with N-acetylcysteine (NAC, 30 mM); ⟥, cells preloaded with catalase (Cat, 1 mg/mL); solid triangle ▲, cells preloaded with mannitol (Man,100 mM). Reprinted with permission from Chen et al., EER (2004); Copyright Elsevier 2004 [83].
Figure 9
Figure 9
Effect of H2O2 on the proliferation of HLE B3 cells. Cells (5.25 × 10⁵) were gradually depleted from serum and used for cell proliferation by thymidine incorporation. The cells were exposed to H2O2 (0, 1, 5, 10, 20, 50 μM) in the presence of (methyl-3H)-thymidine (1 μCi /mL) for 1 h before harvesting for analysis. Thymidine incorporation in cells is expressed as dpm/μg DNA. The data are an average of three separate experiments (mean ± SD) with * p < 0.08 and ** p < 0.05. Reprinted with permission from Chen et al., EER (2004); Copyright Elsevier 2004 [83].
Figure 10
Figure 10
The proposed mechanism of PDGF signaling in the lens epithelial cells. The solid line indicates the known or published pathway and the dashed line represents proposed new pathway. In the figure, EGF denotes Epidermal growth factor, GPCR indicates G protein coupled receptor, PI3K indicates Phosphatidyl inositol-3-kinase, cPLA2 denotes Cytosolic phospholipase 2, PL indicates Phospholipid, AA denotes Arachidonic acid, PKC indicates Protein kinase C, and ROS denotes Reactive oxygen species. Reprinted with permission from Chen et al., Molecular Vision (2007); Free Access [91].
Figure 11
Figure 11
Effect of p22phox expression on the activation of PDGF receptor and LMW-PTP activity induced by PDGF in HLE B3 cells. (A) The Western blot analysis of PDGF-activated (phosphorylated) Tyr857 on PDGF receptor of HLE B3 cells. PDGF (20 ng/mL)-stimulated p22-KD, p22-OE, and Vec cells for 0, 10, 20, 30, 40, and 60 min were lysed and immunoblotted for P-Tyr857 PDGF receptor with anti-P-PDGFR antibody. The blot was also reprobed with anti-PDGFR antibody for control. The Western blot analysis is a typical pattern from three independent experiments. (B) Inhibition of PDGF-stimulated Tyr857 of PDGFR activation in p22-OE cells by antioxidant NAC. The detection of phosphorylated PDGF at Tyr857 was done by Western blot analysis in p22-OE cells. The p22-OE cells were pretreated with or without NAC for 60 min followed by the treatment of PDGF (20 ng/mL) for 20 min. Each lane contains 25 μg of cell lysate protein. The blot was reprobed with anti-PDGFR antibody as the control. (C) Analysis of LMW-PTP activity in PDGF-stimulated p22-KD, p22-OE, and Vec cells. The cells were stimulated with 20 ng/mL of PDGF for 0 and 15 min, and immunoprecipitated for LMW-PTP using anti-LMW-PTP antibody. Each immunoprecipitant was used for LMW-PTP activity assay. The results are the average of three independent experiments and are expressed as the mean ± SD. * p < 0.05 compared with Vec cells in the same treatment conditions (ANOVA). Reprinted with permission from Wang and Lou, IOVS (2009); Copyright ARVO 2009 [92].
Figure 12
Figure 12
The proposed molecular mechanism of NOX regulation in PDGF-induced mitogenic signaling. Dashed line: proposed pathway; solid line: known pathway. Reprinted with permission from Wang and Lou, IOVS (2009); Copyright ARVO 2009 [92].
Figure 13
Figure 13
Evidence for the TTase-dependent LMW-PTP function in the mouse lens epithelial cells. (A). Immunoblot analysis of TTase and LMW-PTP from wild type (WT) and TTase knock-out (KO) mouse lens epithelial cells. Cell extract containing 30 g protein was resolved on 10% SDS-PAGE gel. TTase and LMW-PTP were probed with respective antibody. (B). PDGF-induced inactivation of LMW-PTP in WT (■) and KO () mouse lens epithelial cells. Serum-deprived cells were stimulated with PDGF (1 ng/mL) for 0, 15, and 60 min, harvested, lysed and immunoprecipitated for activity assay. Data are expressed as means ± SD, with n = 3. (C). Comparison of the PDGF-induced activation of PDGFRβ, Akt and ERK ½ in WT and KO mouse lens epithelial cells. Serum-deprived cells were stimulated with PDGF (1 ng/mL) for 0, 15 and 60 min, harvested and lysed. Cell lysate (50 g proteins) was applied on 10% SDS-PAGE gel, transferred to membrane and probed with antibodies to PDGFRβ (internal control), P-PDGFRβ (Tyr857), P-Akt and P-ERK1/2, respectively. The Western blots shown are the representative of three separate experiments. Reprinted with permission from Xing et al., BBA (2007); Copyright Elsevier 2007 [100].
Figure 14
Figure 14
Hypothesis on the function and redox regulation of LMW-PTP in human lens epithelial cells. Growth factor (GF)-mediated mitogenic cell signaling begins by binding at the cell membrane to initiate autophosphorylation (P) at the receptor (R) and downstream target molecules (target-P) from protein tyrosine kinase. GF binding-induced in situ ROS oxidizes active PTP-SH (protein tyrosine phosphatase, such as LMW-PTP) to its inactive form (PTP with-S-S-, S-S-G or S-OH). Inactive PTP is reduced and activated back to PTP-SH by E (regulating enzyme system, such as TTase) to dephosphorylate and inactivate target proteins (target + P), allowing the completion of cell signaling. Reprinted with permission from Xing et al., BBA (2007); Copyright Elsevier 2007 [100].
Figure 15
Figure 15
H2O2 detoxification in TTase+/+, TTase−/−, and pure TTase enzyme loaded TTase−/− mouse LECs. ROS fluorescence was measured by fluorescence-activated cell sorter (FACS). The H2O2 (50 μM) treatment time course of the mean DCF fluorescence intensity was followed for TTase+/+ (■), TTase-loaded TTase−/− (O), and TTase−/− (●). Error bars indicate SD, n = 5. * Significant difference from the TTase+/+ and TTase-loaded TTase−/− cells (p < 0.05). Reprinted with permission from Lofgren et al., IOVS (2008); Copyright ARVO 2008 [109].
Figure 16
Figure 16
Age-dependent changes of the TTase system in human lenses. Twenty-three normal human lenses, divided into second, third, fifth, sixth, and seventh decades, were used for the study. The data are shown as mean ± SD, with the number of lenses indicated as (n) in each decade. (A) TTase activity in mU/g lens wet weight. (B) GR activity in mU/g lens wet weight. (C) GSH level expressed as percentage of second decade. (D) Homogenates from 19-, 31-, 49-, 52-, 60-, and 77-year-old lenses were selected for immunoblot analysis for GR with a specific anti-GR antibody. The blot shown is a representative of three separate analyses. Reprinted with permission from Xing and Lou, IOVS (2010); Copyright ARVO 2010 [112].
Figure 17
Figure 17
Comparison between thiol repair enzyme activities in normal nucleus and those in ECCE cataractous lenses. ECCE (extracapsular cataract extraction) procedure obtained nuclear portions of nine normal, clear human lenses (Ctl) and whole tissues of human ECCE cataractous lenses of different types of cataracts were used. The cataractous lens samples included 28 cortical (Cor), 26 nuclear (Nuc), 17 mixed cortical and nuclear (Mix), 17 mature cataracts (Mat), and 9 hypermature cataracts (Hyp). Each lens preparation was assayed for GR, TR, TTase, and TRx activities. An aliquot of deproteinized lens homogenate was used for GSH analysis. Data are expressed as means ± SD. * p < 0.05 by comparison with the control. Equal amounts of proteins from the above sample preparation were used for Western blot analysis for the protein content of TTase, GR, and Trx, using specific antibodies for TTase, GR, and Trx. (A) GSH level; (B) GR activity; (C) TTase activity; (D) TR activity; (E) Trx activity; (F) Western blot analysis of TTase, GR, and TRx in human cataractous lenses. Reprinted with permission from Wei et al., IOVS (2015); Copyright ARVO 2015 [113].

References

    1. Berman E.R. Biochemistry of the Eye. Plenum Press; New York, NY, USA: 1991. pp. 201–290.
    1. Kinoshita J.H. Selected topics in ophthalmic biochemistry. Arch. Ophthalmol. 1964;72:554–572. doi: 10.1001/archopht.1964.00970020554022. - DOI - PubMed
    1. Datiles M.B., Kinoshita J.H. Pathogenesis of cataracts. In: Tasman W., Jaeger E., editors. Clinical Ophthalmology. Lippincott Press; Philadelphia, PA, USA: 1991. pp. 1–14.
    1. Augusteyn R. Protein modification in cataract: Possible oxidative mechanisms. In: Duncan G., editor. Mechanisms of Cataract Formation in the Human Lens. Academic Press; New York, NY, USA: 1981. pp. 72–115.
    1. Spector A. Oxidative stress-induced cataract: Mechanism of action. FASEB J. 1995;9:1173–1182. doi: 10.1096/fasebj.9.12.7672510. - DOI - PubMed

LinkOut - more resources